Open Access
Research article
Unveiling an ancient biological invasion: molecular analysis of an old
European alien, the crested porcupine (Hystrix cristata)
Emiliano Trucchi* and Valerio Sbordoni
Address: Department of Biology, Tor Vergata University, 00133 Rome, ItalyEmail: Emiliano Trucchi* - [email protected]; Valerio Sbordoni - [email protected] * Corresponding author
Abstract
Background: Biological invasions can be considered one of the main threats to biodiversity, and
the recognition of common ecological and evolutionary features among invaders can help developing a predictive framework to control further invasions. In particular, the analysis of successful invasive species and of their autochthonous source populations by means of genetic, phylogeographic and demographic tools can provide novel insights into the study of biological invasion patterns. Today, long-term dynamics of biological invasions are still poorly understood and need further investigations. Moreover, distribution and molecular data on native populations could contribute to the recognition of common evolutionary features of successful aliens.
Results: We analyzed 2,195 mitochondrial base pairs, including Cytochrome b, Control Region
and rRNA 12S, in 161 Italian and 27 African specimens and assessed the ancient invasive origin of Italian crested porcupine (Hystrix cristata) populations from Tunisia. Molecular coalescent-based Bayesian analyses proposed the Roman Age as a putative timeframe of introduction and suggested a retention of genetic diversity during the early phases of colonization. The characterization of the native African genetic background revealed the existence of two differentiated clades: a Mediterranean group and a Sub-Saharan one. Both standard population genetic and advanced molecular demography tools (Bayesian Skyline Plot) did not evidence a clear genetic signature of the expected increase in population size after introduction. Along with the genetic diversity retention during the bottlenecked steps of introduction, this finding could be better described by hypothesizing a multi-invasion event.
Conclusion: Evidences of the ancient anthropogenic invasive origin of the Italian Hystrix cristata
populations were clearly shown and the native African genetic background was preliminary described. A more complex pattern than a simple demographic exponential growth from a single propagule seems to have characterized this long-term invasion.
Background
The widespread introduction of non-native species has long been regarded as one of the major anthropogenic global changes and threats to biodiversity [1,2]. The remarkable economic and ecological costs of biological
invasions make the management of invaders one of the leading challenges in conservation biology [3,4]. Standard methodologies implemented in population biology and new statistical tools recently developed in genetic analysis could help elucidate features and patterns relevant to Published: 18 May 2009
BMC Evolutionary Biology 2009, 9:109 doi:10.1186/1471-2148-9-109
Received: 23 June 2008 Accepted: 18 May 2009 This article is available from: http://www.biomedcentral.com/1471-2148/9/109
© 2009 Trucchi and Sbordoni; licensee BioMed Central Ltd.
This is an Open Access article distributed under the terms of the Creative Commons Attribution License (http://creativecommons.org/licenses/by/2.0), which permits unrestricted use, distribution, and reproduction in any medium, provided the original work is properly cited.
invasive biology [5]. Likewise, a comprehensive investiga-tion of ecology and phylogeography of native source pop-ulations may suggest new insights into colonization and rapid evolutionary dynamics of invasive species [6]. The scarcity of genetic data on the native range of successful aliens has recently been highlighted, along with the sug-gestion that further comparative studies could address these data in order to recognize some common evolution-ary features among invaders [7].
Recently, a general warning on the importance of long-term perspective in invasion biology studies has been raised. Indeed, many researches have dealt with the acute phase of an invasion (i.e., the period soon after the intro-duction event), often lacking an adequate temporal con-text (see review in [8]). In particular, scientific efforts should be directed to better understand the long-term changes that occur in the environment and community of both invading and invaded species [9]. In order to clarify the patterns and the evolutionary consequences of biolog-ical invasions, long-term perspective studies should focus on different aspects of the introduced populations, such as their genetic diversity and structure, population size at introduction (propagule pressure), growth rate and demographic trend [7]. Considering the usefulness of molecular investigations in such retrospective studies [10], in this paper we focus on the analysis of genetic diversity, population structure and demographic trend of a putative ancient European invader, the crested porcu-pine Hystrix cristata.
Three species of the old world porcupines (Hystricidae, Rodentia), morphologically grouped in the Hystrix subge-nus, occur all over Asia (H. indica) and Africa (H. cristata and H. africaeaustralis). The Cape porcupine (H. africae-australis) inhabits the South Africa region, from Cape of Good Hope to the borders of Central Africa tropical rain-forests, while the crested porcupine (H. cristata) lives in North Central Africa, from the Mediterranean coast to Northern Zaire and Tanzania, and in mainland Italy and Sicily [11]. These species are characterized by an extremely wide ecological tolerance: they can be found in arid grass-land and semi-desert habitats, in Mediterranean shrub lands and deciduous forests, as well as on the Atlas and Kilimanjaro mountains, up to 3,500 m (a.s.l) of altitude. The origins of the Italian populations of H. cristata have long been debated. Based on the timescale of fossil and archaeological records [12] and on historical chronicles (Plinius, Naturalis Historia, VIII, 53), it was hypothesized that this species was introduced from Africa, in the late Roman Age, as a game animal. However, such hypothesis has recently been questioned, and a native European ori-gin of the Italian porcupine has been suggested [13]. A recent spread in North and Central-East Italy over the last century has been well documented, and the presence of
archaeological and distributional records from areas where the species is now absent has also been recorded [14]. Given a maximum density of 2–4 specimens/ Km2[15] and the current area of occurrence, the popula-tion living in North-Central Italy can be estimated as ca. 80,000–120,000 individuals.
The main aim of this study is to highlight the geographical origin and the history of the Italian Hystrix cristata popu-lations by means of genetic analyses, considering the hypothesis of their introduction in recent times. We also investigate the demographic parameters that characterize this putative invasion, on the basis of the genetic diversity and structure of the Italian populations. Moreover, pre-liminary genetic data on the African native range are shown.
Results
A total of 2,195 mitochondrial bp, including 726 bp of the cytochrome b (cyt b) gene, 881 bp of the Control Region (CR) and 588 bp of tRNA-Phe and partial rRNA 12S genes, were successfully sequenced and aligned in 179 individuals of H. cristata, 9 of H. africaeaustralis and one of H. indica (Fig. 1). The summary statistics of the molecular diversity, considering different geographical and phylogenetic partitions, were calculated for the whole mtDNA fragment as well as for each gene, separately [See Additional file 1]. As a whole, 23 segregating sites in H. africaeaustralis and 113 in H. cristata identify 20 and 9 dif-ferent haplotypes, respectively. The cyt b fragment is char-acterized by a 36/4 Synonymous/Non-Synonymous substitutions ratio in H. cristata, 1/1 in H. africaeaustralis and 63/7 in the pooled sample. Considering the whole mtDNA fragment, net genetic distances are: 0.057 (SD 0.002) between H. cristata and H. africaeaustralis; 0.138 (SD 0.002) between H. cristata and H. indica; 0.112 (SD 0.01) between H. africaeaustralis and H. indica. The Italian populations of H. cristata have the lowest values for each statistic, with a total of 5 segregating sites and 7 haplo-types, haplotype diversity (Hd) ranging from 0.28 to 0.62 and average nucleotide diversity per site (π) ranging from 0.0001 to 0.0004. All newly recognized haplotypes have been submitted to GenBank database [Accession Num-bers: FJ472530–FJ472546].
Hystrix cristata haplotypes were organized in two well-sup-ported clades as evidenced by both Maximum Likelihood and Bayesian (data not shown) analyses: a Mediterranean clade, including the samples from Italy, Tunisia and Morocco, and a Sub-Saharan clade, comprising those from East Africa, Burkina Faso, Libya and a Tunisian hap-lotype (Fig. 2). A clear separation of the two African Hys-trix species is also supported. Tree topology reveals a close relationship between the Italian samples and Tunisian haplotype Tun-A and an association between this group
and the Moroccan sub-clade. Tunisia samples show a par-ticular phylogeographical structure, as the haplotypes from this region were both found in the Moroccan sub-clade and in the Sub-Saharan sub-clade; moreover, Tunisia-Libya samples formed a well-supported group with Eri-trean samples. The whole H. indica mtDNA fragment and partial rRNA 12S sequences of H. brachyurus, Aterurus macrurus and A. africanus were used as outgroup [Gen-Bank Accession Numbers: AY012117; U12451; AY093658].
Median-Joining Network of the Mediterranean haplo-types is shown in Figure 3a, applying a 0.90% parsimony threshold [16]. In Italy, two common haplotypes (Ita-A and -B) are present in the North-Central and Sicilian pop-ulations; three less common haplotypes (Ita-C, -D and -F) were found in Central Italy population, while haplotype Ita-E has a broad area of occurrence in the North-Central region (from 42,356° S to the upper limit of the recent northward colonization front). Another haplotype (Ita-G, 1 substitution in the cyt b gene), was sampled only in South Italy. As stated above, Tun-A is the closest relative of
the Italian haplotypes and it was found in the North and in the Centre of Tunisia. A close relationship between the other Mediterranean haplotype (Tun-C) sampled in Tuni-sia and those from Northern Morocco was identified. Here, Mor-B and Mor-C were sampled in West-Central Morocco while Mor-A and Mor-D belong to the Northern Mediterranean coast. Extended branching links, corre-lated with an extremely wide geographical distribution of the samples, characterize the Sub-Saharan haplotypes median-joining network (data not shown). Global FST of African H. cristata native source populations is 0.66 (p = 0).
The timescale of Italian invasion was inferred by means of coalescence-based Bayesian analyses, under two different tree priors which model population size changes through time. Only CR data were used in these analyses. The time to the most recent common ancestor (tMRCA) posterior densities of all introduced haplotypes and of two sub-groups are shown in Figure 3b and Figure 3c. Given an intraspecific CR substitution rate of 0.4 subs/site/Myr (see Methods), the root of all samples ranges from 3.35 kyrbp
Samples distribution
Figure 1
Samples distribution. Geographical location of the analyzed samples: 179 H. cristata and 9 H. africaeaustralis [see Additional
file 2]. Occurrence areas of the two major H. c. clades and of H. a. are coloured (modified from [11]). Colour of Italian samples correspond to haplotype network in Figure 3a.
8° E 12°E 16° E 38° N 42° N 46° N 30° S E q 30° N 10° W 10° E 30° E H. c . Mediterranean clade H. c. Sub-Saharan clade H. africaeaustralis
ML phylogeny
Figure 2
ML phylogeny. ML haplotypes tree. Significant node bootstrap support is given. Refer to Additional file 1 for haplotype
names; A.afr: Aterurus africanus; A.mac: A. macrurus; H.bra: Hystrix brachyurus.
Mor-B
Mor-A
Tnz-A
BuF-A
Eth-A
Eri-A
Zam-A
SAf-C
ITA-B
Nam-C
ITA-E
Nam-D
Mor-C
A.afr
ITA-A
Eri-B
ITA-F
ITA-D
ITA-G
Zam-B
Nam-A
Tun-C
Lib-A
In02
H.bra
Tun-A
A.mac
Nam-B
SAf-B
Mor-D
SAf-A
Tun-B
ITA-C
100
98
100
95
96
H.c.
Mediterranean clade
H.c.
Sub-Saharan clade
H. africaeaustralis
Mediterranean clade Median-Joining Network and Italian haplotypes timescale
Figure 3
Mediterranean clade Median-Joining Network and Italian haplotypes timescale. Median Joining Networks of H.
cristata Mediterranean clades. Circle size is proportional to sample size (a). TMRCAs posterior probability density in Subs/site (S/s) of all introduced haplotypes and of two sub-groups, considering a population size expansion model (b) or a constant pop-ulation size model (c); mean and 95% HPD are given in kyr.
0 0.001 0.002 0.003 0.004 0 2000 0.001 0.002 0.003 0.004 0 2500 Expansion_growth Mean 2.9 1.3 1.2 95% HPD 0.4-6.7 0.1-3.0 0.1-2.9 μ = 0.4 Subs/site/Myr Constant_size Mean 3.3 2.1 1.1 95% HPD 0.6-7.3 0.2-5.3 0.1-2.7 μ = 0.4 Subs/site/Myr
(b)
(c)
S/s Density Density S/s 1 substitution Mor-A Mor-D Tun-C Mor-C Mor-B Ita-F Tun-A Ita-GIta-C Ita-A Ita-B Ita-D Ita-E H.c. Mediterranean clade(a)
(0.6 – 7.3 kyrbp HPD 95%), under the Cons_s model, to 2.9 kyrbp (0.4 – 6.7 kyrbp HPD 95%), under the Expa_g model.
North-Central Italy population was used to investigate the demographic parameters that might have characterized the Italian expansion. Neutrality tests did not give signifi-cant results (Fu's Fs: -0.815, p: 0.36; R2: 0.100, p: 0.62). Similarly, mismatch distribution in the CR sequences (τ = 0.931, time since expansion ≈ 1.8 kyrbp, 1.3 – 2.7 kyrbp according to 95% CR) did not agree with a sudden expan-sion model, being the sum-of-squared-differences (SSD) statistics equal to 0.01, with p = 0.04 (Fig. 4). Genetic traces of past demographic trend were also inferred in a Bayesian framework. The demographic analysis using the Bayesian Skyline Plot as tree prior (data not shown) did not give significant results. In particular, there was no evi-dence of demographic expansion of the North-Central Italy H. cristata population in the recent past. A Bayes Fac-tor (BF) evaluation between pairs of three analyses, which employed different coalescent tree priors, allowed us to fully reject the Expo_g model (lnBF: Cons_s – Expo_g = 9.7; Expa_g – Expo_g = 9.9), but did not significantly pre-fer either of the two other models (lnBF Expa_g – Cons_s = 0.117). Indeed, the demographic reconstruction under the Expa_g tree prior suggested a population size increase only in very recent times, after a long period of size stasis post-introduction (data not shown).
Discussion
Our results confirm the ancient non-native origin of the Italian H. cristata populations: i) the summary molecular statistics, derived from three mitochondrial genes, high-lights the African genetic diversity as being more complex when compared with the Italian; ii) the phylogenetic anal-ysis shows the close relationship between the Italian and the Tunisian populations; iii) the median-joining network analysis suggests that a Tunisian and the most widespread Italian haplotypes share a common ancestor. These results indicate the Tunisian area as being the most probable source of the Italian introduced populations. In our sam-ple the native geographic range is represented by only five individuals with a global native range FST of 0.66. This supports the assignation of introduced haplotypes to a particular source region with a confidence index of 0.95 (accuracy at regional level of 0.9) as shown by Muirhead et al. [17]. The median-joining network analysis also reveals the simple genetic structure of the introduced Ital-ian populations i.e., a single mitogenetic clade of strictly related haplotypes. Both Central-North Italy and the Sicil-ian populations share the common haplotypes (Ita-A and Ita-B), while Ita-B seems to be absent from southern Italy. Archaeological records and historical chronicles (Plinius, Naturalis Historia, VIII, 53) do not support an
introduc-tion of this species in Italy before the late Roman Empire. The first calibrated sub-fossil of H. cristata was found in South Italy (Basilicata) and dates back to 1.5 kyrbp [13]. Since we found a close relationship between the Italian and the Tunisian haplotypes, a putative time frame for introduction could span from the early colonization of Sicily by the Phoenicians (ca. 2.5 kyrbp) [18] to the first Italian sub-fossil record. In the light of these considera-tions, H. cristata could have been introduced in Sicily or in mainland Italy during this 1 ky-time frame as a game spe-cies, as threatening beasts in circus games or as exotic ani-mals in rich Roman country homes. Considering the coalescent-based Bayesian approach, the time-measured phylogeny of introduced haplotypes partially agrees with this historical framework. However, even if the molecular clock was calibrated using a very fast intraspecific substi-tution rate [19,20], the mean value of Italian haplotypes tMRCA was dated back to ca. 3 kyrbp, farther than the above hypothesized time span. Conversely, the two recog-nized Italian subgroups seem to have evolved in situ, dur-ing the early phases of colonization and spread (2.1–1.1 kyrbp). Nevertheless, this scenario would need to be sup-ported by a rare event of molecular diversity retention in the bottlenecked population during the founding event [21], since genetic drift reduces genetic variation in small populations [22]. Likewise, since Central-North Italy and Sicily share the common Ita-A and Ita-B haplotypes, this rare genetic event during introduction might have occurred in both regions. The possibility of a further accel-eration of the molecular substitution rates in extremely recent events as this could also be taken into account [23]. In fact, a time-dependency of the molecular clock rates has been recently proposed and discussed [24,25]. As for H. cristata introduction, a substitution rate of 0.5 – 0.6 subs/ site/Myr in the mtDNA CR has to be accepted if we con-sider that the whole Italian molecular diversity was gener-ated in situ.
A review of the most recent literature of the demographic parameters that characterize the colonization dynamics does not provide clear evidence of a common pattern dur-ing colonization. A successful invasion can take place as a multiple introduction of few individuals from genetically differentiated native populations [26,27], or as a single founder event from extremely bottlenecked gene pools [28]. Being an invasive species, the present population size of Italian H. cristata is the result of a demographic and spatial expansion though the genetic signature of this remarkable growth is not revealed by molecular statistics. Although there is evidence of an extremely recent demo-graphic increase, the coalescent-based Bayesian analysis does not clearly support a population expansion model. Since this demographic analysis is based on the assump-tion of a single panmittic populaassump-tion at mutaassump-tion/drift equilibrium, the results may be better explained by
hypothesizing more than one event of introduction of iso-lated propagules.
As for the genetic background of H. cristata native range, the phylogenetic reconstruction highlighted the existence of two different haplogroups, Sub-Saharan and Mediterra-nean. The high level of genetic differentiation of the Sub-Saharan clade advocates for a complex evolutionary his-tory, probably related to the broad geographical area of occurrence. Indeed, the haplotypes belonging to this clade were sampled in Central Africa as well as in Tunisia and Libya. The close relationship between the Tun-B/Lib-A and the Eritrean haplotypes suggests the existence of an ecological connection going from East to North Africa, encompassing the Sahara region. This hypothesis is sup-ported by strong evidence of humid phases characterizing North African climate (15-8 kyrbp) [29]. As for the second haplogroup, a low level of genetic differentiation can be detected. This could be the consequence of a less complex evolutionary history or a more recent diversification from a common ancestor when compared with the Sub-Saha-ran haplogroup. However, the evolution of native Sub-Saha-range H. cristata should be analyzed along with the environ-mental changes which occurred in Africa over the Late
Pleistocene and the Holocene [30]. As widely acknowl-edged in the Palaearctic Region [31], the distribution and the phylogeographical structure of several African taxa have largely been shaped by these past climatic shifts [32,33]. Further investigation in the North African native range would help to clarify the relationship between the evolutionary history of the African populations and the high invasive potential of the propagules coming from such populations.
Conclusion
Molecular data strongly evidenced the invasive origin of the Italian Hystrix cristata populations from North Africa (Tunisia) introduced during the Roman Age. Although demographic analyses failed to support a population size expansion from a single introduced propagule, they sug-gest a different scenario in favour of a multi-invasion event. Moreover, this study produced preliminary data on the genetic diversity of native range populations, and pro-vides a useful contribution for further comparative studies on successful aliens.
Methods
SamplesA total of 179 H. cristata samples (blood and quills) were collected in the field and analyzed between 2006 and 2007: 161 samples came from all over Italy and 18 sam-ples from different African populations in Burkina Faso, Eritrea, Ethiopia Libya, Morocco, Sierra Leone, Tanzania, and Tunisia. Moreover, nine H. africaeaustralis samples from Namibia, South Africa and Zambia were analyzed as representatives of the sister taxon species. One H. indica specimen from Israel was added in the phylogenetic anal-yses as outgroup. Location of specimens used in the statis-tical analyses are given in Figure 1 [see Additional file 2]. Genetics
Whole genomic DNA was extracted from blood and from modified hairs (quills) of each individual, and the Con-trol Region (CR) sequence was PCR amplified according to Trucchi et al. [34]. Two semi-nested primer pairs were developed in order to amplify a 726 bp fragment of cyto-chrome b (CytF1-Cyt06R and Cyt05F-Cyt02R), while the tRNA-Phe and rRNA 12 S partial sequences (588 bp) were amplified using the primer pairs: HyF4-H293 and L82-H618 [35]. All newly designed primers were successfully tested on the three species under investigation. Primer details are given in Table 1. PCR amplifications of Hystrix mitochondrial Cyt b, and rRNA 12S were carried out applying the following conditions: each 50 μL PCR reac-tion contained 3–4 μL genomic DNA elureac-tion, 100 pmol of each primer, 5 μL 10× PCR buffer, 0.2 mM dNTPs, 1.5 mM MgCl2, and 1.5 U Taq DNA polymerase (Eurotaq, EuroClone). PCR thermal profile included: initial pre-heating step at 95°C for 3 min, 35 cycles of 95°C for 30
North Central Italy population MMD
Figure 4
North Central Italy population MMD. Mismatch
distri-bution of pairwise differences in CR sequences among North Central Italy samples in comparison with the expected distri-bution from a non-constant population size model.
0 1 2 3 4
0.1 0.5
0.3
NorthCentral Italy
H. cristata
Mismatch Distribution
exp obs
Pairwise differences
sec, 56-54°C for 30 sec, 72°C for 30–60 sec, and a 7 min final extension at 72°C. (9700 Thermal Cycler, Applied Biosystem). We did not perform microsatellite analyses since low-quality genetic material, as DNA obtained from our non-invasive sampling strategy, is prone to genotyp-ing errors like allelic dropouts and false alleles identifica-tion (rev. in [36]). In our case, the possibility to reduce the errors collecting duplicate samples was not achievable. Data analyses
The sequences were edited and aligned using BIOEDIT[37]. Haplotype diversity Hd, segregating sites S, nucleotide diversity averaged per site π [38] and, Synonymous/Non-Synonymous ratio (as regards cytochrome b gene) were calculated using DNASP[39]. The same software was used to describe number and frequency of different haplotypes and to calculate θ per sequence from segregating sites [40], being this diversity value an informative synopsis of the metrics used. Net genetic distances based on the pro-posed GTR + Γ + I [41] model of sequence evolution were calculated on the whole analyzed mtDNA fragment, exporting tip-to-tip distances obtained from Maximum-Likelihood phylogeny calculated in TREEFINDER[42]. A Maximum-Likelihood (ML) and a Bayesian (Ba) methods were used to assess the phylogenetic relationships among mitochondrial haplotypes. TREEFINDER was used to evalu-ate the best-fit model of sequence evolution for each ana-lyzed data set, using the Akaike Information Criterion. As regards the whole dataset, the proposed model was a GTR + Γ + I with unequal base frequencies. TREEFINDER was used to build the ML phylogeny, while BEAST[43] was used to reconstruct the Ba phylogeny. Robustness of the ML trees was tested with 1,000 bootstrap replicates. The rela-tionship among the haplotypes belonging to each tree sub-clade was reconstructed by means of a Median-Join-ing network analysis, as implemented in NETWORK[44]. According to Muirhead et al. [17], global Fst among native populations was used to assess the confidence index to classify introduced individuals to a source geographic area. It could prevent incorrect identification of invasion source when a low number of individuals has been sam-pled in putative source populations. Three putative Afri-can sources were considered: Tunisia-Libya, Morocco, and East Africa comprising Eritrean, Ethiopian and Tanzanian samples. A Kimura 2-parameters distance method and 10,000 permutations was used to calculate global Fst with the software ARLEQUIN[45].
TMRCAs of all Italian haplotypes and of 2 sub-clades were estimate on the base of Control Region data using BEAST. Constant_size (Cons_s) and Expansion_growth (Expa_g) tree priors were compared as well as the Relaxed and the Strict molecular clock models. At least three independent runs 3 × 10⁶ steps long were performed for each dataset.
Convergence of chains, effective sample size, estimates and credible intervals for each parameter were analyzed with the program TRACER[43]. TMRCAs were dated using a 0.4 subs/site/Myr substitution rate. This rate has been pro-posed by Rajabi-Maham et al. [19] for intraspecific poly-morphism analyses in Mus musculus domesticus. Since similar mitochondrial substitution rates were recorded in Hystricidae and Muridae [46], this molecular rate was also considered in our study.
The mtDNA sequences were analyzed in order to find traces of demographic trend from introduction, growth rate and present population size. Several approaches were attempted. These analyses were performed only on the North Central Italy samples, which can be considered, to a large extent, as a panmittic expanding population. Only the fast-evolving mtDNA CR-I was used in these investiga-tions. Two different neutrality tests, which have been shown to be the most powerful [47], were used to investi-gate for population expansion or bottleneck on the sam-pled CR-I sequences: Fu's Fs [48] statistics were calculated, as implemented in ARLEQUIN and R2 [47] as implemented in DNASP. Significance of Fs was assessed by 10,000 rand-omization, while significance of R2 was determined by means of 10,000 coalescent simulation on the basis of observed number of segregating sites in the sample. The mismatch distribution of pairwise differences between sequences was examined to find genetic traces of the demographic trend. The sum-of-squared-differences (SSD) statistic was used to test the goodness-of-fit between the observed mismatch distribution and that expected under a sudden expansion model. The signifi-cance of SSD was assessed by 10,000 parametric bootstrap re-sampling [49], using ARLEQUIN. Past population demography was also investigated with a Bayesian Skyline Plot (BSP) [50], as implemented in BEAST. This coalescent-based approach calculates the effective breeding popula-tion size (Nef) through time directly from sampled sequence data and not from previously recognized phyl-ogeny. This procedure can therefore account for uncer-tainty associated with reconstructed phylogeny. The analysis was done using a different time segmentation ranging from 5 to 10 groups (past Nef points) and substi-tution model (HKY + I) [51]. Three independent runs of 50 × 106 iterations for each grouping scenarios were per-formed. In addition, separate runs were performed, using different coalescent tree priors which model population size through time: Cons_s, Expa_g and Exponential_growth (Expo_g). Three independent runs of 30 × 106 iterations for each scenario were done. Conver-gence of chains, effective sample size, estimates and cred-ible intervals for each parameters and demographic reconstructions were analyzed with the software TRACER. The three different demographic models were then com-pared to each other in order to assess their relative fit to
the data. Comparisons were made under TRACER work-space evaluating the marginal likelihood ratio (marginal with respect to the tree prior) of pairs of models (Bayes Factor calculation). The best approximation to the mar-ginal likelihood comparison was found calculating the Bayes Factor on the tree Likelihood trace [52,53].
Authors' contributions
ET carried out the molecular analyses, designed the study, performed the statistical analyses and wrote the manu-script. VS conceived and coordinated the study. All authors read and approved the final manuscript.
Additional material
Acknowledgements
This research was granted by Regione Lazio, Provincia di Roma and Osserv-atorio della Biodiversità del Lazio. Thanks to the kind collaboration of H. Azafzaf, R. Giannatelli, J. Shoshawi, G. Chiozzi, J.L. Ruiz, B. Massa, M.A. Bologna, G. Montinaro, M. Pitzalis, M. Di Cecco, M. Pellegrini, M. Visceglia, C. Bernardi, E. Aloisi Masella, A. Bonacci, U. Veken, C. Settanni, P. Parisi, A. Coluccini, E. Genovesi, F. Viviani, G. Speroni, N. Raffaelli, R. Vannucci, S. Elio, G. Cavalloni, G. Bertola, A. Coluccini, P. Politi, D'Amelia, Carotenuto, F. Scarfò, D'Amato, A. Romano, S. Marta, M. Di Rao, M. Lucarelli, M. Mat-toccia, G. Gentile, Baragio, Marchionni, Schiavano, S. De Felici, A. Fabiani, A. Marroni, Todini, F. Franconi, M. Cancellieri, G. Riccarducci, S. Sanrocco, F. Terragni, A. El Sehhar, G. Tito, A. Campanaro, M. Di Domenico, G.C. Bozano, ARP Lazio and RomaNatura that have provided the biological material. We wish to thank A. Fabiani and M. Lo Ponte for the English lan-guage revision and G. Gentile and P. Gratton for their helpful comments.
References
1. Mooney HA, Hobbs RJ: Invasive Species in a Changing World Washing-ton, D.C.: Island Press; 2000.
2. Lodge DM, Shrader-Frechette K: Nonindigenous species: ecolog-ical explanation, environmental ethics, and public policy.
Conserv Biol 2003, 17:31-37.
3. Allendorf FW, Lundquist LL: Introduction: Population biology, evolution, and control of invasive species. Conserv Biol 2003, 17:24-30.
4. Shirley SM, Kark S: Amassing efforts against alien invasive spe-cies in Europe. PLoS Biol 2006, 4(8):e279. DOI: 10.1371/jour-nal.pbio.0040279
5. Sakai AK, Allendorf FW, Holt JS, Lodge DM, Molofsky J, With KA, Baughman S, Cabin RJ, Cohen JE, Ellstrand NC, McCauley DE, O'Neil P, Parker IM, Thompson JN, Weller SG: The population biology of invasive species. Annu Rev Ecol Syst 2001, 32:305-332.
6. Slade RW, Moritz C: Phylogeography of Bufo marinus from its natural and introduced ranges. Proc R Soc Lond B Biol Sci 1998, 265:769-777.
7. Suarez AV, Tsutsui ND: The evolutionary consequences of bio-logical invasions. Mol Ecol 2008, 17:351-360.
Additional File 1
Summary molecular statistics. Summary statistics of geographic and
phylogenetic groups of analyzed samples for Cytochrome b, Control Region, rRNA 12S and the whole mtDNA fragment (composite).
Click here for file
[http://www.biomedcentral.com/content/supplementary/1471-2148-9-109-S1.xls]
Additional File 2
Sample details. Haplotype ID and locality of analyzed samples (gps point
in decimal degrees).
Click here for file
[http://www.biomedcentral.com/content/supplementary/1471-2148-9-109-S2.xls]
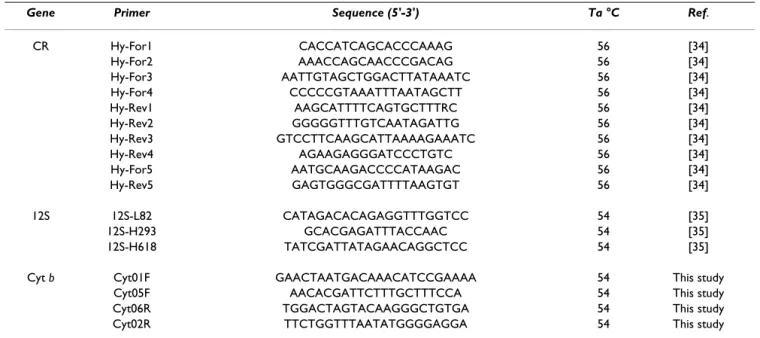
Table 1: Sequences and references of primers used in this study.
Gene Primer Sequence (5'-3') Ta °C Ref.
CR Hy-For1 CACCATCAGCACCCAAAG 56 [34] Hy-For2 AAACCAGCAACCCGACAG 56 [34] Hy-For3 AATTGTAGCTGGACTTATAAATC 56 [34] Hy-For4 CCCCCGTAAATTTAATAGCTT 56 [34] Hy-Rev1 AAGCATTTTCAGTGCTTTRC 56 [34] Hy-Rev2 GGGGGTTTGTCAATAGATTG 56 [34] Hy-Rev3 GTCCTTCAAGCATTAAAAGAAATC 56 [34] Hy-Rev4 AGAAGAGGGATCCCTGTC 56 [34] Hy-For5 AATGCAAGACCCCATAAGAC 56 [34] Hy-Rev5 GAGTGGGCGATTTTAAGTGT 56 [34] 12S 12S-L82 CATAGACACAGAGGTTTGGTCC 54 [35] 12S-H293 GCACGAGATTTACCAAC 54 [35] 12S-H618 TATCGATTATAGAACAGGCTCC 54 [35]
Cyt b Cyt01F GAACTAATGACAAACATCCGAAAA 54 This study
Cyt05F AACACGATTCTTTGCTTTCCA 54 This study
Cyt06R TGGACTAGTACAAGGGCTGTGA 54 This study
Cyt02R TTCTGGTTTAATATGGGGAGGA 54 This study
8. Strayer DL, Eviner VT, Jeschke JM, Pace ML: Understanding the long-term effects of species invasions. Trends Ecol Evol 2006, 21:645-651.
9. Strauss SY, Lau JA, Carroll SP: Evolutionary responses of natives to introduced species: what do introductions tell us about natural communities? Ecol Lett 2006, 9:357-374.
10. Avise JC: Phylogeography: The History and Formation of Species Cam-bridge, Massachusetts: Harvard University Press; 2000.
11. Kingdon J: The Kingdon Field Guide to African Mammals London: Aca-demic press; 1997.
12. Riquelme JA, Morales A: A porcupine find from roman Africa with a review of archaeozoological data from circummedi-terranean sites. Archaeofauna 1997, 6:91-95.
13. Angelici FM, Capizzi D, Amori G, Luiselli L: Morphometric varia-tion in the skulls of the crested porcupine Hystrix cristata from mainland Italy, Sicily and northern Africa. Mamm Biol 2003, 68:165-173.
14. Angelici FM, Amori G: Distribution of the Crested porcupine Hystrix cristata L., 1758 in peninsular Italy and Sicily. Mus Reg
Sci Nat Boll (Torino) 1999, 16:83-88.
15. Niethammer J: Hystrix cristata Linnaeus, 1758 – Stachelsch-wein. In Handbuck der Saugetiere Europas 2/I. Rodentia II Edited by: Niethammer J, Krapp F. Wiesbaden, Academische Verlagsgesellschaft; 1982:588-605.
16. Templeton AR, Crandall KA, Sing CF: A cladistic analysis of phe-notypic associations with haplotypes inferred from restric-tion endonuclease mapping and DNA sequence data. III. Cladogram estimation. Genetics 1992, 132:619-633.
17. Muirhead JR, Gray DK, Kelly DW, Ellis SM, Heath DD, MacIsaac HJ: Identifying the source of species invasions: sampling inten-sity vs. genetic diverinten-sity. Mol Ecol 2008, 17:1020-1035. 18. Leighton R: Sicily before History: An Archaeological Survey from the
Palae-olithic to the Iron Age Ithaca, N.Y., Cornell University Press; 1999.
19. Rajabi-Maham H, Orth A, Bonhomme F: Phylogeography and postglacial expansion of Mus musculus domesticus inferred from mitochondrial DNA coalescent, from Iran to Europe.
Mol Ecol 2008, 17:627-641.
20. Saarma U, Ho SYW, Pybus OG, Kaljuste M, Tumanov IL, Kojola I, Vorobiev AA, Markov NI, Saveljev AP, Valdmann H, Lyapunova EA, Abramov AV, Männil P, Korsten M, Vulla E, Pazetnov SV, Pazetnov VS, Putchkovskiy SV, Rõkov AM: Mitogenetic structure of brown bears (Ursus arctos L.) in northeastern Europe and a new time frame for the formation of European brown bear line-ages. Mol Ecol 2007, 16:401-413.
21. Abdelkrim J, Pascal M, Samadi S: Island colonization and founder effects: the invasion of the Guadeloupe islands by ship rats (Rattus rattus). Mol Ecol 2005, 14:2923-2931.
22. Tsutsui ND, Suarez AV, Holway DA, Case TJ: Reduced genetic variation and the success of an invasive species. Proc Natl Acad
Sci USA 2000, 97:5948-5953.
23. Pulquerio MJF, Nichols RA: Dates from the molecular clock: how wrong can we be? Trends Ecol Evol 2007, 22:180-184. 24. Ho SYW, Phillips MJ, Cooper A, Drummond AJ: Time dependency
of molecular rate estimates and systematic overestimation of recent divergence times. Mol Biol Evol 2005, 22:1561-1568. 25. Shapiro B, Drummond AJ, Rambaut A, Wilson MC, Matheus PE, Sher
AV, Pybus OG, Gilbert MTP, Barnes I, Binladen J, Willerslev E, Hansen AJ, Baryshnikov GF, Burns JA, Davydov S, Driver JC, Froese DG, Har-ington CR, Keddie G, Kosintsev P, Kunz ML, Martin LD, Stephenson RO, Storer J, Tedford R, Zimov S, Cooper A: Rise and fall of the Beringian steppe bison. Science 2004, 306:1561-1565.
26. Bonhomme M, Blancher A, Cuartero S, Chikhi L, Crouau-Roy B: Ori-gin and number of founders in an introduced insular primate: estimation from nuclear genetic data. Mol Ecol 2008, 17:1009-1019.
27. Lavergne S, Molofsky J: Increased genetic variation and evolu-tionary potential drive the success of an invasive grass. Proc
Natl Acad Sci USA 2007, 104:3883-3888.
28. Puillandre N, Dupas S, Dangles O, Zeddam JL, Capdevielle-Dulac C, Barbin K, Torres-Leguizamon M, Silvain JF: Genetic bottleneck in invasive species: the potato tuber mothadds to the list. Biol
Invasions 2008, 10:319-333.
29. Gasse F: Hydrological changes in the African tropics since the Last Glacial Maximum. Quat Sci Rev 2000, 19:189-211.
30. deMenocal PB: African climate change and faunal evolution during the Pliocene-Pleistocene. Earth Planet Sci Lett 2004, 220:3-24.
31. Hewitt GM: The genetic legacy of the Quaternary ice ages.
Nature 2000, 405:907-913.
32. Flagstad Ø, Syvertsen PO, Stenseth NC, Jakobsen KS: Environmen-tal change and rate of evolution: the phylogeographic pat-tern within the hartebeest complex as related to climatic variation. Proc R Soc Lond B Biol Sci 2001, 268:667-677.
33. Cosson JF, Hutterer R, Libois R, Sara M, Taberlet P, Vogel P: Phylo-geographical footprints of the Strait of Gibraltar and Qua-ternary climatic fluctuations in the Western Mediterranean: a case study with the greater white-toothed shrew, Crocidura
russula (Mammalia: Soricidae). Mol Ecol 2005, 14:1151-1162.
34. Trucchi E, Gentile G, Sbodoni V: Development of primers to amplify mtDNA control region of Old World porcupines (subgenus Hystrix). Mol ecol resour 2008, 8(5):1139-1141. 35. Nedbal MA, Allard MW, Honeycutt RL: Molecular systematic of
Hystricognathi rodents: evidence from the mitochondrial 12S rRNA gene. Mol Phylogenet Evol 1994, 3:206-220.
36. Pompanon F, Bonin A, Bellemain E, Taberlet P: Genotyping errors: causes, consequences and solutions. Nat Rev Gen 2005, 6:847-846.
37. Hall TA: bioedit: a user-friendly biological sequence align-ment editor and analysis program for Windows 95/98/NT.
Nucl Acids Symp Ser 1999, 41:95-98.
38. Nei M: Molecular Evolutionary Genetics New York, Columbia University Press; 1987.
39. Rozas J, Sánchez-Del Barrio JC, Messeguer X, Rozas R: dnasp, DNA polymorphism analyses by the coalescent and other meth-ods. Bioinformatics 2003, 19:2496-2497.
40. Watterson GA: On the number of segregating sites in geneti-cal models without recombination. Theor Popul Biol 1975, 7:256-276.
41. Tavaré S: Some probabilistic and statistical problems in the analysis of DNA sequences. Lect Math Life Sc 1986, 17:57-86. 42. Jobb G, von Haesler A, Strimmer K: TREEFINDER: a powerful
graphical analysis environment for molecular phylogenetic.
BMC Evol Biol 2004, 4:18.
43. Drummond AJ, Rambaut A: beast: Bayesian evolutionary analy-sis by sampling trees. BMC Evol Biol 2007, 7:214.
44. Bandelt HJ, Forster P, Rohl A: Median-joining networks for infer-ring intraspecific phylogenies. Mol Biol Evol 1999, 16:37-48. 45. Excoffier L, Laval G, Schneider S: arlequin ver. 3.0: an integrated
software package for population genetics data analysis. Evol
Bioinform Online 2005, 1:47-50.
46. Spradling TA, Hafner MS, Demastes JW: Differences in rate of Cytochrome-b evolution among species of rodents. J Mammal 2001, 82:65-80.
47. Ramons-Onsins SE, Rozas J: Statistical Properties of New Neu-trality Tests Against Population Growth. Mol Biol Evol 2002, 19:2092-2100.
48. Fu Y-X: Statistical tests of neutrality of mutations against population growth, hitchhiking, and background selection.
Genetics 1997, 147:915-925.
49. Schneider S, Excoffier L: Estimation of demographic parame-ters from the distribution of pairwise differences when the mutation rates vary among sites: application to humanmito-chondrial DNA. Genetics 1999, 152:1079-1089.
50. Drummond AJ, Rambaut A, Shapiro B, Pybus OG: Bayesian Coales-cent Inference of Past Population Dynamics from Molecular Sequences. Mol Biol Evol 2005, 22:1185-1192.
51. Hasegawa M, Kishino H, Yano T: Dating of the human-ape split-ting by a molecular clock of mitochondrial DNA. J Mol Evol 1985, 22:160-174.
52. Suchard MA, Weiss RE, Sinsheimer JS: Bayesian Selection of Con-tinuous-Time Markov Chain Evolutionary Models. Mol Biol
Evol 2001, 18:1001-1013.
53. beast user: A general user list for discussion about the BEAST MCMC program [http://groups.google.com/group/beast-users?hl=en]