Alma Mater Studiorum - Università di Bologna
Scuola di Dottorato di Ricerca
in Scienze Mediche e Chirurgiche
Dottorato di ricerca in Scienze Biomediche
Progetto formativo in Neurofisiologia
XXV ciclo
Settore scientifico-disciplinare di afferenza: BIO/09
Settore concorsuale di afferenza: 05/D1
Tesi di Dottorato
REGULATION OF WAKE-SLEEP
STATES AND STATE-DEPENDENT
CARDIOVASCULAR FUNCTION IN
DIET-INDUCED OBESITY RATS
Dott. Ampent Al Salam Al Tzachmani
Coordinatore:
Tutor:
Prof. Claudio Galletti
Prof. Roberto Amici
Dedication
To the soul of my father sheikh Yasein Aljahmany ( Abu Yarub)
To my Damascene poem: my daughter Shaam and my beloved wife
Dr.Eng. Dima Alkadri ; my small family, I have been justly questioned
by you, whether there would ever be a completion date for this
project? Now, that I have come this far. I would like to thank you for
being with me all along and in every step; I want to write different
words for you, to invent a language for you alone to fit the size of my
love
.Acknowledgement
This research project would not have been possible without the support of many people. First and foremost, I wish to express my gratitude to my supervisor, Prof. Roberto Amici, who was abundantly helpful and offered invaluable assistance, support and guidance. He inspired me greatly to work on this thesis. Words are inadequate in offering my thanks to the members of laboratory of Phyisological Regulation in the Wake-Sleep Cycle - Department of Biomedical and NeuroMotor Sciences / Bologna University who provided me with a good environment and facilities to complete this project: Prof. Emanuele Perez, Dr. Matteo Cerri, Dr. Marco Luppi, and Dr. Davide Martelli, without their knowledge and assistance this study would not have been successful. Also, my colleagues, Dr. Flavia Del Vecchio, Dr. Marco Mastrotto, I spent 3 years with you, and I thank you for your friendship and support that made me feel more at home. My stay with all of you has been an important part of my life and the memory of it will stay with me for the rest of my life.
I am grateful also for PhD coordinators Prof. Claudio Galletti and Prof. Lucio Ildebrando Cocco, for their constant encouragement, help, advice and assistance during the entire period of my study.
I would also like to convey thanks to the Institute of Advanced Studies (ISA) for providing the scholarship to stay in their residence for one year that gave me this great opportunity to research, learn, and live in Italy.
Last but not least, Prof. Giovanni Zamboni Gruppioni for his constant encouragement, help, advice and assistance during the entire period of my study.
INDEX
LIST OF ABBREVIATIONS 9
SUMMARY 11 EXTENDED SUMMARY 13 1. INTRODUCTION 17 1.1 OBESITY AND OVERWEIGHT 19 1.1.1 Definition 20 1.1.2 Overweight vs. Obesity 20
1.1.3 Obesity and life expectancy 21
1.1.4.Humoral factors involved in the interaction between obesity and cardiovascular (dys) function 23
1.2 THE WAKE-SLEEP CYCLE 26
1.2.1 Definition 26
1.2.2 Wake And WAKE Activating system 27
1.2.3 Sleep Generating System 29
1.2.4 Non-REM SLEEP 31
1.2.5 REM sleep 33
1.2.6. Sleep homeostasis 38
1.3 CARDIOVASCULAR PHYSIOLOGY AND SLEEP 40
1.3.1 Sleep state- control of cardiovascular function 41
1.3.2 Sympathetic VS Parasympathetic control 44
1.4 THE RECIPROCAL INTERACTION BETWEEN SLEEP DISTURBANCES AND OVERWEIGHT 45
1.5 STATE OF THE ART 48
1.5.1 The obesity epidemic is a threat to health care 48
1.5.2 Animal models allow mechanistic insight on the pathophysiology of obesity 49
1.5.3 Hypertension in diet induced obesity 49
1.5.4 Obesity entails alterations in wake-sleep structure at ultradian and circadian time scales 50
2. AIMS 53
3. MATERIAL AND METHODS 57
3.1 ANIMALS 59
3.1 SURGERY 60
3.1.1 Preparation of electrodes 60
3.1.2 Thermistors 60
3.1.3 Surgical intervention 61
3.2 APPARATUS FOR THE RECORDING 63
3.2.1 Recording box 63
3.2.2 Amplifiers and signal acquisition 63
3.3 EXPERIMENTAL DESIGN 64
3.3.1 Study of wake-sleep behaviour and autonomic function in animals fed with hypercaloric diet for 8 weeks 64
3.3.2 Data collection 65
3.3.3 Statistical analysis 66
4.RESULTS 69 4.1 BODY WEIGHT 71
4.2 ANALYSIS OF THE WAKE-SLEEP STATES UNDER BASELINE CONDITIONS 71
4.3 ANALYSIS OF THE AUTONOMIC PARAMETERS UNDER BASELINE CONDITIONS 72
4.4 ANALYSIS OF THE WAKE-SLEEP STATES DURING THE 12-H PERIOD OF TOTAL SLEEP DEPRIVATION AND IN THE FOLLOWING RECOVERY PERIOD 73
4.5 ANALYSIS OF THE AUTONOMIC PARAMETERS DURING THE 12-H PERIOD OF TOTAL SLEEP DEPRIVATION AND IN THE FOLLOWING RECOVERY PERIOD 76
5. DISCUSSION 79
6. FIGURES 91
LIST OF ABBREVIATIONS
BAT: Brown adipose tissue BL: Baseline
BMI: Body mass index BP: Blood pressure DIO: Diet-induced obesity EEG: Electroencephalogram EMG: Electromiogram diEMG: diaphragmatic EMG nuEMG: nuchal EMG EOG: Electrooculogram HC: Hypercaloric HR: Heart rate LD: Light-Dark NC: Normocaloric
NREMS: non-Rapid Eye Movement sleep MS: Metabolic syndrome
OP: Obesity prone OR: Obesity resistant OSA: Obstructive sleep apnea R0: Recovery, Day 0
R1: Recovery, Day 1
REMS: Rapid Eye Movement sleep SD: Sleep deprivation
SEM: Standard error of the mean
SINGLE REMS: REMS occurring in the form of Single episodes
SEQUENTIAL REMS: REMS occurring in the form of Sequential episodes SWA: Slow-wave activity
Ta: Ambient temperature Thy: Hypothalamic temperature WAT: White adipose tissue W-S: Wake-Sleep
SUMMARY
Obesity often predisposes to coronary heart disease, heart failure, and sudden death. Also, several studies suggest a reciprocal enhancing interaction between obesity and sleep curtailment. Aim of the present study was to go deeper in the understanding of sleep and cardiovascular regulation in an animal model of diet-induced obesity (DIO). According to this, Wake-Sleep (W-S) regulation, and W-S dependent regulation of cardiovascular and metabolic/thermoregulatory function was studied in DIO rats under normal laboratory conditions and during either wake or sleep enhancement, during sleep deprivation and in the following recovery period, respectively.
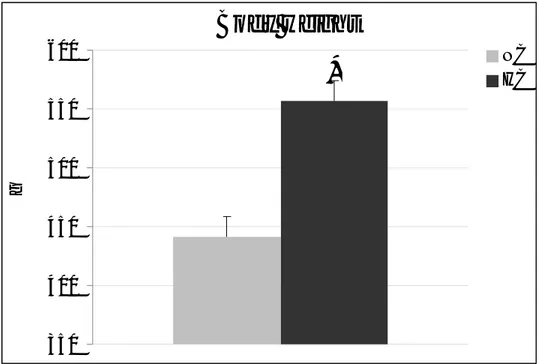
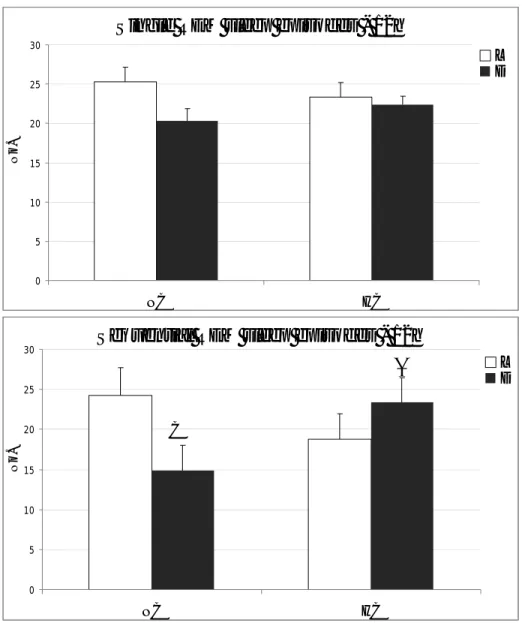
After 8 months of the delivery of a hypercaloric (HC) diet, treated animals were heavier than those fed a normocaloric (NC) diet (NC: 441 ±17g; HC: 557±17g). HC rats slept more than NC ones during the activity period (Dark) of the normal 12h:12h light-dark (LD) cycle (Wake: 67.3±1.2% and 57.2 ±1.6%; NREM sleep (NREMS): 26.8±1.0% and 34.0±1.4%; REM sleep (REMS): 5.7±0. 6% and 8.6±0.7%; for NC and HC, respectively; p<0.05 for all). HC rats were hypertensive throughout the W-S states, as shown by the mean arterial blood pressure values across the 24-h period (Wake: 90.0±5.3 and 97.3±1.3; NREM: 85.1±5.5 and 92.2±1.2; REM: 87.2±4.5 and 96.5±1.1, mmHg for NC and HC, respectively; p<0.05 for all). Also, HC rats appeared to be slightly bradycardic compared to NC ones (Wake: 359.8±9.3 and 352.4±7.7; NREM: 332.5±10.1 and 328.9±5.4; REM: 338.5±9.3 and 334.4±5.8; bpm for NC and HC, respectively; p<0.05 for Wake). In HC animals, sleep regulation was not apparently altered during the sleep rebound observed in the recovery period following sleep deprivation, although REMS rebound appeared to be quicker in NC animals.
In conclusion, these data indicate that obesity interferes with W-S and cardiovascular regulation and that DIO rats as a suitable model to be used for a better understanding of obesity comorbidities.
EXTENDED SUMMARY
Introduction. The prevalence of obesity has risen dramatically worldwide.
Obesity represents one of the most serious public health challenges since it tends to cluster with hypertension, insulin resistance, and dyslipidemia, which are documented risk factors for coronary heart disease and heart failure. In particular, in obese humans, arterial blood pressure (BP) is higher than in lean controls and decreases less than in lean controls on passing from the diurnal activity period to the nocturnal rest period. The consequences of these alterations on cardiovascular function still have to be fully clarified. In humans and animal models, the development of obesity is associated with alterations in the Wake-Sleep (WS) structure. In obese humans, excessive daytime sleepiness is associated with poor quality of sleep at night, partly because of the occurrence of sleep apneas which disrupts sleep. The tight link between sleep and obesity has also been stressed by recent data showing that sleep curtailment and sleep disturbances would lead to weight gain and to the development of insulin resistance and type-2 diabetes.
The circadian distribution and quality of W-S states are major determinants of the circadian arterial BP rhythm because they contribute to differences in BP between activity and rest periods. During non-Rapid Eye Movement sleep (NREMS), arterial BP decreases compared to Wake in humans and rodents, while during Rapid Eye Movement sleep (REMS), an apparent re-patterning of sympathetic activity to cardiovascular effectors causes changes in arterial BP, the direction and magnitude of which are highly sensitive to genetic and pathological factors in different species.
In general, obesity and other metabolic syndrome traits in humans ensue from interactions between polygenic susceptibility and an obesogenic environment. The understanding of the mechanisms of these interactions can be therefore hastened by studying animal models of diet-induced obesity (DIO), which present critical features of obesity in humans. In particular, about 50% of Sprague-Dawley rats fed a hyperlipidic/hypercaloric (HC) diet develops obesity in few weeks with derangements of glucose metabolism and reduced glucose
tolerance, hypercholesterolemia, hypertriglyceridemia, hyperleptinemia, and hypoghrelinemia. However, it is still unclear whether DIO rats develop hypertension. The relationship between obesity and sleep has been studied in several rodent models of obesity. These models develop obesity following the administration of a HC diet or through genetic manipulations aimed at interfering with the leptinergic system. All these studies showed the trend in obese animal to increase the amount of NREMS, while variable results have been seen on REMS and the daily distribution during L or D periods of the W-S states. However, no long-term studies on the effects of DIO on W-S and cardiovascular regulation have been carried out until now in the rat, which is currently the most widely used animal model in experimental biology.
The aim of this research was to study the structure of the W-S cycle and the possible state-dependent changes of brain temperature and cardiovascular function in rats made obese by the chronic administration of a HC diet. This experiment has also been conducted with the aim of identifying possible changes made by the prolonged administration of a HC diet to sleep regulation in response to a previous sleep deprivation. Particular care has been placed in the analysis of the possible modifications of the fine architecture of REMS, whose occurrence is strongly influenced by the degree of activation of thermoregulatory/metabolic processes and is under the control of central nervous structures at hypothalamic level that are known to be also involved in the regulation of body temperature/metabolism and food intake.
Methods. Male Sprague-Dawley rats were divided into two groups: a control
group was fed a normocaloric (NC) diet while the other group was fed a hypercaloric (HC) diet (35% fat). Both groups were kept at an ambient temperature (Ta) of 25°C ± 0.5 °C, under a 12:12 h light-dark (LD) cycle, and had free access to food and water. At the 8thweek form diet differentiation, 8 NC rats and 8 among the higher weight gained-rat from the HC group underwent surgery. Animals were deeply anaesthetized (diazepam, 5mg/kg, i.m., followed by ketamine-HCl, 100 mg/kg, i.p) and surgically implanted with: i) two epidural
electrodes for electroencephalographic (EEG) recording; ii) two electrodes for nuchal electromiographic (EMG) recording; iii) electrodes for the measurement of the diaphragmatic myoactivity. iv) a hypothalamic thermistor implanted above the left anterior hypothalamus for the determination of hypothalamic temperature (Thy); v) a catheter placed into the femoral artery for the telemetric recording of arterial BP and heart rate (HR).
Animals recovered from surgery for at least one week in a Plexiglas cage within a thermoregulated, sound-attenuated chamber where they were kept throughout the experiment. For both groups, recordings were carried out for four consecutive days: the first and second days were taken as the baseline (BL), during the third day rats were sleep deprived (SD) by gentile handling along the entire 12-h L period and then they were allowed to recover for the entire 12-h D period of the third day (R0) and for the whole following day (fourth day, R1). Sleep stages were scored offline according to standard criteria based on EEG, EMG and Thy signals. Particular care was placed in the detection and the separation of Single and Sequential REMS episodes, since this partition has been shown to be critical in describing the processes underlying REMS regulation. In particular, sequential REMS episodes are those separated by short time intervals (<= 3min) and occurring in rapid sequence, while single REMS episodes are those separated by long time intervals (> 3min). EEG power spectra analysis in the Delta (0.5-4.0 Hz), Theta (5.5-9.0) and Sigma (11.0-16.0 Hz) band for the different wake-sleep states was also carried out offline.
Results and conclusions. After 8 weeks of treatment the weight was higher in the
HC group than in the NC group (HC, 557±17g; NC, 441±17g; p<0.05). Under BL conditions, the 24-h total sleep amount and the amount of both NREMS and REMS was significantly larger in the HC group compared to the NC one, although for REMS the statistical significance was not reached. The analysis carried out on a 12-h time scale showed that HC animals slept significantly more than the NC animals during the D period, leading to the disappearance of the normal LD distribution of REMS. The analysis of the partition in Single and
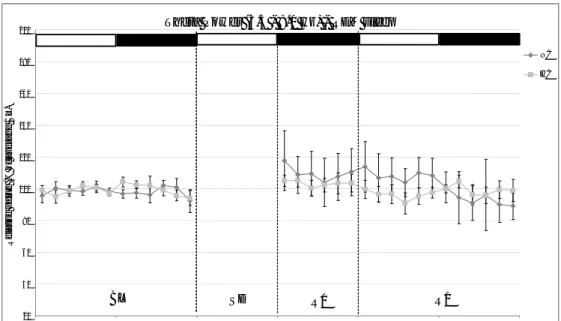
Sequential REMS showed that in both group the increase of REMS during the D hours was substantially due to a significant increase in Sequential REMS, confirming that REMS regulation is mostly made through the modulation of Sequential REMS. Major changes were also observed on a 24-h basis on cardiovascular parameters. In particular, HC animals showed to be significantly hypertensive and bradycardic when compared to NC ones. In particular, mean arterial BP was significantly higher in each of the three W-S states in HC than in NC animals. No relevant changes were observed in average Thy levels.
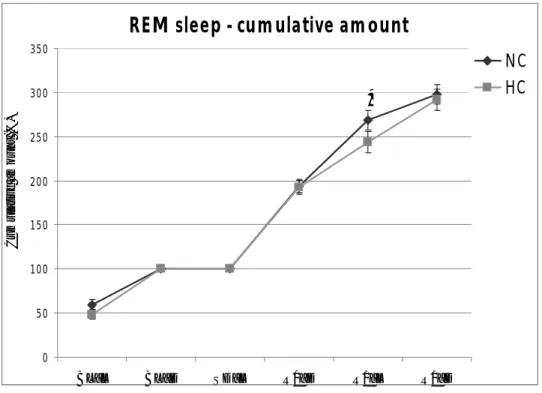
The analysis of W-S parameters during the recovery period which followed sleep deprivation showed that the majority of the expected sleep rebound occurred during R0 in NC animals. This pattern was reproduced in the HC group. The analysis of the partition in Single and Sequential REMS clearly indicated that REMS rebound occurred under the form of Sequential REMS in both NC and HC animals. No substantial differences were observed in the dynamics of the accumulation of NREMS in the two groups, while that if REMS was slightly faster in the NC animals. Also, the dynamics of Delta Power, which is an index of the intensity of NREMS rebound, followed a similar pattern in NC and HC animals. An increase in arterial BP levels was observed during SD in the NC animals in both Wake and NREMS. These values returned to baseline levels in R0 and even to levels lower than those of the baseline during R1 in each of the three W-S states Interestingly, this arterial blood pressure drop during R1 was not present in HC animals. On the contrary, heart rate fell in both groups during R1.
Thus, it may be concluded that the results of the present experiment indicate that in the rat the development of obesity deeply interfere with both W-S and cardiovascular regulation and that diet-induced obesity rats represent a very good model for further studies aimed at going deeper in the understanding of the disturbances in the W-S activity and of the cardiovascular comorbidities which accompany the development of obesity in humans.
OBESITY AND OVERWEIGHT
Obesity is now so common within the world’s population that it is starting to replace undernutrition and infectious diseases as the most significant contributor to ill health. Either independently or in association with other diseases it causes or exacerbates many health problems, (Kopelman, 1994). The generally accepted view is that being overweight causes, to a lesser degree, similar health problems to obesity.
Obesity and overweight are considered the most important risk factors beside high blood pressure, high concentrations of cholesterol in the blood, inadequate intake of fruit and vegetables, physical inactivity and tobacco use which cause what is known as noncommunicable diseases. The Build and Blood Pressure Study pointed out that the side effects of overweight tend to be delayed, sometimes longer than ten years (Society of Actuaries, 1980). Obesity is established well now as an independent risk factor for type 2 diabetes, dyslipidemia, and cardiovascular diseases (CVD) (Bastard et al., 2006). According to the World Health Organization (World Health Organization, WHO) in the data published in 2003 by the WHO as part of the "Global Strategy on Diet, Physical Activity and Health", the worldwide burden of noncommunicable diseases has rapidly increased. Noncommunicable diseases caused in 2001 almost 60% of the 56 million deaths annually and 47% of the global burden of disease. On the light of these figures and the predicted growth of the figures in the future of disease burden which are expected to reach to 73% and 60%, respectively, by 2020 a major challenge arises to the global public health in order to prevent this risk. Among the causative factors of the major noncommunicable Diseases, namely; cardiovascular disease, type 2 diabetes, coronary heart disease (CHD), an increased incidence of certain forms of cancer, respiratory complications (obstructive sleep apnoea, OSA) and osteoarthritis of large and small joints, unhealthy diets and physical inactivity are considered key determinants and principally contribute to the worldwide burden of disease, disability and death. It
was noticed that in developing countries, and even in low-income groups in richer countries, the prevalence of overweight and obesity is increasing.
1.1.1 DEFINITION
The concept of body mass index (BMI, Body Mass Index, BMI = weight (kg) / height (m) squared high) which is used as a measure of the weight gain, was firstly introduced by the Belgian scientist Adolphe Quetelet (Eknoyan, 2008) in 1832 until 1972. It is assumed that it took the present name from the suggestion of Ancel Keys. It allows meaningful comparisons of weight status within and between populations and the identification of individuals and groups at risk of morbidity and mortality.
1.1.2 OVERWEIGHT vs. OBESITY
On this basis, it is conventionally considered overweight individuals who have a BMI greater than 25 kg/m2 and obese those who have a BMI greater than 30 kg/m2 but this does not take into account the morbidity and mortality associated with more modest degrees of overweight, nor the detrimental effect of intra-abdominal fat. In the context of this work, obesity is considered synonymous with pathological weight gain. By this definition, Najjar et al. (1987) mentioned that over 50% of adults’ populations in the United States are overweight.
Obesity cases have tripled since 1980 in the WHO European basin which consist of 53 countries (WHO, 2007, 2009), (currently overweight varies in different countries of the WHO European region, between a minimum of around 30% and maximum around 80% of the adult population, it is estimated that of these individuals, at least 30% is obese) and are continuing alarming increase in youth. The trend of overweight in the WHO European region has shown an average increase of 0.1 percentage points during the '70s, by 0.4 percentage points in the '80s, by 0.8 percentage points in the early 90s and, in some countries, by 2
percentage points in the year 2000. The Task Force on International Obesity predicts that about 38% of school-age children in the European region of WHO will be overweight by 2010 and that more than a quarter of them will be obese. This alarmed recall from WHO is justified by the expectation that individuals with overweight in childhood redirected much more easily to the adult obesity (Barker, 2006; Venn et al., 2007).
The issue of overweight moved from the individual to the more purely social by the aid of the systematic approach to the problem. In fact, the use of sophisticated tools of analysis has led us to consider the association between overweight with other diseases not only as an expression of co-morbidity, but also as one of the major risk factors for the health of the population. Furthermore, the continuous refinement analysis allows now to follow not only the effects of changes in individual income, but also those of other health interventions. E.g. overweight is considered as an important risk factor not only in the developed regions, but also in the underdeveloped and, in particular, in those of the population that show a level of mortality which could be reduced mostly by the improvement of the state of general nutrition and treatment of infectious diseases (Ezzati et al., 2002).
In this context it should be emphasized the fact that the weight gain and, particularly, obesity, are characterized by a practically absolute co-morbidity with diabetes type 2 and more relative, but still significant, with the type of hypertensive cardiovascular disease and thrombus-embolic (same reference).
1.1.3 OBESITY AND LIFE EXPECTANCY
The International Bank for Reconstruction and Development (The World Bank) in 1990 has further developed the index of life expectancy by introducing the index DALY (disability-adjusted life years), also generically assignable to each individual (The World Bank, 1993). It is a measure of overall disease burden, expressed as the number of years lost due to ill-health, disability or early death. On other words, the DALY is the sum of years of life lost to premature
death or disability occurred due to illness or accident, the calculation of the index requires you to weigh the degree of disability and to define the average duration of the disease.
The weight gain, pathological or less, represents a well defined risk factor as it is possible easily and accurately evaluates its distribution in a particular population. Overweight and obesity are the fifth risk factor for death worldwide (the third in the middle and high-income countries) and the tenth in generating DALY (the fourth in middle-income countries and the third in high-income countries). However, when you take into account the food intake as the fundamental cause of overweight and obesity are associated with this and other risk factors correlated to dietary imbalances (hypertension, hyperglycemia, reduced physical activity, hypercholesterolemia, low intake of fruits and vegetables), you reach a set which is the highest cause of death and generation of DALYs. Fontaine et al.(2003) reported that even fifty years ago, overweight and especially obese men and women taking out insurance policies were known die earlier than the lean one. Other studies had mentioned that obesity shortens life expectancy by 7 years at the age of 40 years (Peeters et al., 2003). The positive relation between the increase in BMI and the increase in risk of death declines progressively with age but remains substantial until the age-group of 75 years (Stevens et al., 1998). Thus, the UK government now estimates that English man with BMI of 25·0 kg/m2 has less life expectancy by 2 years and the expected value would reach 5 years by 2050 (Haslam and James , 2005). In USA, each year, an estimated 300,000 US adults die of causes related to obesity (Allison et
al., 1999). The rapid growth in the number of overweight and obese individuals
found in the world has been defined by WHO as epidemic (obesity Epidemics), a term introduced in 1999 in an analysis regarding the dissemination of overweight in the United States from 1991 to 1998 (Mokdad et al., 1999).
In this context, this consideration of the obesity and overweight as disease cases create an opinion that the treatment of the obesity and overweight could be covered by the health insurance.
The movement in this direction was implemented in a country with high economic development such as the USA and was indirectly imprinted by the simultaneous discovery, by two different research groups, the existence of a peptides neurotransmitter (De Lecea et al., 1998) exclusively localized in neurons of the lateral hypothalamus (Peyron et al., 1998) and acting on the control of food intake (Sakurai et al., 1998). These neuropeptides, hypocretin (HCRT) 1 and 2, also called orexin 1 and 2 appointed that the main effect was obtained following its administration, which was to increase food intake. Few years after their discovery, it was shown that HCRT neurons degenerate in patients suffering from Narcolepsy (Peyron et al., 2000) Narcolepsy with cataplexy (NC) is an hypersomnia of central origin characterized by loss of clear boundaries between sleep and wakefulness leading to severe sleepiness. NC patients can quickly enter in REM sleep at any time of the day and also experience REM sleep like episodes intruding into wakefulness, such as loss of muscle tone triggered by emotions while awake (cataplexy). This suggest the existence of a strong link in the neural processes underlying wake-sleep regulation and the regulation of food-intake (Sakurai et al., 2011).
1.1.4. HUMORAL FACTORS INVOLVED IN THE INTERACTION BETWEEN OBESITY AND CARDIOVASCULAR (DYS) FUNCTION
There is now clear evidence that for a given adiposity, a large heterogeneity in the metabolic and cardiovascular risk mainly linked to the distribution and position of excessive adipose tissue. While central or visceral accumulation of fat is an important predictive factor of lipid, glucose or atherogenic disturbances, the peripheral one is not associated with increased alterations at the metabolic level.
A special attention should be paid to the relationship between fat cells and the immune system due to the strikingly and strong discovery which pointed out the association between obesity with a low-grade inflammation process in adipose tissue. In animal models (rodents), obesity is associated with a chronic
inflammatory reaction, which characterized by activation of some pro-inflammatory signaling pathways and abnormal adipokine production which in turn result in occurrence of a cascade of several biological markers of inflammation (Bastard et al., 2002). Nowadays, any protein that can be synthesized and secreted by adipocytes can be given the name adipokine (Trayhurn and Wood, 2004). In contrary, these biological parameters are diminished or at least normalized by the loss of BMI. Several animal models supported the idea of a causal relationship between these inflammatory processes with obesity and its co-morbidities such as insulin resistance, type-2 diabetes and CVD.
Leptin, is the product of the ob gene. It is involvement in regulation of energy homeostasis is documented by several authors e.g. (Zhang et al., 1994). It is almost exclusively expressed and produced by white adipose tissue (WAT), in particular, mature adipocytes. In obesity, the circulating levels and adipose tissue mRNA expression of leptin show significant correlation with BMI and fat mass. There is a relationship between leptin and the low-grade inflammatory state in obesity despite the fact that the main action centre of leptin is at the central nervous system (CNS) in regulate food intake and energy expenditure which created a suggestion that leptin could have peripheral biological effects due to its cytokine-like structure. Leptin is caopable to regulate tumor necrosis factor-α (TNF-α) production and activation by macrophages (Loffreda et al., 1998)
TNF-α is a pro-inflammatory cytokine produced mainly by lymphocytes and macrophages however, a variety of cell-types could produce it also. Adipose tissue can produce TNF-α although in human, this production is weak. It is thought that TNF-α plays a major role in the pathophysiology of insulin resistance in rodents via the phosphorylation of the insulin receptor substrate-1 (IRS-1) protein on serine residues (Hotamisligil et al., 1993). Moreover, plasma TNFa concentrations are significantly elevated in obese animals, and its level is positively correlated with insulin resistance and massive obesity.
Interleukin-6 is multifunctional cytokine acting on many cells and tissues. IL-6 is produced by many cell types (fibroblasts, endothelial cells, monocytes) in
addition to other tissues including fat tissue. It is now well established the increment of IL-6 production by adipose tissue in obesity (Bastard et al., 2002). Ali et al. (1997) mentioned that in the absence of an acute inflammation, a percentage of 15 to 30 % of circulating IL-6 levels derives from adipose tissue. Furthermore, at the level of the central nervous system, it may induce energy expenditure (including thermogenesis) and inhibit feeding behaviour (Wallenius
et al., 2002). One of the main effects of IL-6 is the induction of hepatic C-reactive
protein (CRP) production and the strong relation between IL-6 levels in adipose tissue with the circulating IL-6 and CRP is well established now (Ridker , 2003). In addition, IL-6 has been recently proposed to play a central role in the link between obesity, inflammation and coronary heart diseases (Yudkin et al., 2000).
However the mechanism is a matter of debate, it has now been clearly demonstrated that cytokines such as TNF-α and IL-6 are capable to inhibit insulin action (Rieusset et al., 2004). Therefore, the chronic increase in circulating cytokine levels could contribute to insulin resistance in addition to the aggravation of the cardiovascular risk linked to inflammation.
Also, IL-6 and TNFa were highest in the sleep apnea group, which had the highest BMI among the patient groups studied. Interestingly, even in the absence of sleep apnea, obesity is more frequently associated with subjective complaints of fatigue, EDS and nocturnal sleep disturbance. The results obtained by Vgontzas
et al. (1997) presented that inflammatory cytokines especially, IL-6, might be
related with the enhancement of fatigue and sleepiness exhibited by obese subjects.
In recent studies in animals and human models, the positive regulation of IL-6 production was found to be via catecholamines through beta adrenergic receptors (DeRijk et al., 1994; Papanicolaou et al., 1996). Stimulation of peripheral sympathetic activity in sleep apnea and obesity is known (Landsberg, 1999). Furthermore, circulating IL-6 stimulates the hypothalamic–pituitary– adrenal (HPA) axis, and this stimulation is associated with this activation of which is associated with hypertension, central obesity and insulin resistance. F
An important role of insulin in the relationship between dietary intake and sympathetic nervous system (SNS) activity was reported previously. Insulin mediates glucose uptake in central hypothalamic neurones responsible about the SNS activity in response to dietary intake, this links the hyperinsulinemia of obesity to sympathetic stimulation, the latter exerting a prohypertensive effect mediated by the kidney, the heart, and the vasculature.
The glucose uptake from neurons of ventromedial hypothalamus is decreased during fasting due to small fall in glucose and the larger fall in insulin. This decrease in glucose metabolism suppresses the sympathetic output by an inhibitory pathway between the hypothalamus and brainstem sympathetic centers. In contrast, the small increase in glucose and the greater rise in insulin, either in the presence of insulin resistance or increased carbohydrate intake, facilitates insulin-mediated glucose metabolism in these hypothalamic neurons, which leads to suppression of the inhibitory pathway and disinhibition of chronically active brainstem sympathetic centers and the result is increment in sympathetic outflow (Landsberg, 1999).
1.2 THE WAKE-SLEEP CYCLE
1.2.1 DEFINITION
Sleep is usually defined by sustained quiescence in a species-specific posture whereas the responsiveness to external stimuli is reduced, but the definition regarding mammals sleep requires several additional criteria, such as characteristic changes in electroencephalogram (EEG) and reversibility to wakeful state which distinguish sleep from coma and hypothermic states e.g. hibernation (Zepelin et al., 2005).
In the Wake-Sleep cycle (W-S cycle), these two states namely; wake and sleep are considered a consecutive behevioral states that are defined precisely by the recording of electrical potentials produced by the cerebral cortex EEG, the extrinsic muscles of the eye (electrooculogram, EOG) and skeletal muscle
(electromyogram , EMG). The WS cycle is constituted of the wake state in addition to two basic sleep states namely; rapid eye movement sleep (REMS) and non-REM sleep (NREMS).
1.2.2 WAKE AND WAKE ACTIVATING SYSTEM
In the early 1900, many physiologists believed that wakefulness and consciousness were maintained by ongoing sensory inputs to the brain. In 1940 Moruzzi and Magoun suggested that the disappearance of waking parameters is due to the interruption of input of the brainstem’s netlike core of neurons, the reticular formation. They showed also that electrical stimulation of the reticular formation, but not the sensory pathways, initiated a long lasting and widespread activation of the cortex accompanied by substitution of the cortical slow waves with fast activity (Moruzzi and Magoun, 1949). Moreover, the lesions induced in the reticular formation, but not the sensory pathways, produced a loss of cortical activation which replaced by cortical slow waves and an immobility state resembled coma. The locations of the most marked lesions were in the oral pontine, midbrain reticular formation, posterior hypothalamus and subthalamus where ascending pathways reach into the forebrain. According to the electrophysiological and neuroanatomical studies, collateral input from, somatic, visceral and special sensory systems is received by the reticular formation to be projected in turn dorsally to the thalamus or ventrally to the basal forebrain. The impulses are then re-projected from thalamus and forebrain to be relayed in widespread manner to the cerebral cortex. This system called the ascending reticular activating system and is considered necessary and sufficient for the behavioral arousal of wakefulness and tonic maintenance of the cortical activation.
The origin of the ascending arousal system is largely from a series of well-defined cell groups with known neurotransmitters (Saper et al., 2001). This pathway has two major branches: the first ascending pathway branch to the thalamus activating the crucial part for the transmission of information to the
cortex, namely thalamic relay. The pedunculo-pontine and laterodorsal tegmental nuclei (PPT/LDT) (Hallanger et al., 1987), a pair of acetylcholine-producing cell groups is considered as the major upper brainstem source of input to the thalamic relay as well as the thalamic reticular nucleus. During the cortical activation i.e. during Wake and REMS states, PPT/LDT neurones fires most rapidly. In contrast, during NREMS, these neurones are much less active. As the reticular nucleus is positioned between the thalamic-relay nuclei and the cerebral cortex, their input is believed as gating mechanism capable to block transmission between thalamus and cortex which is important for wakefulness McCormick, 1989). The second branch of the ascending arousal system activates neurons in the lateral hypothalamic area and basal forebrain and throughout the cerebral cortex (Jones, 2003). The origin of this pathway is the different monoaminergic nuclei in the upper brainstem and caudal hypothalamus: including serotoninergic dorsal (DR) and median raphe nuclei, the noradrenergic locus coeruleus (LC), dopaminergic ventral periaqueductal grey matter and histaminergic tuberomammillary neurons. The lateral hypothalamic peptidergic neurons (containing melanin-concentrating hormone (MCH) or orexin/hypocretin), and BF neurons (containing acetylcholine or GABA) serve to augment the input to the cerebral cortex (Saper et al., 2005). Posterior hypothalamus has been thought as a waking center due to its role in regulating of the sympathetic division of the autonomic nervous system. Collectively, the essential activating system had to be widened to include, in addition to the reticular formation, the posterior hypothalamus, hypothalamus-subthalamus as well as the basal forebrain. These ventral extrathalamic relay which receive ascending input from the reticular formation to be projected in turn to the cerebral cortex , had shown to be able to keep activation of the cortical activation of the forebrain even in the absence of the signal’s input from the brainstem reticular formation and function thus independently as activating system.
1.2.3 SLEEP GENERATING SYSTEM
Between 1940s and 1950s, many physiologists believed in an idea that sleep was a result of a decrease and fatigue in the activity of the reticular activating system. Nonetheless, sleep dimensioned by transections through different areas in the brain. Particularly, total insomnia resulted by transections of the brainstem behind the oral pontine tagmentum. This fact indicated that lower brainstem has important sleep generating system with capacity to antagonize the ascending reticular activating system in the upper brainstem. The clinicians also notice that in clinical cases, the disappearance or diminishment of the slow wave sleep accompanied lesions in the lower pons or medulla. This state was referred to as (alpha coma), which characterized by the predominance of alpha activity on EEG typically to wakefulness, while the subject showed lacking of the behavioral alertness and responsiveness.
The finding that low frequency electrical activation of the medullary reticular formation, especially the dorsal medullary reticular formation and the solitary tract nucleus , in production of cortical slow wave activity in awake animals as well as the lesions of these structures which produce fast activity of the EEG in sleeping animals indicated the presence of neurons that could generate sleep. Solitary tract nucleus receive afferent fiber projections from 9th and 10th cranial nerves, glossopharyngeal and vagus respectively, which transmit input from baroreceptors and chemoreceptors of the abdominal and thoracic viscera. Many of the ascending projections from solitary tract nucleus and dorsal medullary reticular formation reach and terminate in the parabrachial nuclei. These nuclei in turn project rostrally to the thalamus, preoptic areas, hypothalamus, amygdala and orbitofrontal cortex, areas commonly belonging to visceral limbic forebrain. The solitary tract nucleus project lightly forward to all these areas excluding the cortex. This data pointed out that the role of solitary tract nucleus may not only by the inhibition of the reticular activating system but also by an action on the structures of the forebrain which had implicated in the generation of sleep. Studies of Bremer with cerveau isole had shown that
forebrain could locate a crucial synchrogenic structures because cortical slow wave activity still appears in absence of the brainstem influence. Applying low frequency electrical stimulations in acute experiments studies of midline thalamus induced a slow cortical activity. Moreover, in chronic studies of thalamic stimulation, this initiated a natural sleep defined by both behavioral and EEG criteria. Such evidences led to consider thalamus as (head ganglion of sleep) (Jones, 2005). This conclusion was also supported from clinical case of (fatal familial insomnia), in which a selective degeneration of thalamic nuclei is associated with it. However, lesion studies showed that although thalamus may be necessary for the production of cortical spindles, it is not necessary for the creation of behavioral and cortical slow waves sleep as clarified by its complete removal (Villablanca et al., 1972). Since 1900s, anterior hypothalamus proposed as a center of sleep due to several cases of (encephalitis lethargica) in which the lesions were concentrated in this area and the patients were suffering of insomnia. This made Von Economo to posit that this area is in opposition to and normally in balance with waking center in posterior hypothalamus. Lesions studies in animals had confirmed the existence of sleep facilitatory regions in preoptic area and anterior hypothalamus. The ventrolateral preoptic area VLPO is a small neuronal core (radius 300 μm) located in the ventral POA, it was found to send outputs to all major brainstem and hypothalamic cell groups participating in the arousal (Sherin et al., 1996). The VLPO neurones contain the inhibitory neurotransmitters, galanin and GABA and they are primarily active during sleep (Gaus et al., 2002). These VLPO neurons form dense cluster and a more diffuse extended part of the nucleus. The main output to the LC and DR are provided by VLPO extended neurones, which are thought to be important in gating REM sleep (Lu et al., 2002). On contrary, the VLPO cluster more heavily innervates the histaminergic neurons, which are important to transitions between arousal and NREMS (John et al., 2004). On the other hand, each of the major monoaminergic systems sends afferent inhibitory input to the VLPO. However, VLPO does not have histaminergic receptors, but tuberomammillary neurons contain GABA also, which inhibit VLPO (Saper et al., 2005).
POA has beside VLPO, median preoptic nucleus (MnPN) which has sleep active neurones with a majority of MnPN neurons activated during sleep contain GABA as proved by the finding that a majority of its neurones expressing c-Fos-immunoreactivity (IR) during sleep are GABAergic. Similar to VLPO, anatomical tracer studies reveal projections from MnPN to multiple arousal-regulatory systems in the posterior and lateral hypothalamus and the rostral brainstem to promote sleep onset and sleep maintenance by inhibitory modulation of these systems (Szymusiak et al., 2007). Furthermore, the electrical stimulation of the basal forebrain and preoptic areas resulted in appearance of drowsiness followed by behavioral and EEG patterns of natural sleep.
Thus, the three areas i.e. preoptic area , hypothalamus, basal forebrain, together with lower brainstem were shown to be clearly important for the sleep generation. Subsequent evidences had shown that although the importance of these structure, but they were not sufficient for slow wave sleep and thus cerebral cortex and basal ganglia could contribute to onset of sleep also.
1.2.4 Non-REM SLEEP
Generally, in mammals the onset of sleep is associated with slowing of EEG activity, a rising of the EEG amplitude and decrease of muscle activity which followed in most species with appearance of the spindles (7 to 14 Hz). A shorthand definition of NREMS is “a relatively in active yet actively regulating brain in a movable body” (Carskadon and Dement, 2009). The alternation between NREM and REMS occurs in human in cyclic fashion. Usually, REMS became longer across the night. Stages 3 and 4 occupy less time as the sleep cycles progress i.e. occupy less time in the second cycle and may disappear in the later cycles and stage 2 expands to occupy the whole NREMS. Approximately, the mean duration of the first NREMS-REMS cycle lies between 70 to 100 minutes, whereas the second and later cycles is approximately 90 to 120 minutes. So, the average NREMS-REMS cycle across the night in normal subjects is 90 to 110 minutes. Slow waves and spindling are the prominent hallmarks of the
mammalian NREMS or quiet sleep. Slow wave activity (SWA; 0.5 to 4 Hz) differs in its peak frequency between different species as it is concentrated at lower frequency in some species as human and rat. NREMS could be further subdivided into light and deep sleep depending on the amount of delta wave activity.
The classical stages of NREMS in humans are four however the new classification has made them three stages by merging the third and fourth stages in one stage. These four stages defined along one measurement, EEG. By passing from the first till the fourth stage, sleep being deeper and awakening is more difficult. Thus, one can consider that these four stages roughly parallel a depth of sleep continuum, with lowest thresholds of awake in stage one and highest in the fourth. Onset of sleep is accompanied with reduce of body temperature (Tb) and the Tb is actively regulated at lower level in sleep than during wakefulness. This idea came after the observations that in napping children, the decline in rectal temperatures coincided with elevated skin temperature as well as increasing of the evaporative water loss. It is commonly observed that in animal studies, the brain temperature (Tbr) falls during NREMS in comparison to the wake state, but in REMS it is higher than NREMS (Parmeggiani, 1980). The change in Tbr can be influenced by the change in blood temperature which perfusing it, change in the metabolism of the cerebrum or changes of the cerebral blood flow. Shivering in NREMS in cool environment occurs in stage 1 and 2 but not during the rest NREMS stage or the whole REMS indicating the marked inhibition of thermoregulatory response during REMS and intact thermoregulatory mechanisms in NREMS. The cause of this is the state dependent changes of the functions of preoptic hypothalamic thermostat neurons.
NREMS is characterized by a down-regulation of cardiovascular activity of variable intensity depending on the species and the previous level in quiet wake state. Blood pressure declines in cat but not in rabbit whereas this decrement is not consistent in rat (Lacombe et al., 1988). In human, this decrease in arterial pressure was noticed but to a varying intensity between different individuals with increase in the sensitivity of the baroreceptors. On the other hand, heart rate
shows significant decrease in rat but this was not statistically significant in rabbit. On the whole, cardiovascular changes in NREMS are consistent with the respiratory and thermoregulatory changes in a condition of postural and motor quiescence.
1.2.5 REM SLEEP
REMS was discovered by Aserinsky and Kleitman in 1953. This state of sleep was first identified by most obvious behavior: rapid eye movement during sleep. Most adult mammals’ neocortex shows low voltage EEG during this phase while the hippocampus has regular high-voltage theta (4 to 8 Hz) waves throughout REMS. They noticed that EEG pattern during REMS closely resembled that of alert waking and they found that the subjects awakened from this state reported vivid dreams. Jouvet reported this observation and found in addition a loss of muscle tone (atonia) in REMS and called REMS as paradoxical sleep (Siegel, 2009). In addition to the above mentioned patterns of REMS, other classic criteria were also noticed during this type of sleep; erection tends to occur in men and clitoral engorgement in women. The pupil constriction (miosis), reflecting a parasympathetic dominance in the iris control. All these changes which are distinguished throughout REMS have been termed its tonic features. The brainstem is believed to be the key brain structure for generation of REMS, in particular the pons and the neighboring portions of the midbrain. These areas in addition to hypothalamus contain neuronal cells that are maximally active during REMS and hence it called REMS-on cells and cells that are minimally active during REMS which called REMS-off cells. Subgroups of REMS-on cells use the transmitters; gamma-aminobutyric acid (GABA), acetylcholin, glutamate, or glycine. On the other hand, subgroups of REM-off cells use the transmitters; adrenaline, noradrenaline, seretonine, and histamine. The interaction between these two types of cells controls the key phenomena of REMS. The entire destruction of the areas of pons and midbrain can prevent the occurrence of REMS while the partial damage to portions of brainstem can lead to abnormalities
of certain aspects of REMS especially the loss of muscle tone. Lesions in medulla and pons cause REMS to occur in the animal without atonia. During this abnormality, the animal exhibits during REMS locomotor activities and appear to attack imaginary objects. This syndrome shares with some commonalities in REMS behavior disorders seen in human. In contrary, the activation of REMS controlling areas creates muscle loss in antigravity and respiratory muscles.
Collectively, the dorsal part of pontis oralis (PnO) and caudalis (PnC) nuclei contain the neurons responsible for REMS onset i.e. REMS-on neurones (Webster and Jones 1988). Another achievement in the regulatory mechanisms of REMS was the finding that raphe nuclei serotonergic neurons and noradrenergic neurons from LC cease firing specifically during REMS, i.e, show a REMS-off firing activity, reciprocal to that of REMS-on neurons (Aghajanian and Vandermaelen, 1982). Recently, it was found that tuberomamillary nucleus-histaminergic neurons and hypocretinergic neurons from the lateral hypothalamus depict a REMS-off firing activity (Mileykovskiy et al., 2005; Takahashi et al., 2006). Gating REMS occurrence by mutual interactions between REMS-on and REM-off neurons namely, reciprocal inhibitory interactions between cholinergic REMS-on and monoaminergic REMS-off neurons for REMS onset and maintenance is the well-accepted hypothesis.
A very small area of the dorsolateral pontine tegmentum which is called sublaterodorsal nucleus (SLD) has the ability to induce a long-lasting REMS-like hypersomnia after injection of two GABAA receptor antagonists: bicuculline or gabazine, (Boissard et al., 2002). Furthermorem, glycinergic neurons from the ventral and alpha gigantocellular (GiV) and raphe magnus nuclei were found to receive direct projection from SLD to generate atonia during REMS by direct projections to cranial and spinal motoneurons. GABAergic neurons within the ventrolateral part of the periaqueductal gray (vlPAG) and the dorsal deep mesencephalic reticular nuclei (dDpMe) gate REMS by inhibiting tonically REMS-on neurons from the SLD during SWS and waking (Fort et al., 2009). Melanin-concentrating hormone (MCH) has a role in REMS due to the finding that MCH neurons activation is selective for REMS (Hanriot et al., 2007). Luppi
et al. (2006) proposed that REMS increases induced by MCH might be as the
result of the inhibitory direct effect of the GABAergic dDpMe and vlPAG neurons gating REMS onset while inputs to these areas from the HCRT neurons would be excitatory to prevent REMS. A relevant role for neurons localized in the lateral hyopthalamus in the regulation of REMS occurrence came from a recent paper (Clement et al., 2012) in which it has been shown that the inhibition of the lateral hypothalamus by the local microinjection of muscimol suppressed REMS occurrence in the rat. The results have been interpreted as being the effect of the tonic suppression of the activity of the MCH neurons which are intermingled and in close functional relationship with the HCRT ones. Moreover, a role in the promotion of REMS occurrence has been attributed to the peptide Nesfatin-1 which is co-expressed in MCH neurons in the tuberal and lateral zone of the hypothalamus and has been shown to be also involved as a satiety factor in appetite regulation (Jego et al., 2012)
From the point of view of physiological regulation, the two sleep states are very different (Parmeggiani, 2005), since while NREMS is characterized by a substantial stability of the autonomic parameters which are typically regulated in accordance with Walter Cannon’s homeostatic paradigm, REMS is characterized by a large autonomic instability, with sudden surges in arterial blood pressure and heart rate and profound irregularities in breathing. In particular, during REMS thermoregulation is depressed or suppressed in different species and the animal body temperature shift toward the environmental temperature as reptiles (Parmeggiani, 2003). This led to define REMS as a poikilostatic state, in contrast to NREMS (Parmeggiani, 2005).
The interest in deepening the relationship between sleep and thermoregulation comes from the fact that these two functions influence each other. The thermoregulatory regulation changes during sleep, also the structure of sleep changes during the thermoregulatory activity. This close interaction was probably driven by the fact that these two functions share some of the regulatory structures at the central level, in particular, the basal preoptic regions and ventral nuclei of the hypothalamus. As already said, the main thermoregulatory difference
which is observed during the wake-sleep cycle is the thermal homeostasis suspension during REMS, which has been observed in many species, including humans, and has been postulated that this impairment generally depends on insufficiency in the hypothalamic integration of autonomic function (Heller, 2005; Parmeggiani, 2005). During REMS, animals exposed to high or low ambient temperatures were missing the normal thermoregulatory responses such as shivering, the thermal polypnea and vasomotor responses. Experimental animal had shown highest total sleep time at thermonutral ambient temperature and decreases both in the cold to hot and that REMS is the one most affected by the variation of the ambient temperature. Amici et al., (1994); Cerri et al. (2005) confirmed this in the rat, where they observed that the amount of REMS is reduced almost to zero in extreme environmental conditions. However, Luppi and colleagues (2010) reported that osmoregulation, is not impaired during REMS, so, we can now suppose that the link between REMS and suspended homeostasis is prevalently (or exclusively) linked to suspended thermoregulation and therefore REMS function could be precisely related to the regulation of body temperature and metabolism.
Furthermore, blood pressure in human, rat and rabbit show an increase from NREMS to REMS but this rise was not always accompanied with primary cardiovascular changes namely; heart rate and vascular conductance. In rabbit, decrement during REMS was noticed in renal and vascular conductance. The weak correlation between regional and systemic variables proves that the central integration of cardiovascular functions is altered during REMS. The variability in heart rate and blood pressure is a prominent and an important feature of REMS in rabbit, rat, cat and human being and it is loosely associated with bursts of rabid eye movements, myoclonic twitches and more often probably with breathing irregularities. The main causes of such instability of cardiovascular regulation in REMS are due to the interaction between the central variabilities of visceral control and the central effects of activated reflexes. In rat, during REMS, the arterial blood pressure (BP) increases (hypertension) while in sinoaortic denervated counterparts, hypotension occurs as in cat.
There is a mode of description of the succession of episodes of different REMS which is based on the possibility to describe the succession of episodes of REMS regardless of the phase of the sleep cycle interposed between two successive episodes of REMS, but simply taking into account the duration of the time interval which separates the two mutually adjacent episodes. The study of the frequency distribution of the duration of the intervals between two consecutive REMS episodes, namely the intervals of time after the end of an episode of REMS and the beginning of the next, showed a bimodal characteristic appearance that varies in a species-specific. In rats, 3 minutes has been shown to be the time interval that identifies the limit of separation between short and long episodes of REMS (Amici et al., 1994). As mentioned above, one can distinguish individual episodes of REMS, which are separated by intervals of duration greater than 3 minutes (single REMS episodes), and sequential episodes, which are separated by intervals of less than 3 minutes (sequential REMS episodes). More episodes of REMS sequential occur in groups known as REMS clusters, in which the first and the last episode are separated from the previous and next respectively by long REMS intervals. Amici and colleagues (1994) had reported that during the normal circadian rhythm of light-dark in rat, about half of the REMS is executed in the form of sequential episodes. Moreover, it has been shown that REMS occurrence is mainly regulated through changes in sequential REMS episodes either under thermal challenges (Amici et al., 1994, 1998; Cerri et al., 2005) or in response to changes in environmental light ( Zamboni et al., 2001), while the amount of single REMS episodes is kept almost constant, if possible. The partition between single and sequential REMS episodes is therefore considered to be a good index describing the interaction between REMS pressure (increasing sequential REMS episode) and the activity of the autonomic nervous system dedicated to the conservation of bodily homeostasis (depressing sequential REMS episodes) (Amici et al.,1994; Zamboni et al., 2004).
In this thesis, the amounts of REMS under the form of sequential REMS episodes or single REMS episodes will be addressed as Sequential REMS or Single REMS, respectively.
1.2.6. SLEEP HOMEOSTASIS
Both the amount of sleep and the dynamics of its recovery after deprivation suggest a kind of homeostatic regulation for sleep occurrence. In the 80s, Borbély was the first to address the issue of sleep regulation in term of intensity and the duration (Borbély, 1980). According to his model, the propensity to sleep state is the result of the interaction of two processes, called process C and process S. The process C, or circadian, describes the control of the timing of episodes of sleep and sleep propensity during the day, and derives from the supra-chiasmatic nucleus of the hypothalamus (SCN). The process S, or homeostatic, describes how the sleep propensity increases proportionally to the accumulation of the time spent in wakefulness and decreases, instead, after periods of sleep, especially during NREMS.
Therefore, it can be said that sleep is a behavioral state during which, in the NREMS phase, physiological variables are homeostatically regulated, but it is also true that the same state of sleep is subjected to a homeostatic regulation. An indicator of the intensity of NREMS, and, therefore, used to describe the homeostatic process below, consists of the electroencephalography slow-wave activity (SWA), with a meaning equivalent to that of Delta waves. The reason why SWA serves as an index of the intensity of NREMS is due to the fact that it is particularly intense at the beginning of a phase of sleep, precisely parallel to the period in which the threshold of awakening organism is the most high and, therefore, the sleep becomes deeper. After this first phase, the need for sleep is reduced and, simultaneously, SWA becomes much less intense also. Furthermore, in many studies it has been observed that periods of deprivation are followed by intense SWA in the recovery phase of sleep (Borbély and Achermann, 2005). The SWA is not, therefore, only an epiphenomenon of NREMS, but it reflects important regulatory mechanisms, the meaning of which is still matter of debate. To date, the most accepted theory to explain the homeostasis of NREMS SWA is synaptic homeostasis (Tononi and Cirelli, 2003). This theory relates the
synaptic potentiation during wakefulness, with the SWA during sleep. Specifically, the different activities during wakefulness (such as, reactions to sensory stimuli, motor activity, mental associations, thoughts, acquire new experiences) lead to an increase in the number and strength of synaptic connections between neurons (synaptic potentiation); this phenomenon is directly correlated with the increase of the SWA during the next sleep phase, the function of which would be an elimination of synaptic connections considered superfluous. From this point of view the progressive decline of the SWA during rest reflect the corresponding re-modulation of synaptic weights in order to optimize the functionality of neuronal connections. The function of the slow-wave activity during NREMS, according to this theory, would therefore be to avoid overload of synaptic connections on nerve cells, thinning the density of connections and at the same time improving their efficiency.
In contrast to NREMS, REMS does not present dynamics of recovery based on the intensity, but rather on the duration of the phenomenon (Parmeggiani
et al., 1980b; Cerri et al., 2005). In fact, it is not yet clear whether the REMS
recovery is also based on an increase in the intensity of theta waves, typical of this stage of sleep (Cerri et al., 2005). A procedure that has allowed a detailed study of the dynamics of recovery of REMS consisted of exposure to low temperatures which is a powerful inhibitory stimulus against the appearance of REMS. After exposure to cold, in the rat the recovery process of REMS appears to depend only on the amount of REMS lost during the previous deprivation, following a dynamic seems that regardless of the temperature of exposure (Amici et al. 2008). After 24-h deprivations of REMS of different intensities, this process leads to a 100% recovery of the REMS loss in few days (Amici et al. 2008). From studies of deprivation and recovery, it is clear that REMS behavior is a finely regulated on the homeostatic base and how the chronic deprivation of this phase of sleep represents a severe stress for the organism so as to lead to an organic deterioration such as to induction of death (Rechtschaffen et al, 2002). As mentioned earlier, the chronic deprivation of REMS is accompanied by a dysmetabolic syndrome characterized by the reduction of the production of leptin followed by appearance
of hyperphagia, contrary to what the body weight is reduced gradually, while the metabolic activity of fat brown increases (Koban and Swinson, 2005). This suggests that REMS is involved in the maintenance of the metabolic activity of the organism and that behavior is essential for the biological economy of the individual and his own life. In support of the hypothesis of a link between REMS and metabolic function, it has been shown that the intensity of the REMS rebound following REMS deprivation, and therefore the REMS need, apparently decreases in proportion with the increase in the body mass (and therefore with the decrease of the basal metabolic rate per Kg) of the different species, being more urgent in rats than in cats, and reaching a lower level in humans (Amici et al. 2008).
1.3 CARDIOVASCULAR PHYSIOLOGY AND SLEEP
Cardiovascular autonomic system is a highly network integrates to keep visceral functions under control, which in a short timescale (within second to hours), can adjust the circulation in keeping with, environment, emotions and behavior. Ensuring adequate cardiac output to the vital organs through continuous and rapid adjustment of HR, arterial BP, and redistribution of blood flow, is counted as the primary and main role of this system. This neural circulatory regulation seems to be in the longer term unfolds the coupling with the circadian rhythms, W-S cycle, and some ultradian rhythms ; including REMS and NREMS stages, in addition to hormones implicated in the long term with BP control.
The perturbations of the regulation of cardiovascular system during the nocturnal sleep is crucial for the public health and this is underscored by the estimated annual sleep related cardiac events which accounts for 20% of myocardial infarctions or (250,000) and 15% of sudden cardiac deaths or (48,750) in United states (Eckberg and Sleight, 1992). Typically, during night’s sleep, a wide spectrum of autonomic patterns uncovers which provides cardiovascular system with respite or stress. These effects are due to the fine toned or harmonic changes in physiology of Central Nervous System (CNS) as the periodic
reexcitation of the brain during transition from relative tranquility in NREMS to REMS.
1.3.1 SLEEP STATE-CONTROL OF CARDIOVASCULAR FUNCTION
Blood pressure undergoes wide physiological changes between Wake-Sleep states (Silvani, 2008). During NREMS, arterial pressure substantially decreases with respect to Wake in humans (Silvani et al., 2008) and rodents (Silvani et al., 2009) because of decreases in cardiac output and vascular resistance (Silvani, 2008). During REMS, an apparent re-patterning of sympathetic activity to cardiovascular effectors causes changes in arterial pressure, the direction and magnitude of which are highly sensitive to genetic and pathological factors (Silvani, 2008).
The initial stage of sleep cycle, namely, NREMS is characterized as a period of relative autonomic stability with dominance of vagal nerve and hightened baroreceptors gain. Normal respiratory sinus arrhythmia is a term used to describe a near sinusoidal modulation of heart rate (HR) variation occurs as a result of a coupling with respiratory activity and cardiorespiratory centers in the brain during NREMS stage. Inspiration induces a brief accelerations of HR in order to accommodate increased venous return, resulting in increased cardiac output , while progressive deceleration ensues during expiration. This variability in HR, particularly in NREMS, is considered normal and it is generally indication of cardiac health whereas, the absence of this phenomenon is related to aging and cardiac pathology. Also, during breathing, a reflexive cardiovascular alterations manifested as cyclical differences in HR which also have an inverse relationship as a transient increase in arterial blood pressure results in slowing, interruption or decrement of the breathing efforts. During sleep, this effect is enhanced when even a small reduction in BP induces increase in respiratory rate (Lombardi and Parati, 2000). These pauses or increasing heart rates needed as compensatory mechanisms and to normalize the arterial BP. The absence of these normal pauses and dimensioned breathing variation in addition to reductions in respiration