Università degli studi di Pisa
Dipartimento di Biologia
---
Corso di laurea magistrale in
Biologia Molecolare e Cellulare
“Isolation and characterization of mesenchymal
stromal cells from the canine liver”
Candidato
Ermanno Malagola
Relatori: Dr. Bart Spee
Prof.ssa Renata Batiston
Table of Contents
Summary ... 1
Introduction ... 2
Stem cells ... 2
Adult Stem cells ... 5
Mesenchymal stromal cells (MSCs) ... 6
Sources of Mesenchymal stromal cells (MSCs) ... 7
Definition and characterization criteria for MSCs ... 10
In vivo function of MSCs ... 11
The immune-modulatory activity of MSCs ... 13
Therapeutic potential of MSCs... 15
The Liver... 16
Regeneration of the liver ... 20
The dog as a model ... 22
Working hypothesis ... 23
Aim of the thesis ... 23
Material and methods ... 24
Cells sampling ... 24
Bone marrow derived- stromal cells (BMSCs) ... 24
Liver mesenchymal stromal cells (LMSCs) ... 25
Cell culture ... 27
Viability assay ... 27
Proliferation assays ... 28
Population doubling assay ... 28
RNA sampling and analysis... 29
FACS sampling and analysis ... 32
Differentiation assays and staining ... 34
Osteogenic differentiation: ... 34
Adipogenic differentiation: ... 34
Results ... 35
Isolation ... 35
Culture ... 37
RNA profiling of LMSCs and BMSCs ... 43
Fluorescent activated cell sorting (FACS) analysis ... 51
Differentiation assay ... 53
Discussion ... 55
Conclusion ... 61
Annexes ... 63
Protocols ... 63
1. Isolation of LMSCs from frozen chopped liver tissue ... 63
2. Isolation of LMSCs through Liver “perfusion” ... 64
MTT assay ... 65
EdU staining ... 66
qPCR reaction and analysis ... 67
Cell staining and FACS analysis ... 68
Sequencing ... 69
Differentiation ... 71
Osteogenic differentiation ... 71
Alizarin Red Staining ... 71
Adipogenic differentiation ... 72 Oil-Red Staining ... 72 List of figure ... 73 List of tables ... 74 Product list ... 75 References ... 76
1
Summary
Within the field of Regenerative Medicine stem cells hold great potential for treating currently incurable diseases. One of these stem cells of interest is the Mesenchymal Stromal Cell (MSC). Major sources for MSCs are adipose tissue and bone-marrow although recently it has been proven that MSCs can also be isolated from different tissues such as liver (Pan Q, 2011), pancreas(Zanini C, 2011), muscles (Kisiel AH, 2011) etc. MSCs, with their well-known anti-inflammatory activity, are ideal for treatment of acute or fulminant liver diseases for which the only treatment option is liver transplantation. Moreover this multitude of source opportunities makes it possible to perform autologous treatment of patients with minimally invasive approaches. Due to the low number of available liver transplants, alternative (curative) treatments are necessary. Although the use of MSCs in mouse models seems promising, the lack of a large animal model limits the application of MSCs in a human clinical setting. For years the liver research group at the CSCA (Clinical Sciences for Companion Animals, Utrecht, The Netherland) has been investigating the dog as a large model animal. This research showed that canine liver diseases and regenerative mechanisms are highly comparable to their human counterparts. Up to now possibilities of treatments for liver diseases in the dog are limited, for this reason MSCs hold a great potential as a possible population for cell therapies. Prerequisite for the use of MSCs is their characterisation before clinical application. For this we started with the optimization of a protocol for the isolation of LMSCs, starting either from a wedge liver biopsy or from an intra-lobular perfused fraction. The focus of the second part was the characterisation of canine MSCs derived from adipose tissue (ASCs), bone-marrow (BMSCs), and liver (LMSCs). All cell types are in culture at the department of CSCA and multiple samples have been stored (liquid nitrogen). Characterization of the MSCs has been performed according to Dominici et al.(Horwitz EM & Therapy., 2005). The characterization started with gene-expression profiling of the different fractions (ASCs, BMSCs, and LMSCs). Canine specific primers have been designed and optimized and specificity tested by sequencing of the PCR product. Results indicated that all MSC fractions are positive for standard MSC markers (e.g. CD90, CD105) and negative for markers of haematopoietic cells, macrophages, endothelial cells (e.g. CD45). After this a selection of canine specific antibodies directed against Cluster of Differentiation (CD) markers (CD45-, CD90+, CD105+, CD29+, CD166+) has been optimised
for Fluorescent Activated Cell Sorting (FACS) analysis. Finally the resulting LMSCs profile, for both qPCR and FACS analysis, has been compared to the human MSC profile(Fouraschen SM, Secreted factors of human liver-derived mesenchymal stem cells promote liver regeneration early after partial hepatectomy., 2012). This research will be the basis on which clinically applied mesenchymal stromal cells can become a reality within the veterinary field. This will, in turn, provide the necessary information to apply these cells in human clinics.
2
Introduction
Stem cells
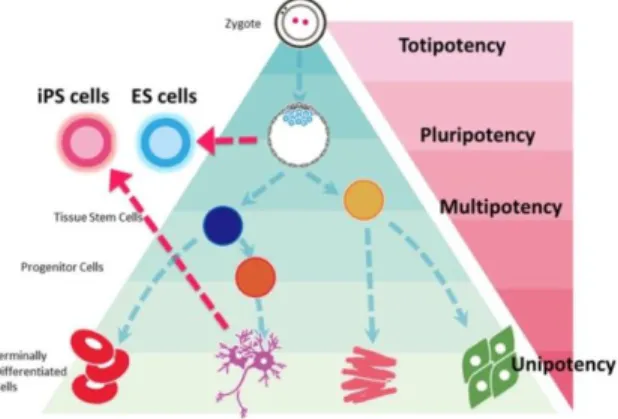
The research of stem cells and their possible manipulation for clinical purposes is nowadays, in my opinion, one of the most interesting and fascinating topics in Molecular Biology. Two main characteristics are required to define a stem cell: the ability to self-renew which ensures stem cells to be able to reconstitute their own population, and the ability to differentiate into different types of cells (Anderson DJ, 2001). The differentiation capacity of stem cells is well known as cell potency and different types of stem cells are hierarchically clustered based on the level of differentiation potency (Fig. 1). Totipotency (being able to produce both the embryonic tissues and its annexes - (Surani MA, 2007)) for example is characteristic only of the zygote cell and few a daughter cells in the first stages of development. Between fertilization and the beginning of segmentation, the cell potency slowly reduces trough the cells decision called lineage events. Pluripotent stem cells for example, have lost their ability to form the extra-embryonic tissues such as the placenta and the yolk sac, but are still able to form the three germ layers of the developing embryo (endoderm, mesoderm, and ectoderm). Pluripotent cells exist in the inner cell mass of the blastocyst and are a source of human embryonic stem cell (hESC) lines (JC., 2008).
Figure 1: Hierarchically classification of stemness potential of stem cells. ES; embryonic stem cells, iPS; induced pluripotent stem cells.
3 This classical view of a hierarchical classification of the stem cell potency is most of time still applicable to study the in vivo behavior of these cells. However, recently the Nobel Prize Yamanaka has proven the possibility to convert potentially any type of somatic cell into a so called Induced Pluripotent Stem (IPS) cell by using a lentiviral overexpression system with a cocktail of transcription factors which are highly expressed in embryonic stem cells (Takahashi K, 2007). Due to this discovery scientist have now started to interfere directly with the cell potential as we are now starting to understand how to move from any kind of somatic cell to another without the need of stepping trough a stem cell like stage (Transdifferentiation) (Ladewig J, 2013).
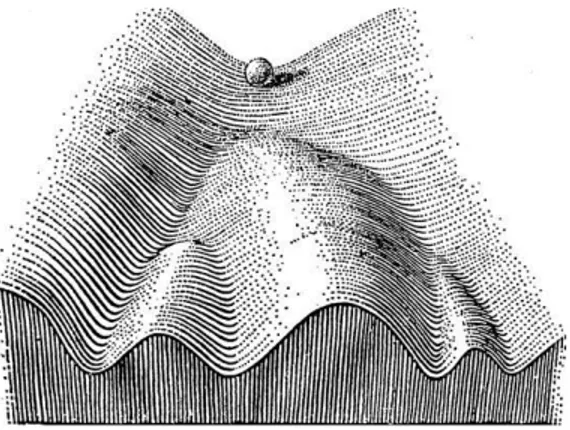
This new prospective of possibilities capsize the point of view that for years has guided research on stem cells, developmental steps are no longer the only path we can follow, now we can play with the infinite networks combination and push the cells towards a new artificial-designed path (commitment) expecting virtually everything. To clarify this idea an easy representation is the Weddington’s model of the epigenetic changes (Figure 2) that occur during the commitment of any (stem)-cell, the marble exemplify a cell going through its differentiation pathway. In this model Weddington imagines the changes in the epigenetic signature as different downhill roads; the marble (the cell), because of the gravity, is able only to roll down entering a specific road without the option of going up again. This model fits the mechanisms that rule the development but technologies such as reprogramming nowadays allow us to redirect the paths that the cell can walk through, either going back up to a more permissive state (Fig. 3-B) either move directly to a different cell fate (Fig. 3-C).
4 Figure 3: Schematic illustration of Weddington's epigenetic landscape model. A | In normal development, a pluripotent cell (which is represented by a marble at the top of the hill) 'rolls' down a landscape that segregates into different groves on the slope. Depending on in which groove the marble falls, the cell acquires a distinct tissue-specific fate. B | A differentiated cell, which is reprogrammed to pluripotency, is symbolized by a marble rolling from the bottom of the hill back to the top. From there, it can be re-differentiated into another somatic cell type. C | During direct conversion, a tissue-specific cell directly converts into a related tissue-specific cell (symbolized by a marble 'jumping' over a low hill) or into a cell type of another germ layer (depicted by a marble jumping over a higher hill). The schematics are based on the original model presented in Fig. 2.
5
Adult Stem cells
Adult stem cells do not show a stemness potential comparable to an embryonic stem cell, but the possibility of autologous treatments and the advances in the reprogramming technology ensure that adult stem cells continue to have a privileged position in the research. In addition we must not forget that the use of adult stem cells for medical purposes allow the avoidance of several ethical issues that rise with the usage of embryonic stem cells. Moreover the chance to get an autologous treatment by the use of self-adult stem cells offer a ploy to avoid rejection of the transplanted material by the immune system [Graph versus host disease]. In addition, in contrast to embryonic stem cells adult stem cells are believed not form teratomas when transplanted. Adult stem cells are supposed to reside in all the tissues and organs of the body, in which they participate in the physiological control of the normal tissue turnover. Examples of adult stem cells are multiple: satellite cells constitute a population of adult stem cells for the muscle regeneration (Chargé SB, Cellular and molecular regulation of muscle regeneration., 2004), neural stem cells are found in the nervous system (R., 1997), or epithelial stem cells in epidermis and intestinal crypts (Slack, 2000), and much more. Despite the different location and origin all these cell populations appear to be quiescent in a physiological state, once activated they are able to generate a progenitor cell that will go under cell lineage decisions and progressively differentiate into the designed cell type to keep the normal tissue homeostasis. Overall further investigations on adult stem cells are still required to evaluate their real potential for cell transplantation purposes. Although, as already discussed, the progress regarding the reprogramming technology does not require the use of stem cells as a starting point, adult stem cells seem to show a privileged epigenetic signature, if compared with other cell types, which eventually can make them easy to reprogram in vitro.
6
Mesenchymal stromal cells (MSCs)
In the variety of several types of adult stem cells mesenchymal stromal cells or mesenchymal stem cells (MSCs) are considered one of the best eligible source for cell therapy. The first description of MSCs was in 1924, when a Russian-born morphologist Alexander A. Maximow (Maximow, 1927)used extensive histological findings to identify a singular type of precursor cell within mesenchyme that develops into different types of blood cells. Afterwards MSCs were identified as a subpopulation of bone marrow cells with osteogenic potential and subsequently were confirmed to contain clonal, plastic adherent bone marrow derived non-hematopoietic stem cells (Friedenstein AJ P. K., 1968). While the terms Mesenchymal Stem Cell and Marrow Stromal Cell have been used interchangeably, neither term is sufficient. The mesenchyme in fact is an embryonic connective tissue that derives from the mesoderm that differentiates into hematopoietic and connective tissue, whereas MSCs do not differentiate into hematopoietic cells (PORCELLINI, 2009). On the other hand stromal cells are connective tissue cells that form the supportive structure in which the functional cells of the tissue reside. While this is an accurate description for one function of MSCs, the term fails to convey the relatively recently discovered roles of MSCs in the repair of tissue (Valero MC, 2012). Subsequent experimentation revealed the plasticity of marrow cells and how their fate could be determined by environmental cues. For instance culturing marrow stromal cells in the presence of osteogenic stimuli such as ascorbic acid, inorganic phosphate, and dexamethasone could promote their differentiation into osteoblasts. In contrast, the addition of transforming growth factor-beta (TGF-b) could induce chondrogenic markers (Yang Z, 2009). Currently, the most excepted term is Mesenchymal Stromal Cells and is therefore used throughout this thesis (Horwitz EM & Therapy., 2005).
7
Sources of Mesenchymal stromal cells (MSCs)
Although first described in the bone marrow, later studies demonstrated that MSCs exist in almost any tissues such as, but not limited to, adipose tissue (Kisiel AH, 2011), umbilical cord blood (Ong WK, 2013)muscle tissue (Jankowski RJ, 2002), neuronal tissue (Gage FH, 1995), and more recently also liver (Pan Q, 2011) (da Silva Meirelles L, 2006). The youngest most primitive MSCs can be obtained from the umbilical cord tissue, namely Wharton's jelly and the umbilical cord blood. However the MSCs are found in much higher concentration in the Wharton’s jelly compared to the umbilical cord blood, which is a rich source of hematopoietic stem cells. The umbilical cord is easily obtained after the birth of the newborn, which is normally thrown away and poses no risk for collection. The umbilical cord MSCs show more primitive properties than other adult MSCs obtained later in life, which might make them a useful source of MSCs for clinical applications (Baertschiger RM, 2009). Still now, the best well-characterized source for adult stem cells is the bone marrow. Adult bone marrow contain a heterogeneous population of cells (Yo Mabuchi, 2013), including, hematopoietic stem cells (HSC), macrophages, erythrocytes, fibroblast, adipocytes, endothelial cells and a subset of non-hematopoietic stem cells with multilineage potential: the so called mesenchymal stromal cells. These MSCs resident in the bone marrow (BMSCs) are supposed to be fundamental for the correct maintenance and survival of HSCs. The role of the BMSCs seems to act as a suppressor of the immunogenic stimuli in the bone marrow avoiding the mobilization of HSCs from the niche. Current models envisage two distinct areas in the bone marrow that control HSCs homeostasis: the endosteal niche and the (peri-) vascular niche (Krause DS, 2013(peri-) (Fig. 4(peri-). The endosteal niche mainly mediates HSC retention, maintenance and quiescence, whereas activated self-renewing HSCs are mainly found in a (peri-) vascular location. Both regions are strongly interconnected, and the emigration of HSCs from the bone marrow requires transit in and out of the (peri-) vascular niche (Le Blanc K, 2012). Moreover BMSCs are supposed to contribute in vivo in the formation of osteocytes and chondrocytes, it follows that BMSC are important for the maintenance of the niche itself, for example osteoblasts support HSCs, whereas adipocytes are negative regulators of HSCs.
8 Figure 4: Hematopoietic stem cell niches. On the left the Endosteal niche and on the right the perivascular niche (Adapted by (Ehninger A, The bone marrow stem cell niche grows up: mesenchymal stem cells and macrophages move in., 2011)).
Another abundant and accessible source of stem cells is the adipose tissue. These cells, called adipose-derived stromal cells (ASCs), are fibroblast-like cells capable of multipotential differentiation which have been found in different species ( (Vieira NM, Isolation, characterization, and differentiation potential of canine adipose-derived stem cells., 2010) – (Rozemuller H, 2010)). MSC cultures from adipose tissue are considered heterogeneous because attempts to characterize an ASCs-specific cell surface marker have shown that cells derived from distinct marker sets can have MSC potential (Gomillion CT, 2006). In man, ASCs for autologous transplantation are usually isolated (Zuk PA, 2001) relatively quickly from adipose tissue by collagenase digestion after liposuction cosmetic surgery. Successful transplantation of canine adipose-derived stem cells (cASCs) in dogs was reported by Li et al. (Li H, 2007) and Black et al. (Black LL, 2007). The first group reported the beneficial effects of using ASCs – bone morphogenetic protein 2 (BMP2) enhanced – in the treatment of canine ulnar defects, and the second for the treatment of chronic osteoarthritis of the hip.
9 Recently van der Laan and colleagues (Pan Q, 2011) have shown the presence and the possibility to isolate a population of liver-derived mesenchymal stromal cells (LMSCs). In particular these cells were isolated from liver graft preservation fluid (perfusates) in which the liver is kept until a transplantation, these cells were compared on a genome-wide gene expression analysis showing high similarities with human BMSCs. LMSCs derived from man completely resemble the criteria for the definition of MSC, in addition to the three lineage differentiation the authors showed the possibility to differentiate LMSCs towards a hepatic fate, this extend the amount of possibilities in which we can utilize LMSCs. Moreover these cells appear to have a high modulation effect on the T-cell proliferation (See further: The immune modulatory activity of MSCs). From this prospective MSCs appear once more an ideal population for clinical purposes confirming the suitability in both allogenic and autologous treatments. Indeed one of the aims of this thesis is the comparison between canine and human LMSCs.
Figure 5: Mesenchymal stromal cells. The plastic-adherent cellular fraction of many organs contains stromal progenitor cells that can give rise to colonies of fibroblastic morphology. When cultured under the appropriate conditions, colonies derived from single cells (colony-forming unit-fibroblasts-CFU-Fs) can be isolated and expanded after multiple passages in vitro without losing their multipotent mesenchymal phenotype. (Picture adapted by (Le Blanc K, 2012)).
10
Definition and characterization criteria for MSCs
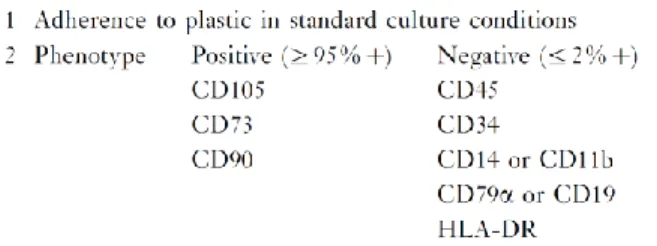
Due to the various ways and locations from which these cells can be isolated and cultured, and the absence of a complete equivalency of these population, a certain level of confusion arose in defining MSCs. For this reason the International Society for Cell Therapy (ISCT) proposed a new terminology and criteria to define the MSC population. According to these widely adopted proposals, the cells were more appropriately considered mesenchymal stromal cells meaning that not all of them were stem cells. Moreover a minimum criteria for defining these cells has been proposed (Horwitz EM & Therapy., 2005) (Fig. 6): first these cells must adhere to culture plastic when maintained in standard culture conditions, second they must express markers such as CD105, CD73 and CD90 and lack expression of CD45, CD34, CD14 or CD11b, CD79a or CD19 and HLA-DR (CD74) surface molecules; third MSCs must be able to differentiate into osteocytes, adipocytes, and chondrocytes in vitro. Interestingly, no evidence of asymmetric cell division, which is considered a property of self-renewing cells in some setting has yet been proven for MSCs (Wu PS, 2008). It is important to note that our knowledge of MSCs is almost entirely based on the characterization of cultured cells, therefore our definition of MSCs is an “operational" one. An important question that raised from these considerations is the in vivo function and derivation of these cells. Even now the in vivo function is a subject of debate since these cells only constitute an in vitro phenomenon.
11
In vivo function of MSCs
Over the years it has become progressively accepted that MSCs could be the basis for a natural system of tissue repair (Prockop, 2007). It is believed that the in vivo function of MSCs is to contribute in tissue regeneration by either a direct repopulation effect or by secreting molecules that are capable to stimulate the normal regeneration of the tissue. Several studies have demonstrated the large potential of adult MSCs to differentiate into several differentiated cells (Fig. 7). Curiously in the majority of the studies on the therapeutic efficacy does not correlate with the efficiency of engraftment, suggesting that the major repair is achieved through an indirect activity (paracrine activity). This indirect effect is achieved through the secretion of molecules that alter the tissue microenvironment and to a lesser extent through transdifferentiation of MSCs into the appropriate cell phenotype (Phinney DG, 2007). In addition the secreting activity of MSC has evoked an increased interest in recent years due mostly to the immune modulatory properties that these cells shown. In addition, since MSCs are in an immune-privileged (See further) state they could prove to be valuable in allogeneic cell transplantation approaches. Although their possible role in tissue homeostasis and repair, the developmental origin of MSC is still a matter of debate. It is widely believed that MSCs have a mesoderm derivation, however Takashima et Al. (Takashima Y, 2007) showed that during embryonic development of the trunk it is possible to isolate a population of MSC-like cells that express specific neuro-epithelium markers. A link between this population the cells of the neural crest seems possible, also taking into account that it has been demonstrated that cells of the neural crest migrate into the bone marrow (Nagoshi N, 2008), however the potential link between the cells of Takashima and MSCs has not been proven. Caplan et al. on the other hand proposed that MSCs can be thought as a pericytes derived cell population or that their niche resides in close proximity to (Caplan AI, 2011); this, with the idea that endothelial progenitors and mural cells may share the same vascular progenitor (Yamashita, 2000), would suggest that MSCs, HSCs and endothelium progenitor cells (EPCs) could arise from a common progenitor.
12 Figure 7: Mesenchymal stromal cell differentiation. MSCs can be cultured in vitro to generate a variety of differentiated cells and demonstrate their multi-potent capacity and differentiation plasticity. The end-stage cell type is dependent on the culture conditions, media, and supplements. Adapted by (Bonfield TL, 2010).
13
The immune-modulatory activity of MSCs
The release of a multiplicity of bioactive molecules by MSCs are able to modulate several different types of cells including cells from the immune system. The immune-modulatory activity of the MSC cell population is one of the main features that place these cells as a major area of interest in the biomedical sciences. Recently some of the immune response pathways that are potentially modulated by the MSCs have been elucidated and they seem to relay on both direct contact as well as paracrine modulation.It is believed that the in vivo reflection of this immune modulatory effect stems from the fact that MSCs in the bone marrow (stromal cells) might serve to protect the sensitive hematopoietic stem cell population from being mobilized from the immune system (Lepperdinger, 2011). Lymphocytes and natural killer cells are potential sources of pro-inflammatory cytokines, MSC interact with T-cells and many other immune cells thereby promoting dominant modulatory processes (Fig. 8). The effects on CD4+ and CD8+ T-cells are best characterized
(Dazzi F, 2011). Inhibition of T-cell proliferation by MSCs, for example, depends on the arrest of T-cells in the G0/G1 phase (Krampera M, HB-EGF/HER-1 signaling in bone marrow
mesenchymal stem cells: inducing cell expansion and reversibly preventing multilineage differentiation., 2005). MSCs in fact do not promote T-cell apoptosis, but instead they support their survival in a state of quiescence. This mechanism has shown to induce a shift from a pro-inflammatory state of T-cells, that in this fashion produce IFNγ that stimulates both the innate and the adaptive immunity (i.e. it is able to trigger macrophages activation), to an anti-inflammatory state in which T-cells produce Interleukin 4 (IL-4) that lead to a decrease of the inflammatory response. An example of this activity is the expression of Prostaglandin E2 (PGE2), a molecule with immunosuppressive potential that is selectively produced by MSCs. It acts in synergy with indoleamine-2,3-dioxygenase (IDO), and MSC-derived PGE2 is capable to reverse an inflammatory into an anti-inflammatory environment, altering the cytokine secretion profile of dendritic and T-cell subsets (Trento C, 2010). Moreover IDO induces the depletion of tryptophan from the local environment, which is an essential amino acid for lymphocytes proliferation (Uccelli A, 2008). Owing to the reversible nature of this inhibition, responding cells are not triggered to undergo apoptosis; it appears likely that MSC to all intents and purposes protect from apoptosis, which is in concordance with the notion that the actual duty of MSC is to support tissue repair.
14 These modulatory activities of MSCs appear to be important also in the liver regeneration process by secreting factors that promote hepatocytes proliferation; interestingly it has been shown that treatment with a concentrate of conditioned media of liver MSCs in vitro promote in vivo liver regeneration (Fouraschen SM, Secreted factors of human liver-derived mesenchymal stem cells promote liver regeneration early after partial hepatectomy., 2012).
Figure 8: The anti-inflammatory effect of MSCs offer by secreting growth factors and cytokines as well as using cell-cell interactions. Pathway 2-4 and 6 show how MSCs affect the innate immune response whereas pathways 1 and 5 show MSCs effect on the adaptive immune response (Aggarwal S, 2005).
15
Therapeutic potential of MSCs
Although clinical interest in cultured mesenchymal stromal cells initially focused on the potential of their stem cell-like properties for tissue regeneration and repair, the discovery of their paracrine properties markedly increased the range of therapeutic applications for which they are currently studied. Systemic infusion of mesenchymal stromal cells has proved beneficial in different preclinical models of acute lung injury, myocardial infarction, diabetes, multiple sclerosis, as well as renal and hepatic failure (Uccelli A, 2008). Although the mechanisms underlying the therapeutic effects of MSCs in these disease models are not well characterized, they are thought to partially depend on the release of a combination of multiple bioactive molecules with anti-inflammatory, anti-proliferative, anti-apoptotic and angiogenic properties. The current hypothesis is that paracrine factors secreted by mesenchymal stromal cells provide protective micro environmental cues and promote repair by local tissue-resident progenitor populations, thereby explaining the detection of favorable effects even in the absence of prolonged mesenchymal stromal cell engraftment in sites of injury as already discussed previously. These findings have prompted clinical studies on the therapeutic potential of mesenchymal stromal cells. For instance, the osteogenic properties of mesenchymal stromal cells have been used to treat children with osteogenesis imperfecta and have shown promising outcomes (Horwitz EM G. P., 2002). On the basis of their immunoregulatory and tissue protective properties, mesenchymal stromal cells are also being tested for the treatment and prevention of graft-versus-host diseases. Nevertheless, in most cases, these studies are preliminary, and treatment efficacy has not been conclusively established. Some of the major questions that still need to be resolved concern the standardization of protocols for the isolation of mesenchymal stromal cells and their expansion in vitro, the safety of such cell-based therapies and the homing and engraftment of mesenchymal stromal cells to their target tissues. In addition, the lack of a large animal model hampers the translation of fundamental mouse studies to a clinical application in human diseases.
16
The Liver
Before we can discuss the therapeutic potential of MSCs for the treatment of liver diseases. We will now focus on the liver morphology, function, regeneration, and pathobiology. Liver development is not included in this segment but is described in detail by Aaron M. Zorn, et al. (StemBook Chapter - 15 Jan 2009).
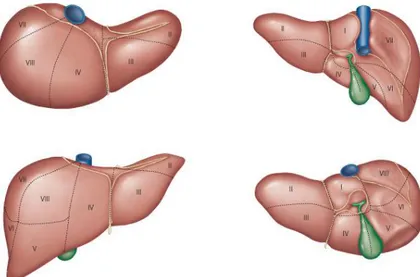
The liver is the largest internal organ and it provides many essential metabolic, exocrine and endocrine functions, these include production of bile, metabolism of dietary compounds, detoxification, regulation of glucose levels through glycogen storage, and control of blood homeostasis by secretion of clotting factors and serum proteins such as albumin. The liver lies in the abdominal cavity, in contact with diaphragm. Its mass is divided into several lobes (Fig. 9), the number and size of which vary among species. In most mammals, a greenish sac - the gall bladder - is seen attached to the liver sharing a common bile duct, which delivers bile from the liver and gall bladder into the duodenum. Hepatocytes are the principal cell type in the liver and these along with biliary epithelial cells are derived from the embryonic endoderm.
Figure 9: Representation of the lobes subdivision of the liver in man, looking from different orientations (Adapted from (Varotti G, 2004)).
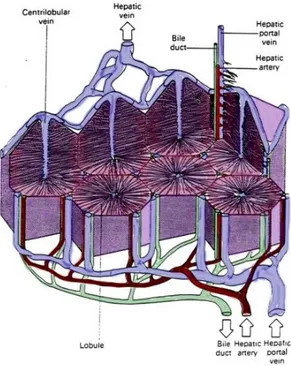
17 Understanding function and dysfunction of the liver, more than most other organs, depends on understanding its structure, focusing mainly on its vascular system, the organization of a biliary tree in a specific three-dimensional arrangement.
One of the unique characteristics of the liver is undoubtedly its hepatic vascular system (Fig. 10): almost all the blood is venous blood returning from the small intestine, stomach, pancreas and spleen that converges into the portal vein. One consequence of this is that the liver gets "a sip” of everything absorbed in the small intestine, which is where virtually all nutrients are absorbed. The remaining blood fraction is arterial blood coming from the hepatic artery. These two sources of blood empty together and mix as they merge in the sinusoids. Sinusoids are fenestrated vessels that circumvent the hepatocytes. As blood flows through the sinusoids, a considerable amount of plasma is filtered into the space between endothelium and hepatocytes (so called: "space of Disse"), providing a major fraction of the body's lymph. Once the blood has passed through the sinusoids, it empties into the central vein of each lobule, those become hepatic veins that convey in the vena cava.
Figure 10: Representation of the liver vascular system (adapted by https://courses.stu.qmul.ac.uk/smd/kb/microanatomy/d/alimentary/)
18 Adjacent to the vascular system runs the biliary tree, the biliary system consist of a series of channels and ducts that conveys bile - a secretory and excretory product of hepatocytes - from the liver into the lumen of the small intestine. Hepatocytes are polarized cells with their apical surfaces facing and surrounding the sinusoids. The basal faces of neighboring hepatocytes are welded together by junctional complexes to form the canaliculi, the first channel in the biliary system. A bile canaliculus is not considered a duct, but rather, the dilated intercellular space between adjacent hepatocytes. Hepatocytes secrete bile into the canaliculi, and those secretions flow parallel to the sinusoids, but in the opposite direction that blood flows. At the ends of the canaliculi, bile flows into bile ducts, which are true ducts lined with epithelial cells. Bile ducts thus begin in very close proximity to the terminal branches of the portal vein and hepatic artery, and this group of structures is an easily recognized and important landmark seen in histologic sections of liver - the grouping of bile duct, hepatic arteriole and portal venule is called a portal triad. The biliary tree convey all together into larger ducts to end into the large common bile duct which dumps bile into the duodenum. A sphincter known as the sphincter of Oddi is present around the common bile duct as it enters the intestine. Adhering to the liver common bile duct there is the gall bladder. This is a sac-like structure which has a duct, the cystic duct that leads directly into the common bile duct. During periods of time when bile is not flowing into the intestine, it is diverted into the gall bladder, where it is dehydrated and stored until needed.
As briefly discussed above the topographic organization has an important role in accomplishing its function. To maintain and protect this 3D organization the liver is covered with a connective tissue that pervade all of its mass. This connective tissue tree provides a scaffolding support for the entire organ, in addiction the layers of connective tissue divide the parenchyma of the liver into very small units called lobules. The hepatic lobule is the structural unit of the liver. It consists of a central vein, at the vertex of the lobule are regularly distributed portal triads, containing a bile duct and a terminal branch of the hepatic artery and portal vein. The portal triad is surrounded by hepatocytes arranged in single cell sheets known as hepatic plates (Fig. 11).
19 Figure 11: Representation of the topological distribution of hepatocytes plates. All the cells are located on a single cell layer, in the center the central vein which receive fluids from all the lobule thanks to the sinusoid network.
Figure 12: Three-dimensional structure of a liver lobule. The liver receives 75% of its blood supply from the portal vein and the rest from the hepatic artery. The portal veins and hepatic arteries terminate in the intrahepatic portal tracts, which contain bile ducts that transport bile from the canaliculus through the extrahepatic biliary system to the gut. The terminal portal veins give rise to septal branches that drain blood into the sinusoids that make up the distributing system, which takes blood through the acinus to the central vein. The hepatic artery terminates in axial branches that run parallel to the portal vein and terminate in the sinusoids. The sinusoids are lined by morphologically and phenotypically unique endothelial cells (see inset) that are characterized by the absence of tight junctions, the absence of a recognizable basement membrane and the presence of open fenestrae that are organized into sieve plates. The sinusoidal endothelium is interspersed with macrophages that are known as Kupffer cells and overlies the space of Disse, which contains extracellular matrix proteins and fibroblasts that are known as hepatic stellate cells. Dendritic cells from the parenchyma exit the liver through the space of Disse (Adams DH, 2006).
20
Regeneration of the liver
The liver is a highly regenerative organ with a remarkable ability to restore its original mass following parenchymal cell loss (Fausto N R. K., 2005). After parenchymal loss a process of general hyperplasia occurs which aim is to reconstitute the loss of mass in order to reestablish the normal liver function. However this ability is impaired in numerous diseases such as advanced acute or chronic hepatitis in which liver transplantation is still the only curative treatment. Nowadays 170 million patients world-wide are estimated to suffer by a form of chronic liver disease, of these about one third can be expected to develop significant fibrosis and eventually cirrhosis (Sokal EM, 2003); for this reason understanding the molecular insight of the liver regeneration constitute an important challenge for the regenerative medicine field. One of the first questions to be asked is which cell types participate in the process and how they modulate regeneration. Growth of the adult liver is supported by two main cell populations: hepatocytes and progenitor cells, the latter also known as oval cells in rodents. The hepatocytes, which are normally quiescent, constitute the first line of response to injury or resection. Progenitor cells function as a reserve compartment (Fausto N R. K., 2005) in the situation where hepatocytes proliferation is inhibited (Oertel M, 2008). The progenitor cells are supposed to originate in the canals of Hering (Theise ND, 1999). Progenitor cells are activated in the majority of liver diseases (Roskams TA, 2003), but there activation is considered too little or too late in the majority of the cases.
Regeneration by hepatocytes has been studied in great detail, several studies have demonstrated that after partial hepatectomy 95% of the hepatocytes enter the cell cycle again and undergo at least one division. Although the priming process shows similarities along the species, the time-course of the process differs, reflecting differences in the cell cycle spawn. To note, the percentage of hepatocytes that divide during liver regeneration drops considerably in old animals compare to young (Butcher, 1963). Experiments led to investigate these differences in the replication ratio of hepatocytes among species showing that there are differences among species. Interestingly Weglarz and Sandgren (Sandgren, 2000) compared the proliferation ratio of rat and mouse hepatocytes in a partial hepatectomy system demonstrating that indeed they share common pathways but they react to them in a species specific manner. The concept by which liver regeneration occurs among species trough the same molecular pathways has been shown also specifically for the dog (Spee B A. B., 2006) (Fig.13).
21 Figure 13: Liver cells types and their organization. Progenitor cells, in violet, under opportune mitogenic stimuli can trigger the so call ductural reaction by which progenitors cells might go either through a cholagiocyte lineage or a hepatocyte lineage. Adapted by Spee et al., 2006.
22
The dog as a model
Although the use of murine models in the field of hepatology has increased our knowledge of liver regeneration considerably, several aspects of regenerative medicine can only be studied in a large animal model. When concerning cell therapy, the life span and size of murine models does not allow enduring longitudinal studies for safety and efficacy. One large animal model that is gaining increased intention is the dog. For more than a century, dogs have been successfully developed as an experimental model system. As a model system, dogs provide unique advantages due to their close relationship with humans. Because dogs live with humans, they are exposed to the same environmental factors, and adhere to similar lifestyle and diet. As a result, the rise in lifestyle diseases such as obesity, diabetes and liver disease in the human population is accompanied by a similar rise in these pathologies in dogs. In addition, specific breeds are prone to genetic disorders that carefully recapitulate the human disease. Yet unlike human genetic disorders, due to selective inbreeding, the genetic variability within breeds is limited, clearly facilitating genetic studies on complex inherited diseases. This has prompted various groups to initiate genetic linkage analyses in specific dog breeds ( (Parker HG K. L., 2004); (Xie, 2005); (Khanna C, 2006); (Karlsson EK, 2007)) and it is apparent that the canine model system provides unique insights into human biology and disease (Parker HG S. A., 2010).
Taken together, dogs are an extremely informative model species to bridge fundamental mouse models and human clinical practice. For various reasons, the translation from mouse models into human clinical practice has been little successful. This is particularly true for liver diseases which for the dog are highly comparable to man on a pathophysiological level (Spee et al, 2006 & 2007). For example, Dogs with a Mendelian inherited copper storage defect due to a mutation in the COMMD1 gene (van De Sluis B, 2002) develop chronic hepatitis highly similar to Wilsons disease in man (Favier RP, 2011). These similarities are not just based on histology, but more importantly the signal cascades that are affected are similar in both species. Isolation and regulation of human and canine adult stem cells confirmed the strong similarities in tissue homeostasis and pathogenesis between these species ( (Schotanus BA, 2009); (Arends B, 2009)).
23
Working hypothesis
1. Mesenchymal stromal cells (MSCs) are present in the canine liver.
2. Both the perfusion and the enzymatic digestion of liver can be used for the isolation of LMSCs.
3. DMEM media shows superior level of cell growth compared to αMEM.
4. Addition of growth factor to the culture condition has a positive effect on the proliferation of LMSCs.
5. LMSCs and BMSCs show overall comparable results on different levels of analysis: cell growth, gene expression profiling, FACS analysis, and differentiation potential. 6. LMSCs show indication of an activated prostaglandin pathway.
Aim of the thesis
The lack of common standards and precise definition of initial cell preparation remain a major obstacle in research on MSCs and their application; the aim of this thesis is to compare the characterization of LMSCs and BMSCs collected in the canine model. The possibility to compare different types of MSCs isolated from the same donor offer a privileged experimental setting for these purposes. The characterization of these cell populations based on the proposed terminology and criteria according to the International Society for Cell Therapy (ISCT) including gene-expression profiling in conjunction with the FACS analysis will allow the exploitation of quested differences between the MSC types. To conclude this research will be the basis on which clinically applied mesenchymal stromal cells can become a reality within the veterinary field. This will, in turn, provide some of the necessary information to apply these cells in human clinics.
24
Material and methods
Cells sampling
All canine MSCs were isolated from dogs that were euthanized for other unrelated experiments approved by the Ethics Committee on Animal Experimentation of Utrecht University. In particular all the individuals were either Labrador, 19 weeks old, or Beagle, 1 or 2 to 5 years old.
Bone marrow derived- stromal cells (BMSCs)
MSCs were obtained from the diaphysis of the homerus and/or femur. To collect the bone marrow, each diaphysis was flushed and curetted with heparinized α-MEM (Invitrogen 22561) supplemented with 10% Fetal Bovine Serum Gold (FCS, PAA Laboratories A15-151) and 1% penicillin/streptomycin (PAA Laboratories P11-010). The aspirates were seeded at a density of 100-150x106 cells per T175 culture flask (Cell star). After 24 hours,
non-adherent cells and cell debris were washed out with 2% Hanks Balanced Salt Solution (HBSS) + 2% FCS. The BMSCs were further expanded in α-MEM + 10% FCS + 1% penicillamine/streptomycin (p/s) + 0.05% Fungizone (Invitrogen) + 0.1mM ascorbic acid-2-phosphate (Sigma A8960) + 10-9M dexamethasone (DMSO, Sigma D1756) + FGF 1 ng/mL
(AbD serotec). Cells were cultured at 37°C under humidified conditions in air containing 5% carbon dioxide. MSCs appeared rounded at first and after approximately 3-4 days they appeared spindle like. On average, they reached 80% confluency within 7 days and were then cryopreserved in α-MEM + 10% DMSO + 10% FCS at P0. After thawing, cells were
seeded at 1x10⁶ per T175 and expanded up to P
2, followed by cryopreservation until further
25
Liver mesenchymal stromal cells (LMSCs)
Two main approaches have been tested for the isolation of LMSCs: an enzymatic digestion from a chopped sample and a perfusion with HBSS of the whole lobe trough the blood vessels.
Enzymatic digestion
Enzymatic digestion of the wedge liver biopsies has been performed as described in supplemental annexes: protocol 1. In short, the liver was excised aseptically from the cadaver and a wedge biopsy was placed in cold HBSS. Immediately after the surgical sampling the wedge biopsy was minced and frozen in multiple cryovials, on average 1.9g of tissue each, in 50% DMEM + 40% FCS + 10% DMSO. Several enzymes have been tested for tissue digestion (Table 1): Liberase (0.23 Wunsch unit/ml, Roche Diagnostic), Dispase (0.4 U/mL, Gibco), Collagenase Type II (50 U/mL, Worthington) and a combination of Dispase (0.4 U/mL, Gibco) and Collagenase Type II (60 U/mL, Worthington). After digestion two fractions of cells were collected by low speed centrifugation (50g, 10 min). The cell pellet obtained after the first centrifugation step is considered the parenchymal fraction. The cell pellet after the second centrifugation step of the supernatant (200g 10 min) is considered the non-parenchymal fraction. Liver MSCs have been found in both of the fractions although a larger amount have been found in the parenchymal fraction, for this reason the parenchymal fraction has been selected as the preferred starting point. Before this decision a gene expression profile analysis had been performed to ensure the absence of putative differences between the fractions derivation (data not shown).
Table 1: Enzymes tested for the digestion of liver tissues and relatives enzymatic units used.
Enzyme Enzymatic unit
Collagenase T2 50 U/mL
Liberase 0.23 WU/mL (Wunsch units)
Dispase 0.4 U/mL
26
Liver Perfusion
For the perfusion of a liver lobe the liver was removed aseptically from the cadaver and the left lateral lobe of the liver was removed. Cold Hanks Balanced Salt Solution (HBSS, Gibco) was flushed through the liver with a large syringe (50 mL Falcon syringe), several fractions of 50 mL perfusate were collected and analyzed. Because of the large amount of red blood cells in the perfused fraction a centrifugation (400 g, 30 min) with Ficoll (1:1-10mL Ficoll: 10mL media- , FICOLL-PLAQUE™ plus, cat. 07957 StemCell technology) gradient has been performed, this allowed us to isolate the mononuclear cells only; in this fashion cells were able to attach to the plate with higher efficiency.
27
Cell culture
Cells obtained from either the parenchymal fraction or the mononuclear fraction from the perfusion were seeded in a 6 well plate format. After 24h non-adherent cells and cell debris were washed out with pre-warmed HBSS and standard culture conditions were added. Cells were cultured under different conditions to investigate the optimal culture conditions for LMSCs. The most common expansion media used for MSCs cultures is DMEM with the addition of fetal calf serum (FCS), in addition to this setting we also tested the αMEM and the use of additives such as basic Fibroblast Growth Factot (bFGF/FGF2) and ascorbic acid (AsAp – also known as vitamin C) in which canine BMSCs are cultured (Collaboration with Dr. MA Tryfonidou). Cells were washed twice a week and passed using trypsin for 5 min at 37oC. For each passage cells were seeded in 6 well plates at a density of 6.25x10³ cells/cm2
(3.6x10⁵ cells/plate).
Viability assay
To evaluate viability of LMSCs in different culture conditions, in particular DMEM + 10% FCS + p/s or α-MEM + 10% FCS + 1% p/s + bFGF + AsAp, a 3-(4,5-Dimethylthiazol-2-yl)-2,5-diphenyltetrazolium bromide (MTT, Sigma) assay was performed in 6 replicates per condition as previously described (Berridge MV, 2005). Cells were seeded at a density of 9x10²cells/cm2 in a 96well plate format and treated for 48 hours. Filtered MTT was added
to the media (20µL to 100µL of media, 5mg/mL); after two hours of culturing cells were washed and 50 µL of DMSO was added to each well. After an incubation step on the orbital shaker the absorbance was measured with a plate reader at 595nm (DTX880 multimode detector with Anthos detection software, Beckman Coulter, Woerden, The Netherlands). Measurements were corrected for background absorbance present in negative controls wells (MTT/DMSO – no cells).
28
Proliferation assays
To estimate the rate of cell proliferation of LMSCs in different culture conditions; DMEM + 10% FCS + p/s and α-MEM + 10% FCS + 1% p/s with our without culture additives bFGF and AsAp, a 5-ethynyl-2’-deoxyuridine (EdU) incorporation assay was performed according to Salic et al.2008 (Salic A, 2008). In short, cells were seeded at a density of 9x10²cells/cm2 in
a 96 well/plate format, after 48 hours of culture EdU (10µM) was added to the media and incubated for 2 hours. At this point EdU will be incorporated in the DNA during the S-phase. Cells were than washed with HBSS, fixed in freshly prepared PFA 3.7% for 10 min at RT, washed and stored in sterile PBS at 4°C until a Cu(I) catalyzed EdU click-chemistry reaction was performed followed by a 5µM Alexa Fluor 488-azide step (Invitrogen, Breda, The Netherlands) and DAPI 1:1,000 counter stain (Invitrogen). The percentage of EdU positive cells in each well was measured relative to the total number of cells by automated read out on an ArrayScan™VTI (600 series), version 6.6.1.3-1.00x with an algorithm created appositely for LMSCs.
Population doubling assay
To establish the growth potential with a population doubling assay, LMSCs were seeded at a density of 6.25x10³ cells/cm2 (in a 6 well plate format). BMSCs were seeded at a density
of 5.714x10³ cells/cm2 (in 175 cm2 culture dishes). Every third day cells were trypsinised
counted and seeded again at the same seeding density. With the number of cells obtained at each passage a population doubling (PD) estimation has been calculated using the formula reported below (Hayflick L., 1973):
PD= (Log(Nf)−Log(Ni))Log2
In particular PD tally the number of divisions that the cells do at each passage (3 days), Nf
correspond to the cell count at the third day and Ni is the initial seeding amount (3.6×10⁵).
To note some of the results on the PD of the cells will be shown using cumulative population doubling (cPDs), in this fashion at each passage number will correspond the total number of estimated divisions per well up to that passage (i.e. cPDP2=PDP1+ PDP2).
29
RNA sampling and analysis
From each passage (P0-P4) a total RNA isolation was performed using the RNeasy Micro Kit
(Qiagen, cat. No. 74004) according to the manufacturer’s instructions as well as on-column DNase treatment (0.1 U/µL, QIAGEN, Benelux BV, Venlo, The Netherlands). RNA quantity and quality was analyzed using NanoDrop ND-1000 (Thermo Fisher Scientific, Wilmington, DE). After isolation cDNA was created with the iScript cDNA Synthesis Kit (BioRad, Veenendaal, the Netherlands) according to the manufacturer’s instructions. RNA input for each sample was set at 350ng/µL. All the primers tested (Table 2) were designed using Perlprimer v. 1.1.21 (http://perlprimer.sourceforge.net) and ordered from Eurogentec. A quality control and an investigation of putative 3D rearrangements have been done using the mFOLD web tool (http://mfold.rna.albany.edu/?q=mfold/DNA-Folding-Form); once tested the amplicons have been sequenced with a Big Dye Terminator Cycle Sequencing reaction using the 3130xl Genetic Analyzer (Applied Biosystems Ref: 3130XL) and finally blasted using the Ensemble database (http://www.ensembl.org/index.html) to prove the target identity.
qPCR analysis has been performed in a 10µL volume, 384wells plate format, as described in the protocol and run in the C1000 Touch™ Thermal Cycler (Biorad ref: C1000 Touch™). In short, a standard pool (S1S7) was prepared from 5µL of each cDNA samples diluted 50x following a 4-fold dilution series. Data were analyzed using the comparative cycle threshold method with normalization of the raw data to six reference genes: 5S ribosomal RNA (RPS5), 19S ribosomal RNA (RPS19), 13S ribosomal protein L13 (RPL13), hypoxanthine phosphoribosyltransferase 1 (HPRT), Tyrosine 3-Monooxygenase/Tryptophan 5-Monooxygenase Activation Protein, Zeta (YWAZ), and β-2-microglobulin (B2MG).
30 Table 2: List of primers designed for the gene expression profile analysis.
Gene Sequence Accession number Amplicon Temp.
CD105 CAT-CCT-TCA-CCA-CCA-AGA-G CAG-ATT-GCA-GAA-GGA-CGG ENSCAFG00000020106 139 60 CD90 CAG-CAT-GAC-CCG-GGA-GAA-AAA-G TGG-TGG-TGA-AGC-CGG-ATA-AGT-AGA ENSCAFG00000029265 134 63.5 CD166 AAG-CGT-CAT-AAA-CCA-AAC-AG TAT-AGC-AGA-GAC-ATT-CAA-GGA-G ENSCAFG00000009721 150 61 CD29 GAT-GCC-TAC-AAC-TCC-CTT-TCC-TCA CAT-TTT-CCC-CTG-TTC-CAT-TCA-CC ENSCAFT00000006178 118 60 CD73 CTC-CAA-CAC-ATT-CCT-TTA-CAC ACT-CAA-CCT-TCA-AAT-AGC-CT ENSCAFG00000002994 150 61 CD44 CTT-CTG-CAG-ATC-CGA-ACA-CA GAG-TAG-AAG-CCG-TTG-GAT-GG ENSCAFG00000006889 147 60 CD45 GAC-CAT-GGG-GTG-CCT-GAA-GAT CAC-AAT-GGG-GCC-ACT-GAA-GAA-G ENSCAFG00000011265 90 60 CD235 a AAGCAGGTTTCATTTCCACAG TCCCTATTATCACTGGTTCAGAG ENSCAFG00000031944 152 60 CD11b ACT-CAG-ACA-GGA-AGT-AGC-A CAG-CAT-AAC-CCA-AGT-AAG-CA ENSCAFG00000016881 210 61 CD14 CCC-GGC-GCT-CAC-CAC-CTT-AGA-C CCT-GGA-GGG-CCG-GGA-ACT-TTT-G ENSCAFG00000005852 98 60 CD19 CAA-GAC-CAA-CTC-TCC-CAG CCT-CAT-TCT-CGT-AAG-ACT-CAG ENSCAFG00000017303 111 60 CD144 GAT-ATT-CCA-TCC-GCA-AGA-CC AAT-CCA-GTT-CTT-TAG-CCT-CCA ENSCAFG00000020413 137 61 Ck18 TTG-CTA-CCT-ACC-GTC-GCC-TGT-TGG ATC-TTG-CGG-GTG-GTG-GTC-TTC-TGG ENSCAFG00000007154 109 63.5 Ck19 GCC-CAG-CTG-AGC-GAT-GTG-C TGC-TCC-AGC-CGT-GAC-TTG-ATG-T ENSCAFT00000025270 86 63.5 Alb TGT-TCC-TGG-GCA-CGT-TTT-TGT-A GGC-TTC-ATA-TTC-CTT-GGC-GAG-TCT ENSCAFT00000004843 92 63.5 Onecut 1 ACC-CTG-GAG-CAA-ACT-CAA-GTC CCT-TCC-CAT-GTT-CTT-GTT-CTT-TCC ENSCAFG00000015867 - 58 Onecut 2 TGG-AGT-AAA-CTC-AAA-TCT-GGC CTG-TCT-TTG-TTT-GGT-TCT-TGC ENSCAFG00000000127 - 58 CD255 GGA-AGA-GGC-CAA-AAT-CAA-CA ACC-AGC-AAG-TCC-AGC-TTC-AG ENSCAFG00000016618 150 63 CD266 GAC-CTC-GAC-AAG-TGC-ATG-G CGA-GAA-GCC-AGA-AAG-CAG-TC ENSCAFG00000023134 165 63 Nanog CAA-GCA-CCC-AAC-TCT-AGG GTC-CTG-AGT-AAG-CAG-ATC-C ENSCAFG00000031047 150 64.5 Oct4 ACG-ATC-AAG-CAG-TGA-CTA-TTC-G GAG-GGA-CTG-AGG-AGT-AGA-GCG-T ENSCAFG00000000485 158 64.5 Sox2 AAC-CCC-AAG-ATG-CAC-AAC-TC CGG-GGC-CGG-TAT-TTA-TAA-TC ENSCAFG00000011642 152 61
31 LGR5 AGT-CGA-TAC-CGG-AGA-AAG-CA GAG-GCA-CCG-TTC-AGA-GTC-A ENSCAFG00000000451 139 61 LIN28 CCA-CCC-CAG-CCC-AAG-AA CAG-TGG-ACA-CGA-GGC-TAC-CA ENSCAFG00000012488 66 61 CD133 CTG-GGG-CTG-CTC-TTT-GTG-AT AGG-CCC-CAT-TTT-TCT-TCT-GTC ENSCAFT00000044445 115 60.5 CD74 CTG-CCC-ATT-CAA-AGC-CTG GTT-CTC-AAA-GAC-CTT-CCA-ATC-C ENSCAFG00000018101 197 64 CD274 CGT-TCC-AGC-AAG-TGA-GAG CCA-CAT-CCA-TCA-TTC-TCC-C ENSCAFG00000002120 115 64 PTGS1 GTT-CCT-GTT-CAA-CAC-CTC-C GTC-TAT-GTT-TCT-ACC-TCC-ACC ENSCAFG00000020263 105 61 PTGS2 GTA-TGA-GCA-CAG-GAT-TTG-AC TGA-AGT-GGG-TAA-GTA-TGT-AGT-G ENSCAFG00000013762 149 60 CD146 GGG-AAT-GCT-GAA-GGA-AGG CTT-GGT-GCT-GAG-GTT-CTG ENSCAFG00000012079 99 63 RPS5 TCA-CTG-GTG-AGA-ACC-CCC-T CCT-GAT-TCA-CAC-GGC-GTA-G ENSCAFG00000002366 141 62 RPS19 CCTTCCTCAAAAAGTCTGGG GTTCTCATCGTAGGGAGCAAG ENSCAFG00000001608 95 62 RPL13 GCC-GGA-AGG-TTG-TAG-TCG-T GGA-GGA-AGG-CCA-GGT-AAT-TC ENSCAFG00000019840 87 62 B2MG TCC-TCA-TCC-TCC-TCG-CT TTC-TCT-GCT-GGG-TGT-CG ENSCAFG00000013633 85 62 HPRT AGC-TTG-CTG-GTG-AAA-AGG-AC TTA-TAG-TCA-AGG-GCA-TAT-CC ENSCAFG00000018870 104 58 YWHA Z CGA-AGT-TGC-TGC-TGG-TGA TTG-CAT-TTC-CTT-TTT-GCT-GA ENSCAFG00000000580 94 58
32
FACS sampling and analysis
Cell fractions were collected during the passaging step specifically at P2 for cell sorting
purposes; a minimum of 5x10⁵ cells have been frozen in 50% αMEM, 40% FCS and 10%
DMSO for FACS analysis. Fractions were seeded two to three days in advance before the analysis. For each antibody or control (Table 3) a titration experiment was conducted to estimate the best amount to use per reaction. Briefly, after trypsinization cells were counted and divided in nine fraction with a minimum of 50x103 to a maximum of 500x103
per reaction. Cells were washed in Phosphate Buffered Saline (PBS, pH 7.4) and resuspended in 50µL of FACS buffer (PBS 1x, FCS 10% and Sodium azide 0.1% w/v). At this point cells were incubated with the antibody for 30 min on ice and then washed twice with FACS buffer, as to get rid of the non-bonded antibody.
Prior to go to the FACS CANTO II (BD bioscences) for the analysis, 7-Amino-actinomycin D (7AAD, 0.25µg/test, BD Biosciences) was added in each tube, the 7AAD is a fluorescent marker for DNA which is used to detect dead cells as previously described from Lindén et al. (Lindén E, 1997). The system used for the analysis was a FACS Canto II (BD biosciences Cat: 338960), data were first collected with the FACS Diva software and the analysis has been performed with either FlowJo software (http://www.flowjo.com/) or Cytobank (https://www.cytobank.org/).
33 Table 3: List of antibodies included in the analysis.
Target
Host
Reactivity
Manufacture
Cat.number
CD105 Rabbit Dog-Pig Antibodies-online ABIN888668
CD90 Rat Dog eBioscence 12-5900-42
CD29 Mouse Human-Cow-Dog BioLegend 303004
CD166 Rabbit Human-Mouse-Rat-Cow-Dog-Pig-Horse-Chicken
Antibodies-online ABIN673954
CD45 Rat Dog LSBio LS-C127720
Rat IgGk Rat - eBioscence 12-4031-82
Rabbit IgGk
Rabbit - Antibodies-online ABIN376422
Mouse IgGk
34
Differentiation assays and staining
To test the real potential of LMSCs multiple differentiation assays were performed; cells were cultured at least one day in expansion media and then moved to specific differentiation condition as described in protocol (protocols listed in the annexes); for all the experiments condition media were change every three days for an estimate time of three weeks.
Osteogenic differentiation:
Cells were seeded at the density of 3000 cells/cm2 in a six well plate, in particular two well
were left in basic culture media and used as a control. The culture conditions tested to stimuli the cells towards an osteogenic lineage were: DMEM HG + glutarmax + 10% FCS + 1% p/s + AsAP 0.1 mM + Dexamethasone 0.1 µM (Sigma) + Glicerol-phosphate 2 mM (Sigma). After three weeks of culture in condition media cells were stained for 20 min with 1,2-dihydroxyanthraquinone or Alizarine Red (333ng/mL) at a pH of 5.5, this organic compound form precipitate when met free ionic calcium revealing the presence of calcium deposits in the plate (sign of bone formation). Finally cells were carefully washed and resuspend in PBS.
Adipogenic differentiation:
Cells were seeded at the density of 30000 cells/cm2 in a six well plate, in particular two well
were left in basic culture media and used as a control. The culture conditions tested to stimuli the cells towards an osteogenic lineage were: DMEM HG + glutarmax + 10% FCS + 1% p/s + AsAP 0.1 mM + Dexamethasone 1µM (Sigma) + Indomethacin (Sigma) 0.2 mM + Insuline (Sigma) 0.01 mg/mL + 1-methyl-3-isobutyl-xantine (IBMX, Sigma) 0.5 mM. After three weeks of culture in condition media cells were stained for 20 min with 1-(2,5-dimethyl-4-(2-5-dimethylphenyl) phenyldiazenyl) azonapthalen-2-ol (Oil-Red-O), this compound stain the triglycerides highlighting the presence of lipids storage vacuoles in the plate. Finally cells were carefully washed and resuspend in PBS.
35
Results
Isolation
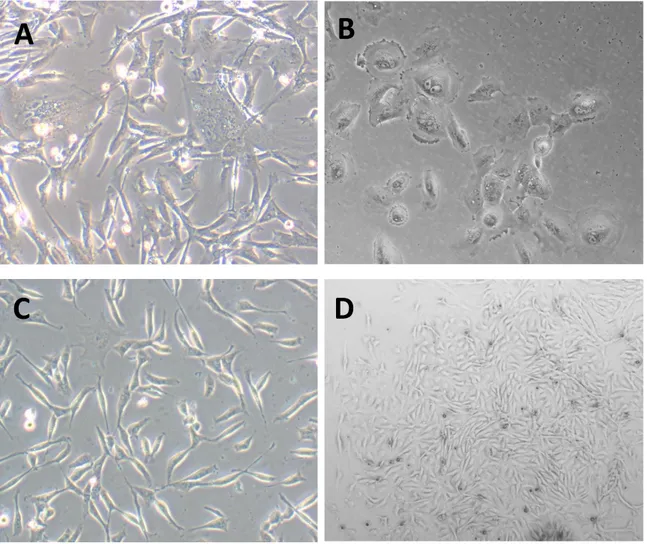
In all isolations irrespective of isolation technique (enzymatic digestion or liver perfusion) colonies appeared within seven days. Examples of the morphology of cells directly after isolation can be found in Figure 14. Between isolation techniques no big differences between the enzymatic digestions solutions tested arose.
Figure 14: Representative pictures of LMSCs during first days of culture. A. Presence of hepatocytes in the plate, red circles, (200x). B. Lymphocytes (100x) C. LMSCs (200x) D. Colony formation of LMSCs (40x).
A
B
36 Figure 15: LMSCs at passage 2 of culture (40x). Cells appear to grow as a homogenous population.
Collagenase T2 enzyme was selected from all the enzymes tested and the protocol was further optimized for the use of this digestion media. The duration of the digestion for a liver biopsy (1.9±0.3g) was optimal after 1 hour. In this fashion LMSCs appear to be enriched in the parenchymal fraction (data not shown). Colonies appeared in one week (Fig. 14-D) and had a fibroblast-like shape and were abundant. On occasion some hepatocytes (Fig. 14-A) and/or macrophages (not shown) were found directly after plating. After the first passage the culture become more uniform and cells show a spindle shape morphology with a small elongated cell body (Fig. 15). The cell body contains a large, round nucleus with prominent nucleolus that, theoretically, indicates high transcriptional activity.
37
Culture
Culture conditions of the canine BMSCs were already optimized previously (Dr. M.A. Tryfonidou, University of Utrecht, Veterinary faculty, department of clinical sciences for companion animals). To determine optimal culture conditions for canine LMSCs multiple media types (Table 4) and additives were tested based on literature on LMSC and BMSC cultures. To exclude an age effect of the cells with the different culture conditions, all conditions were tested on juvenile (n=4) and adult LMSCs (n=8).
Table 4: Culture conditions tested for growth potential of LMSCs. DMEM Dulbecco's Modified Eagle Medium; FCS, Fetal calf serum; bFGF, basic Fibroblast Growth Factor (FGF2); AsAp, ascorbic acid; p/s, penicillamine and streptomicin.
Optimal growth conditions were based on viability and growth potential of the LMSCs with the different culture conditions. Viability was ascertained by a cell viability test (MTT) and growth potential by EdU incorporation quantification. Results of the MTT assay showed the highest viability in culture conditions with the additives basic Fibroblast Growth Factor (bFGF) and ascorbic acid (AsAp) (Fig. 17-17b). Although not significant, the trend indicates that αMEM with these culture additives also was superior to DMEM. No significant differences were seen between juvenile and adult LMSCs.
Growth potential of LMSCs under different culture conditions was determined by EdU incorporation which can be used to determine the percentage of cells in S phase of the cell cycle. Representative examples of the pictures taken by the arrayscan can be seen in Figure 16. Due to a general DNA stain with the fluorescent dye DAPI, the number of “recognized objects” correspond to the number of cells in a single well. The EdU labeled LMSCs in S phase of the cell cycle are separately determined and a percentage of dividing cells is calculated by the arrayscan. Results for the EdU incorporation confirmed that αMEM was the best media type for LMSCs; moreover the percentage of positive cells define the
CONDITIONS (n=6) 1a. DMEM + 10% FCS + p/s
Juvenile
1b. DMEM + 10% FCS + p/s + FGF + AsAp 1c. αMEM + 10% FCS + p/s 1d. αMEM + 10% FCS + p/s + FGF + AsAp 2a. DMEM + 10% FCS + p/sAdult
2b. DMEM + 10% FCS + p/s + FGF + AsAp 2c. αMEM + 10% FCS + p/s 2d. αMEM + 10% FCS + p/s + FGF + AsAp38 conditions with the additives advantaged compared to the ones without. Culture additives increased the amount of EdU positive cells by 5 fold.
Figure 16: Representative pictures of LMSCs from the arrayscan. A. Light microscope picture of the cells, B. DAPI (nuclear) staining (blue) merged with the EdU positive cells (light blue), C. recognized objects by the arrayscan circled in green and the non-accepted objects in red.
Figure 17: Viability and growth potential of LMSCs under different culture conditions. (A) Viability assay with MTT (B) EdU incorporation (C) Number of identified objective (Cell number per well).
39 Figure 17b: Viability and growth potential of LMSCs under different culture conditions. (No age consideration)
Overall, αMEM with 10% FCS, p/s, bFGF, and AsAp was the best condition for both BMSCs and LMSCs. For this reason we decided to base all the characterization comparison using this setting for the culture:
40
Population Doublings LMSCs and BMSCs.
To estimate the replication potential of the LMSCs a population doubling count was performed (See material and methods), here below the graph of cumulative population doublings (PDs) (Fig. 18), on the y-axes the cumulative PDs and on the x-axes the passage number (each passage is counted as 72h of culture).
Figure 18: Cumulative population doublings of LMSCs (n=12), each passage is three days of culture.
Interestingly if we group the samples based on the age, more specifically juveniles individuals (n=4) and adults (> 1 year) (n=8), we can see a significant difference in the replicative potential by which juvenile derived samples appear to have an advantage compared to adult LMSCs with a doubling of on average 2.8±0.98 versus 2.5±0.88 times per passage respectively (Fig. 19).
41 Figure 19: Cumulative population doublings of LMSCs, divided in two groups based on the age of the donor: juvenile (black circles) and adults (white).
BMSCs do not show a similar difference between juvenile and adult samples as founded in the LMSCs group (Fig. 20).
Figure 20: Cumulative population doublings of BMSCs, divided in two groups based on the age of the donor: juvenile (black circles) and adults (white).
42 Figure 21: Cumulative population doubling of LMSCs (Black circles) and BMSCs (White).
In general LMSCs had a higher population doubling compared to BMSCs, with an average population doubling of 2.75±0.74 compared to 2.65±0.8 respectively (Fig. 21).
43
RNA profiling of LMSCs and BMSCs
Here are reported the results obtained comparing LMSCs (n=10) and BMSCs (n=8), data is showed in box-plots so as to be able to look for the variability in each group. An investigation on the stability of the reference genes was performed with Genorm. Results indicated that all the six reference genes were stable and should be included. RNA samples of healthy liver and crude bone marrow were included as controls.
All validated MSCs markers were found to be present in the LMSCs and BMSCs (Fig. 22). In general, no major differences in gene-expressions were found between LMSCs and BMSCs. For both cell types the expression between passages was stable, only CD90 was found to be increased 100 fold from passage 1 to 4 in the BMSCs group whereas for LMSCs it remain stable. CD73 and CD44 expression was lower compared to the other CD markers but were still detectable. Negative selectors (Fig. 23) resulted negative in both the groups, a little level of expression was found only at passage one revealing the presence of different kinds of circulating cells in the culture. For results of the other markers refer to the picture description.
44 Figure 22: qPCR results - Positive markers for MSCs selection. X-axes passages (P0->P4) of culture for both LMSCs (light pink) and BMSCs (Light red), in blue the whole liver and in light blue the bone marrow used as controls. Y-axes relative gene expression (Note: Scale are different in each graph). All the markers presented in this panel result positive in all the groups; in particular comparable levels of expression between LMSCs and BMSCs were found for all the markers; moreover CD73 and CD44 remain detectable in both the cell types even if at a very low level of expression.
45 Figure 23: qPCR results - Negative markers for MSCs selection. Negative markers are used mainly to test the absence of other cells present in the bone marrow that might contaminated the culture. In the first row of graphs CD45 and CD235a are specifically expressed in differentiated hematopoietic cells the first and in erythrocytes the second. CD11b and CD14 are both expressed by macrophages whereas CD19 is a lymphocyte marker. Moreover CD74 (DLAGR) correspond to the invariant chain of the major group of histocompatibility of class II, is known to be negative in undifferentiated MSCs. Overall all this six markers appear to be negative for the samples tested.