Alma Mater Studiorum · Università di Bologna
SCUOLA DI SCIENZE
Corso di Laurea in Astrofisica e Cosmologia Dipartimento di Fisica e Astronomia
IRAS 00183-7111:
ALMA and X-ray view of an
Ultra Luminous Infrared Galaxy
Tesi di Laurea Magistrale
Relatore:
Chiar.mo Prof.
Cristian Vignali
Co-relatore:
Dott.Arturo Mignano
Presentata da:
Ilaria Ruffa
Sessione I
Anno Accademico 2016-2017
This Thesis work was done as part of the research activity of the
Italian ALMA Regional Centre and of the Istituto di
Radioastronomia - Istituto Nazionale di Astrofisica (INAF) in
Bologna.
Ai miei genitori a cui devo tutto e alla Vita che mi ha resa forte come il mare in tempesta e fragile come le foglie d’autunno
Contents
List of Tables 11 List of Figures 13 Sommario 15 Abstract 18 1 Scientific background 21 1.1 Introduction . . . 211.2 Active Galactic Nuclei . . . 21
1.3 Ultra Luminous Infrared Galaxies (ULIRGs) . . . 25
1.3.1 The AGN/starburst components . . . 25
1.3.2 The evolutionary scenario . . . 26
1.4 Source selection: the Spoon diagram . . . 28
1.4.1 The case of IRAS 00183-7111 . . . 30
2 Interferometry: the basics 37 2.1 Introduction . . . 37
2.2 Single-dish response . . . 37
2.2.1 Basic principle of interferometry . . . 40
2.2.2 Interferometer properties . . . 42
2.3 Calibration: an overview . . . 43
2.3.1 The WVR and Tsys corrections . . . 44
2.3.2 Antenna positional errors . . . 46
2.3.3 Bandpass calibration . . . 46
2.3.4 Gain calibration (G) . . . 47
2.3.5 Absolute Flux Density Calibration . . . 47
2.4 Imaging process . . . 47
2.4.1 Self-calibration . . . 49
3 The ALMA era 51 3.1 Introduction . . . 51
3.2 ALMA technical specifications . . . 52
3.2.1 Antennas . . . 53
3.2.2 Front end and ALMA receivers . . . 53
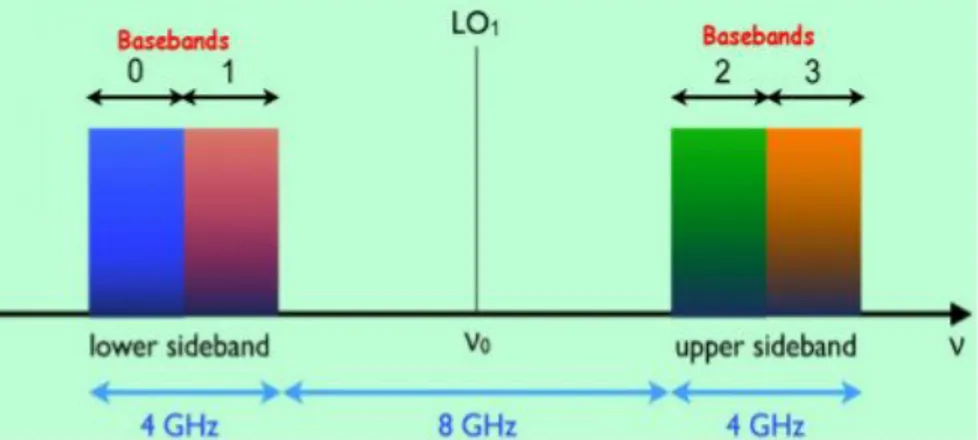
3.2.3 Local oscillators and IF system . . . 53
3.2.4 Back End and Correlators . . . 55
3.3 ALMA Cycle 0 capabilities . . . 55
3.4 ALMA full capabilities . . . 56
3.5 The ALMA archive . . . 57
3.5.1 Data Quality Assessment . . . 59
4 IRAS 00183-7111: reduction of archival ALMA data 61 4.1 Introduction . . . 61
4.1.1 The CASA software . . . 61
4.2 Observations . . . 62
4.2.1 The band 3 data . . . 62
4.2.2 The band 6 data . . . 64
4.3 The calibration workflow . . . 66
4.3.1 Data import, initial inspection and flagging . . . 66
4.3.2 Water Vapour Radiometer (WVR) and System Temperature (Tsys) corrections . . . 67
4.3.3 Model information setting . . . 72
4.3.4 Frequency-dependent calibration . . . 74
4.3.5 Time-dependent calibration . . . 74
4.3.6 Flux density calibration . . . 74
4.3.7 Application of the calibration tables, data examination and further flagging (if necessary) . . . 75
4.4 Imaging . . . 81
4.4.1 The phase calibrator: J2157-694 . . . 81
4.4.2 The Band 3 products . . . 83
4.4.3 The Band 6 products . . . 84
5 ALMA products analysis 87 5.1 Introduction . . . 87
5.2 The CO as molecular gas tracer . . . 87
5.2.1 The molecular gas column density . . . 89
5.2.2 The star formation rate . . . 90
5.2.3 Outflow hint . . . 90
5.3 HCN line detection: the dense molecular gas tracer . . . 92
5.4 Continuum analysis . . . 94
5.4.1 AGN jets or dust? . . . 94
5.4.2 The line-continuum emissions offset . . . 96
6 X-ray data reduction and spectral analysis 99
6.1 Introduction . . . 99
6.2 X-ray astronomy: the basics . . . 99
6.2.1 Chandra . . . 104
6.2.2 XMM-Newton . . . 105
6.2.3 NuSTAR . . . 105
6.3 Chandra data . . . 106
6.3.1 Chandra spectral models . . . 107
6.4 XMM-Newton data . . . 111
6.4.1 XMM-Newton spectral models . . . 111
6.5 NuSTAR data . . . 115
6.5.1 Nustar spectral models . . . 115
6.6 The broad-band fitting . . . 117
6.7 Derived X-ray parameters . . . 118
Summary and Conclusions 122
Bibliography 129
List of Tables
3.1 ALMA Early Science Cycle 0 capabilities . . . 56
3.2 ALMA full array capabilities . . . 56
4.1 Properties of the ALMA Cycle 0 observations used in this work . . 64
4.2 Archival versus this work phase calibrator flux densities and dynamic ranges of the images . . . 82
5.1 ALMA line emission properties. . . 94
5.2 ALMA continuum emission properties . . . 95
6.1 X-ray best-fit parameters obtained using MYTorus model . . . 119
6.2 XMM-Newton, NuSTAR, and broad-band best-fit parameters obtained using Xillver model. . . 119
List of Figures
1.1 Unified Model of the AGN . . . 24
1.2 Ultra Luminous Infrared Galaxies evolutionary sequence . . . 28
1.3 The Spoon diagnostic diagram . . . 30
1.4 Mid-infrared spectra of the Spoon sample . . . 31
1.5 Mid-infrared image of I00183 . . . 32
1.6 Optical image of I00183 . . . 33
1.7 Australian Astronomical Telescope image of I00183 . . . 33
1.8 Mid infrared spectrum of I00183 . . . 34
1.9 VLBI map of I00183 . . . 36
2.1 Antenna Power pattern . . . 38
2.2 One dimensional scheme of a two-antennas interferometer . . . 40
2.3 Example of an uv-plane . . . . 42
3.1 Aerial view of the ALMA site . . . 52
3.2 Atmospheric transmission curve at the ALMA site and ALMA re-ceiver Bands . . . 54
3.3 ALMA IF system . . . 54
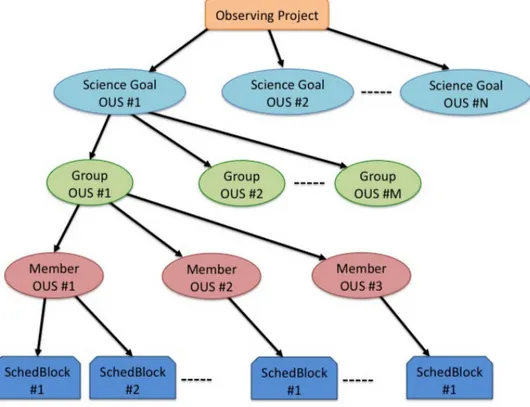
3.4 ALMA archival data structure . . . 57
3.5 ALMA archival data directories structure . . . 58
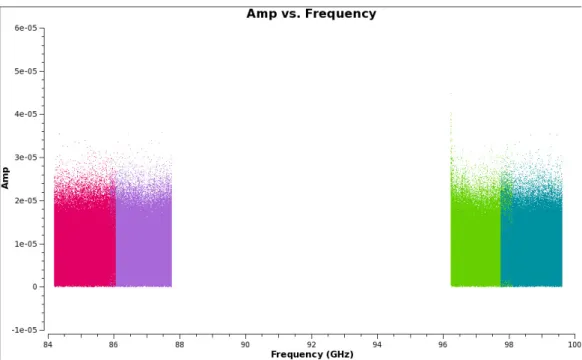
4.1 Band 3 frequency coverage . . . 63
4.2 Band 3 representative antenna configuration . . . 63
4.3 Band 6 representative frequency coverage . . . 65
4.4 Band 6 representative antenna configuration . . . 65
4.5 Data before and after the application of the WVR correction . . . . 68
4.6 Data before and after the application of the WVR correction in Band 3 X230 dataset . . . 69
4.7 Check plot of the Tsys calibration table . . . 70
4.8 Check plots before and after the application of the Tsys correction . 71 4.9 Band 3 atmospheric transmission curve . . . 72
4.10 Callisto new versus old models . . . 73
4.11 Callisto and Neptune model brightness temperature . . . 73
4.13 X1bc calibrated Phase versus Time . . . 77
4.14 X1bc calibrated Amplitude versus Time . . . 78
4.15 X4f calibrated Phase versus Time . . . 78
4.16 Check plots for bandpass calibration of the phase and the flux cali-brators . . . 79
4.17 Corrected Amplitude versus Frequency of the flux calibrator . . . . 79
4.18 QA2 amplitude and phase gains for each antenna . . . 80
4.19 J2157-694 Band 6 and Band 3 check images . . . 81
4.20 J2157-694 Amplitude versus UVdistance plot . . . 82
4.21 I00183 Band 3 continuum self-calibrated image . . . 83
4.22 I00183 Band 3 CO line channel image . . . 84
4.23 I00183 Band 6 continuum images for the two observing groups . . . 85
4.24 I00183 Band 6 HCN channel map . . . 85
5.1 CO moment 0 map . . . 88
5.2 CO moment 2 and 1 maps . . . 91
5.3 CO spectral profiles . . . 92
5.4 Band 6 HCN channel map . . . 93
5.5 Band 6 HCN spectral profile . . . 93
5.6 I00183 Radio/Infrared Spectral Energy Distribution . . . 96
5.7 VLBI versus ALMA maps . . . 97
6.1 Chandra Encircled energy fraction . . . 102
6.2 XMM encircled energy fraction . . . 103
6.3 Nustar effective area compared to the others X-ray observatories . . 106
6.4 Chandra powerlaw and galactic absorption spectral fitting . . . 108
6.5 Chandra phenomenological fitting . . . 108
6.6 Chandra MYTorus spectral modeling . . . 109
6.7 Chandra unfolded spectrum with MYTorus model superimposed . 110 6.8 Chandra line energy versus its normalization contours plot . . . 110
6.9 XMM phenomenological spectral modeling . . . 112
6.10 XMM MYTorus spectral modeling . . . 113
6.11 XMM line energy versus its normalization contours plot . . . 113
6.12 XMM Xillver and Plcabs spectral modeling . . . 115
6.13 Nustar Xillver and Plcabs spectral modeling . . . 117
Sommario
Lo scopo di questo lavoro di Tesi è stato quello di condurre uno studio multi-frequenza della sorgente IRAS 00183-7111 (I00183) a z = 0.327, appartenente alla classe delle galassie ultraluminose nell’infrarosso (Ultra Luminous Infrared Galaxies o ULIRG). L’analisi è stata condotta utilizzando dati nel millimetrico, osservati con l’interferometro ALMA (Atacama Large Millimeter/submillimeter Array), e dati in banda X, con l’obiettivo principale di delineare meglio le caratteristiche della fonte di energia dominante di questa sorgente e verificare se il gas molecolare tracciato dal CO possa essere ritenuto responsabile dell’oscuramento rilevato dalle osservazioni in banda X. I00183 è una delle ULIRG più luminose scoperte dal satellite IRAS, con una luminosità bolometrica dell’ordine di 9 × 10¹² L
, emessa principalmente
nel regime del lontano infrarosso. Quest’ultima è una proprietà tipica delle ULIRG: la loro elevata luminosità viene di solito attribuita a fenomeni di merger tra galassie a spirale ricche di gas, che innesca sia un processo di accrescimento sul buco nero centrale (AGN), sia violenti fenomeni di formazione stellare su scale nucleari ("star-burst"). Dal punto di vista teorico, lo scenario più comunemente accettato è quello secondo cui il pre-esistente buco nero centrale super massiccio accresce materia ad un tasso elevato ed è oscurato da spessi strati di gas e polveri che sono stati convogliati dal merging nelle regioni centrali; successivamente, si possono verificare fenomeni di fuoriuscita di "venti" di materia ad altissima velocità dall’AGN ("quasar wind"), che allontanano il materiale di cui l’AGN è circondato. Questa attività ter-mina quando le riserve di gas delle regioni centrali si esauriscono e la maggior parte del gas rimanente viene esplulso, interrompendo sia l’attività di AGN, sia quella di formazione stellare, e lasciando la galassia evolvere successivamente come un sis-tema passivo. Le ULIRG sono sorgenti molto diffuse, ma la grande quantità di polvere diffusa causa una significativa estinzione del nucleo, rendendo complicato lo studio delle loro regioni più interne e difficile distinguere se la fonte dominante di energia sia attribuibile ad attività da AGN o da formazione stellare.
I00183 è stata selezionata dal diagramma diagnostico di Spoon (Spoon et al. 2007), che mette a confronto gli spettri di un centinaio di galassie luminose nell’infrarosso, confrontando la larghezza equivalente della componente di emissione a 6.2 µm degli Idrocarburi Policiclici Aromatici (PAH) con l’intensità della banda di assorbimento dei silicati centrata a 9.7 µm. Lo studio di queste componenti spettrali costitu-isce uno strumento molto potente per indagare sul relativo contributo energetico
proveniente dalla formazione stellare e/o da AGN nelle ULIRG. Il diagramma di Spoon è suddiviso in nove regioni, che rappresentano le classi in cui gli spettri delle galassie campione sono stati suddivisi. I00183 è stata selezionata dalla regione 3A del diagramma di Spoon, dove sono collocate le sorgenti classificate come forte-mente oscurate, sulla base delle profonde bande di assorbimento dei silicati presenti nei loro spettri. I00183 è situata comunque in una posizione di "confine" all’interno del diagramma di Spoon, trovandosi tra la regione in cui sono collocati i candidati AGN fortemente oscurati e quella popolata dalle galassie classificate come AGN non oscurati. Numerosi studi in diverse bande spettrali sono stati effettuati su questa sorgente, la cui posizione da "outlier" nel diagramma di Spoon sembrerebbe attribuibile alla sua peculiare natura. I00183 ha una luminosità radio a 4.8 GHz dell’ordine di 3 × 1025 W Hz−1, che la classifica come una radio galassia brillante
FRII, ed è stata sttribuita all’ingente attività di accrescimento su un buco nero cen-trale; la detezione dell’AGN risulta ardua a più alta frequenza a causa dell’elevata estinzione causata dalle polveri, legate ad un’intensa attività di formazione stellare (∼ 220 M yr−1), che contribuisce per circa il 14% alla sua luminosità bolometrica.
In base alle caratteristiche osservate, I00183 potrebbe trovarsi nel breve periodo di transizione tra la fase di intensa e dominante attività di formazione stellare in-nescata dal merging, e la fase di accrescimento non oscurato dell’AGN centrale, la cosidetta "quasar-mode accretion".
Al fine di studiare le proprietà sub-millimetriche di I00183, sono state analizzate osservazioni ALMA Ciclo 0 di archivio in Banda 3 (87 GHz) e Banda 6 (270 GHz). È importante sottolineare che il Ciclo 0 di ALMA era prevalentemente una fase di test dello strumento (cosiddetta "Early Science") per cui il riprocessamento dei dati è fortemente consigliato. Il lavoro principale di questa tesi è stato quello di calibrare i dati "grezzi", confrontando poi i risultati ottenuti con quelli presenti in archivio e cercando di apportare un miglioramento.
Le proprietà in banda X di I00183 sono state studiate analizzando osservazioni
Chandra, XMM-Newton e NuSTAR, che consentono una copertura a banda larga
dello spettro in banda X (∼0.5−30 keV). Sono stati utilizzati dati di archivio
Chan-dra e XMM-Newton, con tempi di esposizione effettivi di 22 e 22.2 ks,
rispettiva-mente; la riduzione dei dati è stata condotta utilizzando i software CIAO e SAS, rispettivamente; i 109 ks NuSTAR sono ancora privati e gli spettri ridotti sono stati gentilmente ottenuti dal PI (K. Iwasawa). La dettagliata analisi spettrale è stata condotta utilizzando il software XSPEC e si è svolta cercando di riprodurre la forma spettrale a partire da semplici modelli fenomenologici, introducendo poi modelli analitici più complessi, per tenere conto della fisica dei processi che coin-volgono questa sorgente.
Nel capitolo 1 di questo lavoro di Tesi verrà presentato un quadro generale della problematica scientifica, descrivendo le principali proprietà di I00183 emerse da di-versi lavori. Nel capitolo 2 verranno introdotti i principi di base dell’interferometria, applicata poi a tutto il processo di calibrazione dati. Nel capitolo 3 verrà presentato
lo strumento ALMA, fornendo una breve descrizione delle sue principali caratteris-tiche tecniche e capacità presenti e future. Il capitolo 4 sarà dedicato alla descrizione del processo di calibrazione dei dati ALMA, fino alla presentazione delle immag-ini ottenute. Nel capitolo 5 verranno descritti e discussi i risultati ottenuti dalle osservazioni ALMA. Il capitolo 6 presenterà i risultati derivanti dalla riduzione e analisi spettrale dei dati in banda X, con una piccola introduzione sui principi di base dell’astronomia X e le proprietà dei satelliti di cui sono state usate le os-servazioni. Infine, l’intero lavoro verrà riassunto, ponendo l’accento sui principali risultati ottenuti da questo progetto di tesi e sulle possibili prospettive future.
Abstract
The aim of this Thesis work is to study the multi-frequency properties of the Ultra Luminous Infrared Galaxy (ULIRG) IRAS 00183-7111 at z = 0.327, connecting ALMA sub-mm/mm observations with those at high energies in order to place con-straints on the properties of its central power source and verify whether the gas traced by the CO may be responsible for the obscuration observed in X-rays. IRAS F00183-7111 (I00183, hereafter) is one of the most luminous ULIRGs known: its bolometric luminosity, 9 × 10¹² L
, is mostly radiated in the far-IR. This
prop-erty is typical of ULIRGs: their high luminosity is often attributed to the merger of two gas-rich spirals which triggers both Active Galactic Nuclei (AGN) activity in a pre-existing quiescent black hole and a powerful nuclear starburst. The current theoretical picture suggests that the supermassive black hole at the center of the galaxy grows by accretion while surrounded by thick layers of dust and gas which are then blown away by outflows driven by powerful quasar wind. This activity ceases when the fuel provided to the central regions is exhausted, and most of the remaining gas is expelled, switching off both the AGN and the star-forming activ-ity, and leading to form a passive galaxy. ULIRGs are much more common at high redshift, but the presence of high amounts of dust causes significant extinction to their nuclei, making hard the study of their inner regions and difficult to determine whether their dominant power source is due to AGN or star-formation activity. I00183 was selected from the so-called Spoon diagnostic diagram (Spoon et al. 2007) for mid-infrared spectra of infrared galaxies based on the equivalent width of the 6.2 µm Polycyclic Aromatic Hydrocarbon (PAH) emission feature versus the 9.7 µm silicate strength. Such features are a powerful tool to investigate the contribution of star formation and AGN activity in this class of objects. The diagram is divided into nine region representing the classes in which the galaxy spectra of the sample are distributed. I00183 was selected from the top-left region of the plot where the most obscured sources characterized by a strong Si absorption feature are located. According to its spectral features, I00183 is a peculiar example of an ULIRG whose nucleus is loud at 4.8 GHz (L4.8 GHz = 3×1025W Hz−1) and buried within a dusty
galaxy with a star-formation activity (∼220 M yr−1); it is believed to be in the
brief transition period between merging starburst and ’quasar-mode’ accretion. To link the sub-mm/mm to the X-ray properties of I00183, ALMA archival Cycle 0 data in Band 3 (∼ 87 GHz) and Band 6 (∼ 270 GHz) have been calibrated and
analyzed, using CASA software. ALMA Cycle 0 was the Early Science program for which data reprocessing is strongly suggested. The main work of this Thesis consisted in reprocessing raw data to provide an improvement with respect to the available archival products and results, which were obtained using standard proce-dures.
The high-energy data consists of Chandra, XMM-Newton and NuSTAR obser-vations which provide a broad coverage of the spectrum in the energy range ∼ 0.5 − 30 keV. Chandra and XMM archival data were used, with an exposure time of 22 and 22.2 ks, respectively; their reduction was carried out using CIAO and SAS software. The 100 ks NuSTAR are still private and the spectra were obtained by courtesy of the PI (K. Iwasawa). A detailed spectral analysis was done using XSPEC software; the spectral shape was reproduced starting from simple phenomenological models, and then more physical models were introduced to account for the complex mechanisms that involve this source.
In Chapter 1, an overview of the scientific background will be discussed, with a focus on the target, I00183, and the Spoon diagnostic diagram, from which it was orig-inally selected. In Chapter 2, the basic principles of interferometry will be briefly introduced, with a description of the calibration theory applied to interferometric observations. In Chapter 3, ALMA and its capabilities, both current and future, will be shown, explaining also the complex structure of the ALMA archive. In Chapter 4, the calibration of ALMA data will be presented and discussed, showing also the obtained imaging products. In Chapter 5, the analysis and discussion of the main results obtained from ALMA data will be presented. In Chapter 6, the X-ray observations, data reduction and spectral analysis will be reported, with a brief introduction to the basic principle of X-ray astronomy and the instruments from which the observations were carried out. Finally, the overall work will be sum-marized, with particular emphasis on the main obtained results and the possible future perspective.
Chapter 1
Scientific background
1.1
Introduction
Active Galactic Nuclei (AGN) are one of the most powerful sources of radiation in the Universe. The complex physical processes involving these sources lead them to emit along the whole electromagnetic spectrum, therefore multi-wavelength studies are needed to characterize their overall properties. A complete census of the AGN population, including the most elusive, buried sources, is also required to better understand the observed variety in properties, to "map" their evolution up to high redshift, and shed light on the black holes/host galaxies co-evolution issue. More-over, the detection and the study of the most obscured objects is essential to clarify their contribution to the unresolved X-ray cosmic background. Ultra Luminous Infrared Galaxies (ULIRGs) are a particular class of objects, most of which seem to host obscured accretion, especially the most powerful ones. IRAS 00183-7111 (I00183, hereafter), the target of this Thesis work, is a peculiar and widely stud-ied example within this class of galaxies, and its main properties will be described in this Chapter. Also an overview of the scientific background will be presented, with a focus on AGN and ULIRGs properties, and presenting the so-called Spoon diagnostic diagram, from which I00183 was originally selected. Throughout this work distances and luminosity have been computed assuming a ΛCDM cosmology, where: H0 = 70 km s−1 Mpc−1, ΩM = 0.27 and ΩΛ = 0.73.
1.2
Active Galactic Nuclei
It is widely accepted that almost every galaxy hosts a Super-Massive Black Hole (SMBH, 106−109 M
) in its nuclear regions, but only a fraction of them (∼ 10%)
have an active one. A SMBH is called "active" when emits radiation through a grav-itational process in which the material of a surrounding accretion disk falls into the BH and is converted in energy; since this process produces a huge amount of energy
(1042−1048 erg s−1) in small volumes (1−2 pc1), it is considered one of the most
powerful engines in the Universe, providing a significant contribution to the energy radiated over cosmic times. Galaxies which host an active SMBH are called Active Galactic Nuclei (AGN), and are divided into two major categories, on the basis of their optical spectral properties: Type 1 and Type 2. Type 1 are unobscured objects which show both narrow and broad emission lines in their optical spectra, and a strong optical/UV continuum; Type 2 are obscured AGN, which show only narrow emission lines and a suppressed continuum. In the X-ray domain the main difference between the two categories is the progressive suppression of the primary power-law emission from Type 1 to Type 2 and the limited presence of nuclear emis-sion in the soft-band (below 2 keV) in the most obscured objects. Moreover, highly obscured AGN have Fe Kα emission line with large equivalent width (≥ 1 keV) and intrinsic NH column density larger than 1024 cm−2; such kind of objects are called
Compton-thick AGN (NH >1 × 1024cm−2). Historically, different AGN types were
brought into a single framework by the standard Unified Model (e.g. Antonucci 1993, Urry & Padovani 1995, Veilleux 2003 and references therein), according to which Type 1 and Type 2 objects belong to the same category and the observed spectral differences result from different viewing angles: Type 1 AGN are nearly face-on objects, and the nucleus can be directly seen; Type 2 AGN have larger viewing angles, thus the line of sight intercepts the obscuring medium surrounding the nucleus; when the AGN is seen completely face-on assumes a star-like visual appearance and is called Quasar (Quasi-stellar Object, also known as QSO), whose optical spectrum is characterized by a strong continuum and very broad emission lines. A schematic picture of the Unified model is shown in figure 1.1. In this scenario, the central SMBH is surrounded by an accretion disk of infalling material on scales down to a few gravitational radii; it involves spatial scales of the order of ∼ 10−3 pc. The gravitational radius is usually defined as R
g =
GMBH
c2 , where
where G is the gravitational constant, MBH is the black hole mass and c is the
speed of light. Typically, Rg = 1/2Rs, where Rs is the Schwarzschild radius; it is
defined as the radius of a sphere such that, if all the mass of an object is compressed within that sphere, the escape speed from its surface would equal the speed of light. A black hole is an example of an object smaller than its Schwarzschild radius. The accretion disk is, in turn, surrounded by a dusty torus whose typical extension are
r ∼ 1−100 pc from the nucleus. Clouds of gas also extend from the central regions,
and they are divided into the closer and denser Broad Line Regions (r ∼ 0.01 − 0.1 pc) and the farther and rarefied Narrow Line Regions (r ∼ 100 − 1000 pc). Under some physical conditions, AGN can produce an outflow of magnetically-confined relativistic particles, i.e. the jets, which are the source of the radio synchrotron emission. The AGN are generally classified as radio-loud when the ratio between the radio (5 GHz) and optical (4400 Å) emission is > 10, they are considered
quiet, otherwise (Kellermann 1989).
One of the most important issues in modern astrophysics is the connection between the growth of SMBHs and their host galaxies, the so-called "co-evolution" (e.g. Kor-mendy & Ho 2013, for a review). Since its discovery, many efforts had been made to understand the origin of the tight correlation between the SMBH mass and the ve-locity dispersion (or the bulge stellar mass) in nearby galaxies (e.g. Kormendy 1995, Magorrian et al. 1998, Ferrarese et al. 2000). Important observational evidences about the mutual interplay were found in the last years, showing, for example, that the energetic output of an accreting SMBH can significantly affect its surround-ing environment: the AGN feedback is considered as a more effective mechanism of quenching gas cooling and star formation (e.g. Somervile et al. 2008, Fabian 2012). In order to better constrain this scenario and understand the effective role of SMBHs in the context of galaxy formation and evolution, a complete survey of the AGN population is required, with particular attention to the search and the study of the most elusive ones. The obscured accretion phase is a crucial step in the AGN and co-evolution scenario, since much of the SMBH mass growth occurs during this phase (e.g. Hopkins et al. 2005, Treister et al. 2010). A complete census of the most obscured objects is also needed to better understand their contribution to the unresolved X-ray cosmic background (e.g. Maiolino et al. 2003, Gilli et al. 2007).
In the heavily obscured objects, the absorbed optical to soft X-ray primary radia-tion is reprocessed by the obscuring medium and re-emitted at longer wavelengths, driving a significant luminosity in the infrared regime (e.g. Nardini & Risaliti 2011). The intense infrared emission from the hot dust layers exposed directly to the central engine enables the detection of heavily obscured AGN components that are missed at others wavelengths. A significant fraction of heavily obscured AGN candidates seem to be harbored in the so-called Ultra Luminous Infrared Galaxies (ULIRGs), that are considered unique laboratories to place constraints on the properties of the most obscured sources.
Figure 1.1: Unified Model of the AGN adapted from Urry & Padovani (1995). In this framework, the central SMBH is surrounded by an accretion disk of infalling material on scales of the order of ∼ 10−3 pc. The accretion disk is, in turn, surrounded by a dusty torus whose typical extension are r ∼ 1 − 100 pc from the nucleus. Clouds of gas also extend from the central regions, and they are divided into the closer and denser Broad Line Regions (r ∼ 0.01 − 0.1 pc) and the farther and rarefied Narrow Line Regions (r ∼ 100 − 1000 pc). The differences observed in their optical spectra are attributed to different viewing angles: Type 1 (i.e. unobscured AGN) are nearly face-on objects, and the nucleus can be directly seen; Type 2 (i.e. obscured AGN) have larger viewing angles, thus the line of sight intercepts the obscuring medium surrounding the nucleus. When an AGN is seen completely face-on is called quasar.
1.3
Ultra Luminous Infrared Galaxies (ULIRGs)
The Ultra Luminous Infrared Galaxies are a class of galaxies historically defined in terms of their huge infrared luminosity L8−1000µm>1012L (e.g. Sanders & Mirabel
1996). They were discovered by the Infrared Astronomical Satellite2(IRAS) in 1983,
and were found to be more numerous at z > 1 than locally; these distant ULIRGs may signpost the obscured phases of very dramatic events suspected of building the most massive galaxies seen in the local Universe (e.g. Lonsdale et al. 2006, for a review).
1.3.1
The AGN/starburst components
It is now well established that the hidden source of the primary radiation field inside ULIRGs is a combination of extremely starburst activity (i.e. a star forming event with a gas exhaustion timescale very short compared to the Hubble time) and highly obscured accretion (e.g. Genzel et al. 1998). The distinction between the two power sources is very difficult due to the high dust extinction of their nuclei, which leads to a substantial obscuration even in the mid-infrared and X-ray regimes. Despite this, several spectroscopic signatures of starburst and/or AGN activity can be identified: line strengths, ratios and spectral shapes can provide powerful constraints on the nature of the source of excitation (Lonsdale et al. 2006); thus, it is now clear that the complexity of the involved phenomena require a multi-wavelength approach. Genzel et al. (1998) demonstrated that it is possible to separate AGN from starburst power by comparing the strength of the 7.7 µm PAH equivalent width to high/low excitation line ratios such as 25.9 µm [O IV]/12.8 µm [Ne II]. PAH molecules will be destroyed by high-intensity AGN radiation fields, so low PAH/continuum ratio should correlate with strong [OIV]/[NeII] ratios; however, dense nuclear environ-ments can hide AGN activity even at mid-infrared wavelengths. Also the mid-IR continuum shape can be a powerful diagnostic itself, since the peak of the thermal dust emission is strongly dependent on the heating mechanism: ∼ 20 µm in the close vicinity of an AGN, ∼ 100 µm in star-forming regions. On the basis of their 25/60 and 60/100 µm infrared flux ratios, ULIRGs are found to fall into two general classes: "cool" systems, which show low 25/60 and 60/100 µm infrared flux ratios, are considered dominated by star formation, while "warm" systems, with higher in-frared flux ratios, are usually assumed to be AGN-dominated (Surace et al. 1998). Warm ULIRGs tend to have optical spectral features typical of unobscured AGN, while cool ones have starburst or Type 2-AGN optical spectra.
The studies of the molecular gas, primarily traced by CO and HCN, demonstrated that ULIRGs host huge amounts (≥ 1010 M
) of cool gas in their central regions,
2The Infrared Astronomical Satellite (IRAS) was the first-ever space observatory to perform
an all-sky survey at infrared wavelengths. It was launched in January 25, 1983 and the mission lasted ten months.
concentrated into a radius of r ≤ 0.5 − 1 kpc, and with densities of 104 cm−3 (e.g.
Downes & Solomon 1998). Particularly, the HCN molecule is a tracer of warmer (60−90 K) and denser (105 −107 cm−3) gas, and Gao & Solomon (2004)
demon-strated that ULIRGs have a much higher HCN to CO luminosity ratio with respect to quiescent spirals like the Milky Way.
However, in the last years, many efforts have been directed to disentangle the AGN and starburst components in ULIRGs (e.g. Veilleux et al. 2002, Franceschini et al. 2003, Farrah et al. 2006, Imanishi et al. 2010). Most of these works represent sys-tematic studies of large nearby samples of ULIRGs, observed in radio, mid-infrared, and X-ray regimes, with the primary aim to estimate the AGN contribution. The observed properties seems to be in agreement from each other, converging in some fundamental points:
• The majority of ULIRGs have optical spectra reminiscent of starburst, but with an increase in the fraction of ULIRGs with Type 1 or 2 AGN spectra with increasing IR luminosity; however, most of the ULIRGs with AGN spectral features also show evidence for ongoing or recent star formation;
• The hard X-ray luminosity (2−10 keV) associated with the AGN in ULIRGs is systematically below (< 1042−1043erg s−1) from that expected for a local QSO
of the same infrared luminosity; furthermore, many ULIRGs X-ray spectra show an excess of emission below 2 keV, which can be, in most cases, associated to thermal emission with kT∼0.7 keV, related to the starburst activity; • From a combination of mid-IR and X-ray spectral analysis, it was found that
the environment surrounding the AGN component in ULIRGs is much richer in gas and dust than in ordinary active galaxies, and the degree of absorption can be directly related to the starburst intensity, indicating a strong interac-tion between the two processes.
Therefore, these studies are fundamental not only to understand the nature of local ULIRGs, but also to place constraints on the interplay and mutual feedback between star formation and BH accretion, which are basic ingredients of galaxy formation and evolution (e.g. Zheng 2013).
1.3.2
The evolutionary scenario
According to the multi-wavelength observed properties, the most popular scenario suggests that ULIRGs are triggered by major merger events between gas-rich galax-ies which channeled very large masses of gas and dust into the few hundred parsecs of their central regions (e.g. Sanders & Mirabel 1996, Veilleux et al. 2002). For this reason, ULIRGs are placed in an evolutionary sequence (fig. 1.2) in which the major galaxy mergers first result in a massive cool starburst-dominated ULIRG, followed by a warm ULIRG as the QSO turns on and heats the surrounding dust
layers; finally, the QSO emerges in an optically bright phase when it blows away the surrounding material, quenching both star forming and AGN activity, and the resulting stellar system evolves as a passive spheroid (e.g. Lipari et al. 2003, Hop-kins et al. 2008). This picture provides supporting evidence to the co-evolution framework, but is in contrast with the Unified Model scenario described above, for which an optically bright QSO viewed not completely face-on would appear as a ULIRG; both scenarios, however, predict close relationship between starburst and AGN.
The evolutionary sequence is supported theoretically by works reporting high res-olution hydrodynamic simulations of major mergers (e.g. Di Matteo et al. 2005, Hopkins et al. 2005); these studies predict highest accretion rates at late merger stages, when the mass of the SMBH rapidly grows, followed by the most luminous optically bright QSO phase. The period of high obscuration would correspond to an obscured QSO, i.e. an AGN-powered ULIRG, while the bulk of the starburst activity occurs in the earlier merger stages (Hopkins et al. 2005).
Observationally, optical imaging from the Hubble Space Telescope (HST) offered enhanced resolution to analyze the morphology of these objects. An early HST study presented by Surace et al. (1998) was focused on a small sample of ULIRGs with "warm" infrared colors (f25/f60>0.2, with f25and f60as the 25 µm and 60 µm
IRAS fluxes, respectively); this study indicates that all of the sample show signs of interaction, with complex structures in their nuclear regions. Several systems showed a large number of compact bright "knots" a few hundred parsecs in diameter, whose ages suggest they result from the merger. Complementary, a ground-based survey of ULIRGs with "cool" infrared colors (Surace et al. 2000) found a similar picture: all the galaxies shows sign of interactions, from early to late stage, and many systems harbor "knots" similar to those seen in the warm sample. The opti-cal magnitudes are, in most cases, relatively modest, compared to their enormous infrared luminosity. A later HST survey of an unbiased sample of ULIRGs (both "cool" and "warm" systems) conducted by Farrah et al. (2001), found also similar results. As a consequence, ULIRGs are expected to evolve into passive spheroidal systems as the galaxy mergers that appears to trigger their activity progresses (e.g. Dasyra et al. 2006).
According to this picture, a significant fraction of heavily obscured AGN is harbored in ULIRG at late merger stages. The study of elusive AGN hosted in these systems is a proper way to provide new clues in the proposed evolutionary scenario. For this reason, adopting a multi-wavelength approach and, in particular, using the best data currently available, is the best strategy to shed light on the open AGN/ULIRG issue.
Figure 1.2: A schematic picture of the ULIRG evolutionary sequence adapted from Alexander & Hickox (2012). According to this scenario, ULIRGs are triggered by major mergers between gas-rich galaxies, fueling both violent starburst events and buried AGN activity. The QSO gradually turns on inside the nuclear regions and heats the surrounding dust; finally, the QSO becomes optically bright and powerful quasar winds blow away the surrounding layers of gas and dust. When the fuel provided to the central regions is exhausted, these activities cease and the galaxy evolves as a passive spheroidal system.
1.4
Source selection: the Spoon diagram
Since the discovery of ULIRGs, several diagnostic diagrams have been proposed to establish whether their huge luminosity can be attributed to starburst and/or AGN activity. I00183 was selected from the so-called Spoon mid-infrared diagnostic diagram (Spoon et al. 2007), which introduced the strength of the 9.7 µm silicate absorption feature as a tool to distinguish between different ULIRG populations. The Spoon diagram is mostly based on the observations which were carried out by the Infrared Spectrograph (IRS) aboard the Spitzer Space Telescope3 and the
Short Wavelength Spectrometer (SWS) on board the Infrared Space Observatory4
(ISO). The sample comprises ∼ 100 ULIRGs in the redshift range 0.02 < z < 0.93, which is compared to samples of AGN and starburst templates from others IRS programs. Archival ISO SWS spectra of starburst nuclei were used. For all the spectra of the sample, Spoon et al. measured the equivalent width (EW) of the 6.2 µm Polycyclic Aromatic Hydrocarbon (PAH) emission feature as well as the strength of the 9.7 µm silicate absorption feature, and plotted the two quantities into the diagnostic diagram shown in figure 1.3. The flux in the 6.2 µm PAH emission band is measured by integrating the flux above an interpolated local continuum from 5.95 to 6.55 µm; the EW of the PAH is then obtained dividing the integrated PAH flux by the interpolated continuum flux density. The strength of the 9.7 µm silicate
3The NASA’s Spitzer Space Telescope (SST) is an infrared space observatory launched in
2003. The satellite contains three instruments that allow it to perform astronomical imaging and photometry from 3.6 to 160 micrometers, spectroscopy from 5.2 to 38 micrometers, and spectrophotometry from 5 to 100 micrometers.
4The ESA’s Infrared Space Observatory (ISO) was the world’s first true orbiting infrared
observatory, which was launched in November 1995 and lasted until April 1998. The instruments aboard ISO covered wavelengths from 2.5 to around 240 microns with spatial resolutions ranging from 1.5 arcsec (at the shortest wavelengths) to 90 arcsec (at the longer wavelengths).
feature is computed by adopting a local continuum and evaluating the ratio of the observed flux density (fobs) to continuum flux density (fcont) at 9.7 µm; consequently,
the silicate strength parameter can be defined as:
Ssil = ln
fobs(9.7 µm)
fcont(9.7 µm)
(1.1)
For sources with silicate absorption features, Ssil assumes a negative value that can
be interpreted as the negative of the apparent silicate optical depth.
The observed galaxy spectra are classified into nine different classes on the basis of their 6.2 µm PAH EW and 9.7 µm silicate strength; the average mid-infrared spectra for the eight populated classes (class 3C is not populated) are shown in figure 1.4. The classes 1A and 1B spectra are dominated by a hot dust contin-uum, but the class 1B differs from the class 1A spectrum by clearly showing the PAH emission features; such features become dominant in the class 1C spectrum. The EW of the PAH emission lines progressively decrease from the class 2C to 3B spectrum, and they are absent or very weak in the class 3A spectrum. Con-versely, the silicate absorption features show an increasing depth from the 2C to the 3A spectra, where they become dominant; another noticeable feature from the class 2C to the 3A spectra is the progressive steepening of the 20−30 µm con-tinuum. On the basis of their observed differences, the mid-infrared spectra were divided into three main groups: continuum-dominated spectra (classes 1A and 1B), PAH-dominated spectra (classes 1C and 2C), and absorption-dominated spectra (classes 3B, 3A and 2A). I00183 was selected from the 3A region of the diagram (black circle in fig. 1.3), showing in its mid-infrared spectrum strong silicate absorp-tion features (Ssil = −2.9) and very low PAH 6.2 µm EW. As already explained,
PAH molecules are destroyed by high-intensity AGN radiation fields, thus low or absent PAH features would reasonably indicate the presence of an intense AGN activity, and strong silicate absorption features suggest the presence of a dense nuclear environment. Therefore, these spectral characteristics are consistent with an heavily obscured AGN origin. Moreover, galaxies are not distributed randomly through the Spoon diagram; they appear to be distributed along two branches: one extending horizontally from the AGN-heated hot dust-dominated spectra (unob-scured nuclei, class 1A) to the prototypical starburst-dominated nuclei (class 1C); the other branch extending diagonally from the deeply obscured nuclei of the 3A region to the starburst-dominated nuclei. Galaxies along the horizontal branch may be thought as combinations of AGN and starburst activity, while those along the diagonal branch may be thought as intermediate stages in between a fully obscured galactic nucleus (3A class) and an unobscured nuclear starburst (1C class). The black curved arrow in figure 1.3 indicates that a class 3A galaxy can be turned into a class 2A galaxy by adding a featureless hot dust continuum to the 3A absorbed continuum spectrum. The distribution of ULIRGs spectra along the full length of the horizontal and diagonal branches illustrates the diverse nature of the ULIRG
family, and seems to be coherent with an evolutionary scenario: the interaction may start with nuclei classified as starburst, which then gradually move up the diagonal branch as more dust is accumulated on the remnant nuclei and then the sources evolve from here, once the obscuring screen "breaks up" and the hidden nuclear engine is revealed (from 3A to 1A classes).
Figure 1.3: Spoon diagnostic plot of the equivalent width of the 6.2 µm PAH emission feature versus the 9.7 µm silicate strength, adapted from Spoon et al. (2007). Upper and lower limits are denoted by arrows. The galaxy spectra are classified into nine classes, identified by the gray rectangles, based on their position in this plot. Different colors are used to distinguish between the nine classes. The two dotted black lines are mixing lines between the spectrum of the deeply obscured and the starburst nuclei. The different plotting symbols are used to distinguish between different galaxy types: filled circles, filled triangles, filled squares, and filled diamonds refer to ULIRGs and HyLIRGs, starburst galaxies, Seyfert galaxies and QSOs, and other infrared galaxies, respectively. The black circle highlights the position of IRAS 00183-7111 (the target of this work).
1.4.1
The case of IRAS 00183-7111
I00183 is at z = 0.3276 (Roy & Norris 1997) and is one of the most luminous ULIRGs discovered by IRAS: it has a bolometric luminosity of 9 × 10¹² L
(Spoon
et al. 2009), most of which is radiated at far-infrared wavelengths. I00183 has been
optically classified as a type-2 Seyfert galaxy by Armus et al. (1989), but multi-frequency studies of this source reveal its peculiar nature.
Figure 1.4: Average mid-infrared spectra for the eight populated classes of the Spoon diagram, adapted from Spoon et al. (2007). The gray shading represents the 1σ dispersion range. Spectra at the bottom of the figure are dominated by hot dust emission (classes 1A and 1B), spectra in the middle by PAH emission (classes 1C and 2C), while spectra toward the top by absorption features (classes 3B, 3A, and 2A).
revealed a disturbed morphology and a single nucleus, and long-slit spectroscopy (Drake et al. 2004, fig. 1.6) shows bright, highly-disturbed, ionized gas extending 50 kpc east and 10 kpc west of the nucleus. Recently, Norris et al. (2013) presented a R+I band image of I00183 obtained with the Australian Astronomical Telescope (AAT) in June 2012; this image (fig. 1.7) shows what appear to be tidal tails, or remnants from a recent merger. However, they argued that the many magnitudes of extinction that affect the nucleus (AV ≥90), even at near-infrared wavelengths,
indicate that these image may be showing the outer shells of the galaxy, rather than the nucleus (Norris et al. 2013).
Figure 1.5: ISO mid-infrared (2.5-11.6 µm) image of I00183, adapted from Rigopoulou et al. (1999). The image shows a disturbed morphology and a single nucleus. The angular scale on the sky is indicated by the bar, which represent 10 kpc.
Nuclear outflows of high-velocity ionized gas traced by the 12.81 µm [NeII] and 15.51 µm [NeIII] emission lines were observed by Spoon et al. (2009). Line pro-files are clearly asymmetric and strongly blueshifted, with FWHM of the order of ∼ 3000 km s−1. They have found unusual excitation conditions in I00183, by
comparing the ratio between the combined [NeII] and [NeIII] luminosity and the combined 6.2 and 11.2 µm PAH luminosity for a sample of 56 ULIRGs: if pre-dominantly excited in star forming regions, the PAH luminosity should track the low-ionization neon emission line luminosity to within a factor two (Farrah et al. 2007). I00183 appears to be at least 8 time over-luminous in the neon lines com-pared to the PAH luminosity with respect to the average ratio for low-excitation ULIRGs (∼ 0.4), thus they argued that the neon line ratios are consistent with an origin in fast shocks (v > 500 km s−1) in an environment with gas densities
n > 10 cm−3: Spoon et al. (2009) placed I00183 in an evolutionary scenario in
which the strongly blueshifted [NeII] and [NeIII] emission from shock may trace the (partial) disruption of the obscuring medium around a buried AGN.
The entire 4−27 µm Spitzer Infrared Spectrograph (IRS) spectrum of I00183 has been presented and discussed by Spoon et al. (2004, fig. 1.8). The spectrum is
Figure 1.6: Grey scale R-band image of I00183, adapted from Drake et al. (2004). The overlaid contours highlight the low surface brightness structure. The image has dimensions of 150 kpc×150 kpc. Thick marks indicate intervals of 10 arcsec. North and east directions are indicated by arrows. The surface brightness of the lowest contour in magnitudes per square arcsec is given in the bottom right corner of the image, and contours are separated by 1 mag arcsec−2.
Figure 1.7: Uncalibrated R+I image of IRAS 00183-7111, adapted from Norris et al. (2013). The image was taken with the Australian Astronomical Telescope (AAT) in June 2012. The entire disturbed galaxy has a total extent of about 15 arcsec, which correspond to ∼ 70 kpc at the galaxy redshift (z = 0.327).
dominated by broad and overlapping absorption features, but also emission features have been detected in the 9.5-13 µm range. Particularly, they detected the 4.7 µm broad absorption feature of the CO, from which a column density of ∼ 1019.5 cm−2
was derived, and a gas temperature of 720 K. Beyond 8 µm, the spectrum shows the strong absorption silicate bands. Also the presence of 11.2 PAH and the 12.7-12.8 µm blend of PAH and [NeII] is inferred from the spectrum; their presence in the center of the optically thick 9.7 µm silicate band suggest an origin away from the absorbing medium. From the strength of the 11.2 µm PAH feature, they evaluated that the starburst activity has to contribute of at least 30% to the bolometric lumi-nosity of the source. Spoon et al. suggest an exotic picture to explain the 4−27 µm spectral properties of I00183: the central dominant power source of I00183 seems to be deeply buried behind two obscuring shells. The inner shell is composed of a warm and dense gas with temperatures of ∼ 720 K and n > 3 × 106 cm−3 that give
rise to the CO absorption bands; the outer and colder shell is responsible for the absorption features of ice and silicates, and from the depth of the 9.7 µm features; the column density of the outer shell was evaluated to at least 1023 cm−2. By
plac-ing their results in the diagram based on the 6.2 µm PAH and L(F IR) ratio, they
argued that the IR spectrum of I00183 shows both signatures of AGN-like hot dust continuum and deeply obscured source (Spoon et al. 2004).
The presence of cold and dense molecular gas in the central regions of the galaxy
Figure 1.8: IRS low-resolution spectrum of IRAS 00183-7111 adapted from Spoon et al. 2004. The spectrum is dominated by strong silicate absorption bands at 9.7 and 18 µm with weaker absorption bands due to CO2, CO, water ice, and hydrocarbons in
the 4-7.5 µm range. Weak emission features of PAHs and [NeII] are detected at 11.2 and 12.8 µm, respectively. The dotted line shows the interpolated continuum.
was also indicated by weak (∼ 3σ) ALMA detections of HCN, HCO+ and HNC
emission lines at ∼ 1 mm (Imanishi & Nakanishi 2014); the detections were too weak to infer strong conclusions, but it is important to note that enhanced HCN emission is typical in AGN-dominated ULIRGs (Imanishi et al. 2009). Even if its IR spectrum lacks the 7.65 µm [NeIV] and 24.3/14.3 µm [NeV] lines, which are distinctive features observed in AGN spectra (Spoon et al. 2009), I00183 has been
overall classified as a peculiar example of an extremely obscured AGN. The differ-ences from a classical AGN template spectrum at optical and infrared wavelengths are attributed to the dense dust layers surrounding it (Tran et al. 2011).
Radio observations are generally unaffected by the heavy dust obscuration that blocks the view at shorter wavelengths and allow to see directly the nucleus. Its radio luminosity of ∼ 1025.4 W Hz−1 at 4.8 GHz indicates that it is significantly
more radio-luminous than expected from its FIR emission; such radio-excess places it within the regime of high luminosity (FRII-class) radio galaxy (Roy & Norris 1997). Very Long Baseline Interferometry (VLBI) observations of I00183 presented by Norris et al. (2012), reveal the presence of a compact core-jet AGN with a double-lobed morphology and compact jets only 1.7 kpc long (fig. 1.9). More re-cently, Mao et al. (2014) presented an ATCA CO(1−0) detection which was used to
estimate a mass of molecular gas in I00183 of 2.4 × 10¹⁰ M
; such gas mass is
asso-ciated to a vigorous starburst with a SFR of ∼ 220 M yr−1. They also estimated
the relative contributions of star-formation and AGN to the total power of I00183, arguing that observations of molecular gas can be considered a powerful tool to show how the AGN is interacting with its host star-forming galaxy, because they are unaffected by the presence of AGN; they assert that only ∼ 14% of the total power of the source is contributed by star-formation, which is a further indication that I00183 is predominately powered by the AGN (Mao et al. 2014).
The presence of a powerful AGN was also confirmed by the detection of a 6.7 keV FeK line (Fe XXV) with a large equivalent width (∼ 1 keV) indicative of reflected light from an heavily obscured object, with a hard X-ray luminosity in the 2−10 keV energy range of 2 × 1044 erg s−1 (Nandra & Iwasawa 2007).
All these results seems to be in agreement in placing I00183 in an evolutionary scenario which is consistent with the initial stage of the formation of a quasar, with powerful radio jets still confined by the gas from the galaxy that merged to form this system: I00183 appears to have been caught in the brief transition period as the radio-loud AGN switches on in the center and starts boring its way through the dense gas and dust (Norris et al. 2013). This picture could also explain the out-lying location of I00183 in the mid-infrared Spoon diagnostic diagram (fig. 1.3): it lies between the two branches which separate deeply buried nuclei and unobscured AGN source, thus it may truly be an AGN in the process of disrupting its fully covering medium before settling on the AGN branch.
The aim of this work is to connect the sub-millimeter properties of I00183 with those at high energies, and one of the main goals is to investigate about the molecular gas (traced by the CO) contribution to the line-of-sight column density observed in the X-ray band.
Figure 1.9: The VLBI 2.3 GHz image of I00183, taken from Norris et al. (2012). The peak surface brightness is 45 mJy beam−1. The entire radio source is just over 1 kpc in extent.
Chapter 2
Interferometry: the basics
2.1
Introduction
The signal detection in the millimeter/radio regime is based on revealing the electric field of an incoming electromagnetic wave to obtain a picture of the sky. The measured astronomical signal is convolved with the response of the instrument and corrupted by several factors such as atmospheric turbulence and opacity. In millimeter/radio astronomy, the purpose is to "clean" the detected signal from all spurious features and to obtain images which describe as much as possible the real sky brightness distribution. In order to achieve this goal, it is important to have a good knowledge of the principles at the basis of the interferometric technique and the instruments used for detection, as well as of the theory of the calibration process.
In this chapter the basics of the interferometric theory and its parameters will be presented. In the second part, the calibration theory will be described, followed by the description of the imaging process.
2.2
Single-dish response
The signal detection in millimeter/radio astronomy is based on the principles of the Fraunhofer diffraction theory: under the approximation of a point-like source at infinity, the incident light is a plane and parallel waves front and its electric field distribution at the aperture forms a diffraction pattern on the focal plane; the Fourier transform of such power distribution is called power pattern (beam) and represents the response of the instrument to the incoming signal. The instrument consists of a parabolic aperture (i.e. antenna) which reflects the incident electro-magnetic (EM) power and bring it on the focal plane, where the receiver is placed. The antenna power pattern is shown in figure 2.1. The cental gaussian-like feature is called the mainlobe and its Half Power Beam Width (HPBW) is ∼ λ/D where D is the antenna diameter (i.e. the aperture width). The 1D cross-section of the
Figure 2.1: Normalized 1-D antenna power pattern for an uniformly illuminated antenna. The power is in log units. The HPBW of the main lobe is ∼ 1.02λ/D and the FWBN is ∼ 2.44λ/D. The angle of the first null, i.e. the resolution is ∼ 1.22λ/D
power pattern clearly shows that the constructive and destructive interference at increasing off-axis angles leads to a series of secondary lobes (sidelobes), that de-crease with increasing off-axis angle. The angular distance between nulls is named the Full Width Between Nulls (FWBN) and it is given by 2.44 λ/D; half of the FWBN is considered the resolution of the antenna, i.e. the ability to distinguish between objects on the sky separated by a certain angular distance. The antenna power pattern can be altered by several factors such as surface imperfection1. The
ALMA feedhorns (i.e. the receivers) has been designed to provide an antenna power pattern which is nearly Gaussian with low sidelobes, in order to improve resolution and sensitivity (meant as the sum of the electromagnetic power brought to the fo-cus); actually the measured ALMA 12-m antenna HPBW is ∼ 1.13 λ/D.
Defining θ and ϕ as orthogonal directional variable, it is possible to define Iν(θ, ϕ)
as the directional function of the sky brightness distribution and PN(θ, ϕ) as the
normalized antenna power pattern (i.e. the power pattern divided by its value in the main lobe); the power measured by a receiver can be written as:
Prec = 1
2Ae
Z
4π
Iν(θ, ϕ)PN(θ, ϕ)dΩ (2.1)
1Irregularities on the reflecting surface lead to a signal loss: the radiation which falls into a
surface hole will be reflected later to the focus leading to a phase delay which can reduce the coherence of the incoming radiation and lead to a decreasing measured power. The tolerance on the surface imperfections depends by the observing frequency; in the case of ALMA short wavelengths it is nearly to λ/16
where 1/2 derives from the fact that a receiver is generally sensitive to only one mode of polarization2. A
e is the effective area of the antenna, i.e. the effective
antenna area available for reflecting the incoming electromagnetic waves and it is usually less than the geometric area (πr2). Their ratio gives the aperture efficiency:
ηA=
Aef f
Ageom (2.2)
which is always ≤1. ALMA’s 12-m antennas have an aperture efficiency of ∼ 70%. The solid angle of the antenna power response can be found as:
ΩA=
Z Z
4π
PN(θ, ϕ)dΩ (2.3)
which can be used in first approximation to compute a relation between the received (Sr) and the emitted (Se) flux, as a function of frequency (ν):
Sr(ν) = Se(ν)ΩA (2.4)
If the integral in eq. 2.3 is computed over the main lobe of the power pattern, it gives the solid angle of the main lobe:
ΩM =
Z Z
mainlobe
Pnorm(θ, ϕ)dΩ (2.5)
The directions from which an antenna can collect signal are limited by its shape so that it cannot be considered an isotropic receiver (i.e. receives flux from angles smaller than 4π); in this sense it is possible to define the directivity D of a single-dish as:
D= 4π
ΩA
(2.6) The monochromatic received power can be written as:
W(ν) = mAef f
Z Z
B(ν, θ, ϕ)PN(θ0− θ, ϕ0− ϕ)dΩ = kTA (2.7)
and it has units of W m−2 Hz−1; in millimeter/radio astronomy the power received
has units of Janskys (Jy), where 1 Jy = 10−26 W m−2 Hz−1 = 10−23 erg cm−2 s−1
Hz−1. T
A is the antenna temperature in K and it represents what the antenna
effectively measure:
TA=
mAef fS(ν)
k = GS(ν) (2.8)
where k is the Boltzmann constant and G is the so-called antenna gain:
G= mAef f
k [K/Jy] (2.9)
i.e. a measure of how well an antenna collects signal and it is related to the effective area.
2ALMA receivers are constructed with two independent receptors so that both modes of
2.2.1
Basic principle of interferometry
Since the resolving power of a single-dish observation depends on the observing wavelengths, for millimeter/radio observations it could be very low compared to optical observations (lambda is larger by many orders of magnitude). Furthermore, it is not possible to increase D as much as to obtain the same angular resolution of ground-based optical telescope (∼ 1 arcsec). Interferometry, also known as aperture
synthesis, is the technique developed in order to obtain higher angular resolution
images using the combined signal from two or more separated elements. The power response of each antenna is time averaged and then cross-correlated (i.e. multiplied) by a correlator and the resulting power pattern will be the sum of such products of voltage patterns from element pairs. Figure 2.2 shows a scheme of a simple two-antenna interferometer, where b is their distance, called baseline. The two-antennas in
Figure 2.2: An ideal 1-D two-antenna interferometer consisting of two antennas, 1 and 2, separated by a physical distance b, their baseline. The antennas are both pointed towards a sky location s0which is at an angle θ from the meridian. The projected distance between the two antennas in that direction is u = b cos θ. The detected voltages of each antenna are bring via cable to a correlator and then combined.
figure 2.2 observe the same source but the signal is received at different times by the two elements; antenna 1 experiences the geometrical delay τg = b s0/c, where s0
is the position observed by the antennas and c is the light-speed. Before correlate the signals it is necessary to take into account τg, applying an artificial delay to
the signal path of the antenna 2. The correlator multiplies and time-averages the signals incoming from the two elements and measures a quantity known as the the
complex visibility, which is the Fourier transform of the sky brightness distribution
B(x,y) (Cittert-Zernike theorem):
V(u, v) =
Z Z
B(x, y) =
Z Z
V(u, v)e−2πi(ux+vy)dudv (2.11) U and V are the spatial frequency components of the power pattern in the E-W and
N-S directions, respectively; they represent the projected lengths of the baselines onto a plane normal to the direction of the source, measured in units of wavelength at the time of the observation;x,y (rad) are the angles in a tangent plane relative to a reference position in the E-W and N-S directions. V is a complex quantity which is described by an amplitude A and phase ϕ containing information about the source brightness and its location relative to the phase center, respectively. The complex visibility distribution is called the (u,v) plane whose Fourier transform gives the sky brightness distribution: the image is a "sum" of the visibilities where each has an amplitude and phase representing the brightness and relative position of emission on a specific angular scale. The power pattern of an interferometric observation is called synthesized beam. Each pairs of antennas sample the sky brightness dis-tribution on a scale inversely proportional to the projection of their distance on the sky. The response of the interferometer is sinusoidal (usually called fringe) and in the 1-D case, it samples spacing on the sky given by λ/b; the antennas can sample the sky brightness distribution only on the scale defined by the wavelength of the sinusoid. Since the fringe spacing depends inversely on the projected distance, as closer the antenna pair are larger the sampled scales are. Conversely, the signal pro-duced by a distant antenna pair samples smaller angular scales. Furthermore, since the fringe spacing also depends on the wavelength of emission, observing shorter or longer wavelengths can sample smaller or larger angular scales, respectively.
A given pair of antennas will instantaneously sample a single scale of the sky bright-ness distribution. Given the spatial coordinates of a pair, a visibility in the uv-plane is measured. The visibilities are complex functions with Hermitian symmetry so that a single sampling gives two points in the uv-plane, (u,v) and its complex con-jugate (-u,-v). In order to model the true sky brightness distribution it is necessary to sample as much as possible the uv-plane. It can be done using multiple antennas at different distances into an array3 or increasing the observation time. Due to
the Earth’s rotation effect, the baselines projection plane change continuously its position relative to the source allowing to sample many visibilities across the uv-plane. Furthermore, the antennas can be configured in different ways so that pairs of antennas have different distances and sample different parts of the uv-plane, i.e. different angular scales. Figure 2.3 shows an uv-plane example.
3If N is the number of the available antennas, N (N − 1)
2 is the number of the baselines, each pair providing a pair of samples in the uv-plane.
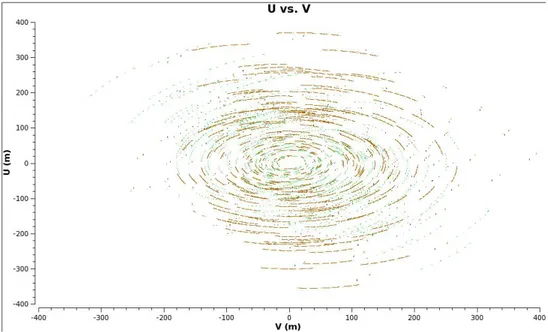
Figure 2.3: Example of uv-plane coverage for a typical ALMA observation. The inte-gration time is ∼ 46min; u and v are in meter unit. The Earth’s rotation leads to the observed "tracks", allowing to sample different angular scales.
2.2.2
Interferometer properties
Angular resolution (Synthesized beam)
The resolution of an image is defined as the compactness of the central feature of the beam, i.e. half its FWBN. In the case of interferometric observations the beam is usually called ’synthesized beam’. Due to the complexity of the beam structure, it is not so easy to measure FWBN, so that the resolution is typically approximated to first order by the FWHM of a Gaussian fit to the central feature of the beam; it depends on how the interferometer antennas are arranged in configurations: a compact configuration gives low resolution since the central beam feature is wide, while an extended configuration gives higher resolution since the central beam fea-ture is narrow. To first order, the resolution provided by an interferometer can be computed as:
θres= k
λ Bmax
[radians] (2.12)
where k is a factor that depends on visibilities weighting and Bmax is the longest
baseline in the array.
Field of View (FOV)
The Field of view (FOV) is the angular sensitivity pattern on the sky of each element in the array. In interferometric observations it is usually called Primary Beam. The
FOV is typically approximated by a Gaussian whose FWHM is:
F OV =∼ 1.13λ
D [radians] (2.13)
where D is the antenna diameter. It sets the field of view of an observation with the array.
Maximum Recoverable Scale (MRS)
Interferometric observations provide highest angular resolution with respect to single-dish observations, but they are insensitive to large angular scales. In fact, the ar-ray cannot sample spacial frequencies lower than those that can be sampled by a baseline equal to the antenna diameter; this means that the closest regions of the
uv-plane cannot be sampled, leading to the so-called zero-spacing problem. This
lack of sampling on the visibilities plane leads to a lack of information in the image plane, those corresponding to the largest angular structures. The maximum angu-lar scale structure that may be recoverable from an interferometric observation is called Maximum Recoverable Scale (MRS) and it can be computed by:
θM RS ≈0.6
λ Bmin
[radians] (2.14)
where Bmin is the minimum baseline of the array configuration. Structures larger
than the MRS are ’resolved out’ and cannot be recovered in the observation.
Largest Angular Structure (LAS)
The LAS is the largest scale structure of interest in the source to be observed. If the LAS is larger than the MRS, it cannot be recovered by the observations and a more compact array configuration may be required.
2.3
Calibration: an overview
Observed visibilities are "corrupted" by a variety of effects such as the signal pro-cessing by the instrument electronics and the transmission through the atmosphere, which cause signal absorption and distortion. Calibration is the process of correct-ing such effects to make data as close as possible to the ideal ones, measured in vacuum by a perfect system. It is not an arbitrary process and is done in order to provide an accurate picture of the sky when data are imaged.
The relationship between the observed and ideal visibilities on the baseline between antennas i and j may be expressed by the Hamaker-Bregman-Sault Measurement
equation:
−→
Vij(ν, t) = Gij(ν, t)
−→