SCUOLA DI INGEGNERIA E ARCHITETTURA
DIPARTIMENTO DI INGEGNERIA INDUSTRIALE DIN
CORSO DI LAUREA IN INGEGNERIA ENERGETICA E NUCLEARE
TESI DI LAUREA
in
TRASMISSIONE DEL CALORE E TERMOFLUIDODINAMICA APPLICATA M
CHARACTERIZATION OF THERMOELECTRIC
COMMERCIAL MODULES FOR POWER GENERATION
USING A MODULE TEST SYSTEM
CANDIDATO: RELATORE:
MATTEO URBANI Chiar.mo Prof. ANTONIO BARLETTA
CORRELATORI: Dr. RASMUS BJØRK Ing. DAN ERIKSEN
Anno Accademico 2012/13 Sessione II
Il presente lavoro di tesi è stato svolto presso la DTU, Technical University of Denmark, nel Department of Energy Conversion and Storage, Riso Campus. Lo scopo del periodo di soggiorno estero è stato quello di caratterizzare appropriati moduli termoelettrici forniti da aziende del settore, utilizzando un opportuno apparato di caratterizzazione. Quest’ultimo è noto come “module test system” e, nello specifico, è stato fornito dalla PANCO GmbH, azienda anch’essa attiva nel campo delle tecnologie termoelettriche. Partendo da uno studio teorico dei fenomeni fisici interessati (effetto Seebeck per la produzione di potenza termoelettrica), si è cercato in seguito di analizzare le principali caratteristiche, ed elementi, del “module test system”. Successivamente a questa prima fase di analisi, sono stati condotti esperimenti che, con l’aiuto di modelli computazionali implementati attraverso il software Comsol Multiphysics, hanno permesso di studiare l’affidabilità del sistema di caratterizzazione. Infine, una volta acquisite le basi necessarie ad una corretta comprensione dei fenomeni fisici e delle caratteristiche relative alla strumentazione, sono stati analizzati moduli termoelettrici di tipo commerciale. In particolare, sono stati estrapolati dati quali correnti, tensioni, gradienti di temperatura, che hanno permesso di ricavare flussi termici, efficienze, e potenze che caratterizzano il modulo in questione durante le condizioni di funzionamento. I risultati ottenuti sono stati successivamente comparati con dati forniti dal produttore, presenti sul catalogo.
Index
Introduction ... 3
1
Overview, General Aspects and Basic Principles of Thermoelectric generation 1.1 Introduction ... 41.2 Thermoelectric Technology History, a Brief Overview ... 4
1.3 Thermoelectric Effects ... 7
1.3.1 Seebeck Effect, Peltier Effect, Thomson Effect ... 7
1.3.2 The Kelvin Relationships ... 9
1.4 Thermoelectric Generation, Description of the Figure-of-Merit and Thermoelectric Performance ... 9
1.5 Thermoelectric Materials ... 12
1.5.1 Limits to the Dimensionless Figure-of-Merit ... 13
1.6 Thermoelectric Modules ... 14
1.6.1 Fabrication Cost and Optimization ... 16
1.7 Thermoelectric Systems Diffusion and Applications ... 18
1.7.1 Current Thermoelectric Market ... 18
1.7.2 Future Thermoelectric Market ... 18
1.8 Advantages and Disadvantages of Thermoelectric Technology ... 19
2
Module Test System 2.1 Introduction ... 202.2 The Importance of Characterization ... 21
2.3 Literature Overview on Different Ways of Characterization Approach Using a Module Test System ... 22
2.4 Module Test System for Characterization of Commercial TEGs Used in the Development of the Thesis Work ... 27
2.4.1 Introduction to Panco TEGeta ... 27
2.4.2 Specifications and System Hardware Characteristics ... 28
2.4.3 Hardware Preparation Before Starting Measurements ... 30
2.4.4 Software Configuration ... 32
3
Temperatures and Heat Fluxes Distributions 3.1 Introduction ... 383.2 Heat Conductive Blocks ... 39
3.2.1 Copper Blocks Used for the Experiments ... 39
3.2.2 Copper Thermal Conductivity with Laser Flash Method ... 41
3.3 Temperature Measurements ... 44
3.4 Heat Fluxes Calculations ... 48
4
Numerical Models and Comparisons with Experimental Results 4.1 Introduction ... 524.2 Computational Model ... 53
4.2.1 Introduction to Comsol Multiphysics ... 53
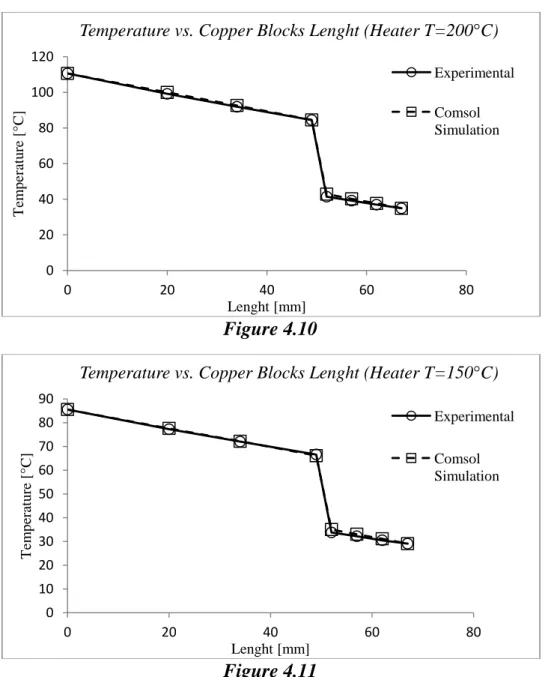
4.3 Temperature Comparisons ... 58
4.3.1 Temperature Comparisons for Copper Blocks Without Insulation ... 59
4.3.2 Temperature Comparisons for Insulated Copper Blocks ... 62
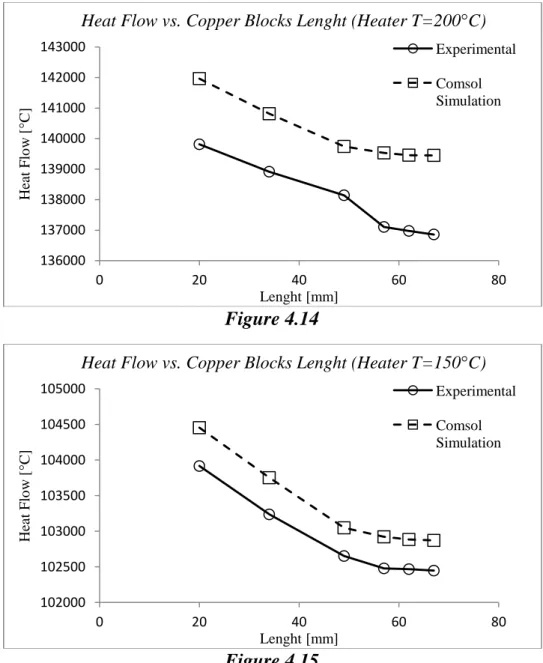
4.4 Heat Fluxes Comparisons ... 65
4.4.1 Heat Fluxes Comparisons for Copper Blocks Without Insulation ... 66
4.4.2 Heat Fluxes Comparisons for Insulated Copper Blocks ... 68
5
Thermoelectric Module Characterization 5.1 Introduction ... 715.2 Thermoelectric Commercial Module for Power Generation ... 72
5.3 Marlow TG12-4L Module Characterization ... 74
5.3.1 Marlow Module without Insulation ... 74
5.3.2 Marlow Module Insulated ... 82
5.3.3 Comparisons between Not Insulated and Insulated Experiments ... 87
Conclusions ... 89
Appendix Section I ... 91
Section II ... 99
Introduction
The modern technologies based on the thermoelectric phenomena have had an important growth in the recent years, especially those related to the power generation.
In the present thesis work the principal aim is to show what is the process and what are the elements needed in order to characterize thermoelectric converters for power generation. It is thus important to achieve a grade of reliability and reproducibility that allows to study TEGs (thermoelectric module generators) performances starting from their output parameters under working conditions.
Although the theory behind thermoelectric effects has been enriched year by year for a period that goes throughout the XX century, the technologies related can be considered a new field of studies. Therefore it becomes relevant the necessity of using module test systems that can provide a good representation of what the TEGs are able to perform and what, in prospective, they could potentially reach in the modern thermoelectric market. The characterization of a commercial thermoelectric module taken as a sample, were conducted in the Department of Energy Conversion and Storage of DTU, Technical University of Denmark. In this department is available a module test system that is implemented in order to extrapolate output values of temperatures, currents and voltages out of thermoelectric converters for power generation.
The process that will be followed in the thesis work involves various steps that constitute a support for the characterization part, that is intended as the final part of all the experimental process. Characterization has to rely on the thermodynamic behavior of the elements that compose the module test system. This is why a first step of hardware and software configuration study is required in order to understand what are the factors that have to be adjusted or that can affect the TEG behavior. Considering this important aspect of being introduced to a system that can be affected by different errors, a numerical model will be also implemented with the software Comsol Multiphysics. Using a computational simulation will provide us a mirror were the results from the experimental analysis can be compared to an expected theoretical behavior. In this way it will be possible to setup the system in an optimized way before beginning the characterization process.
Mixing the simulation results with a previous understanding of the thermodynamic behavior of the elements that are part of the system, the last part of characterization will be developed through the use of a thermoelectric commercial module provided by Marlow company. It is interesting to observe that, in addition to the validation process provided by the Comsol models, a further validation of the results can be given by a reference datasheet that depicts the results achieved by the company for the mentioned module.
An experience that includes different factors such as theoretical studies, practical and simulation works is thus required and was carried forward during all the evolution of this thesis work.
1
Overview,
General
Aspects
and
Basic
Principles of Thermoelectric Generation
1.1 Introduction
This chapter is an overview of the thermoelectric technologies that have been developed since the discover of the physical phenomena related to the thermoelectric power generation and thermoelectric cooling, respectively Seebeck and Peltier effects. During the past decades we assisted to a fast rising of the thermoelectric research followed by alternate periods of poor improvements until the recent years where, due to different technological, social and environmental factors, the demands for new ways of energy management and production begun to rise faster and faster. Starting from the historical contest as a background to understand the potential of the thermoelectric technologies, this chapter will introduce then the principal physical elements and equations that support the thermoelectric phenomena. In this way it is important to understand which properties are the most effective in the optimization and improvements of new modules and what are the factors and the potential limits that could affect the development of the future ones. Eventually there will be introduced a general description of the current thermoelectric market, with particular emphasis on the past diffusion of thermoelectric systems, nowadays technologies and possible future applications.
The first of the thermoelectric effects was discovered, in 1821, by T. J. Seebeck. He showed that an electromotive force could be produced by heating the junction between two different electrical conductors. The Seebeck effect can be demonstrated by making a connection between wires of different materials. The other end of the wires should be applied to the terminals of a galvanometer or sensitive voltmeter. If the junction between the wires is heated, it is found that the meter records a small voltage.
Thirteen years after Seebeck made his discovery, J. Peltier, a French watchmaker, observed the second of the thermoelectric effects. He found that the passage of an electric current through a thermocouple produces a small heating or cooling effect depending on its direction. The Peltier effect is quite difficult to demonstrate using metallic thermocouples since it is always accompanied by the Joule heating effect.
Even if it was not immediately realized that the Seebeck and Peltier phenomena are dependent on one another, this interdependency was recognized by W. Thomson (who later became Lord Kelvin), in 1885. By applying the theory of thermodynamics to the problem, he was able to establish a relationship between the coefficients that describe the Seebeck and Peltier effects. His theory also showed that there must be a third thermoelectric effect, which exist in a homogenous conductor. This effect, now known as the Thomson effect, consists of reversible heating or cooling when there is both a flow of electric current and a temperature gradient.
The fact that the Seebeck and Peltier effects occur only at junctions between dissimilar conductors might suggest that they are interfacial phenomena but they are really dependent on the bulk properties of the materials involved. Nowadays, we understand that electric current is carried through a conductor by means of electrons that can possess different energies in different materials. When a current passes from one material to another, the energy transported by electrons is altered, the difference appearing as heating or cooling at the junction, that is as the Peltier effect. Likewise, when the junction is heated, the electrons are enabled to pass from the material in which the electrons have the lower energy into that in which their energy is higher, giving rise to an electromotive force.
Thomson’s work showed that a thermoelectric couple is a type of heat engine and that it might, in principle, be used either as a device for generating electricity from heat or, alternatively, as a heat pump or refrigerator. However, because the reversible thermoelectric effects are always accompanied by the irreversible phenomena of Joule heating and thermal conduction, thermocouples are generally rather inefficient.
The problem of energy conversion using thermocouples was analyzed by Altenkirch, in 1911. He showed that the performance of a thermocouple could be improved by increasing the magnitude of the differential Seebeck coefficient, by increasing the electrical conductivities of the two branches and by reducing their thermal conductivities. Unfortunately, at that time, there were no thermocouples available in which the combination of properties was good enough for reasonably efficient energy conversion, although the
Seebeck effect has long been used for the measurements of temperature and for the detection of thermal radiation. It was only in the 1950’s that the introduction of semiconductors as thermoelectric materials allowed practical Peltier refrigerators to be made. Work on semiconductor thermocouples also led to the construction of thermoelectric generators with a high enough efficiency for special applications. Nevertheless, the performance of thermoelectric energy convertors has always remained inferior to that of the best conventional machines.
Thermoelectric technology has undergone stages of significant interest, research and development, along with periods of inactivity and decline. The technology developed slowly until the 1930’s, when rapid improvements in all areas of thermoelectric occurred and by the mid 1960’s, practical thermoelectric devices emerged for niche applications in aerospace cooling and space-craft power. Progress in efficiency improvement slowed and research peaked by about 1963, followed by a decline in activity that was to continue for nearly three decades. In Figure 1.1 it is showed the open literature publications in the Web of Science database as a percentage of all publications in the database for each year from 1955 to 2003.
Figure 1.1
It is possible to see from the figure above that between 1963 and 1983, publications in thermoelectrics decreased by a factor of four. During this period, thermoelectric technology
was in fact successfully transitioning from the laboratory to a variety of applications. The marrying of a nuclear heat source to a thermoelectric generator provided long-life power sources for use in inaccessible and hostile environments. Notable were the radioisotope thermoelectric generators (RTGs) providing critical power for NASA missions on the moon and on Mars and for spectacularly successful outer-planetary exploration missions, such as Voyager I and II.
Despite successful use of RTGs, basic thermoelectric science continued to decline. The nascent thermoelectric cooler industry in the U.S. was too small to support significant R&D. The oil crises of the 1970s were just beginning to modify public R&D policy in Japan, but had little lasting effect elsewhere. And during this period, activities in the Soviet Union remained largely unknown in the West. In this inauspicious environment, two men in Texas teamed up in 1970 to organize a series of short courses and conferences which eventually spawned the International Thermoelectric Society (ITS). Initially attendance was quite modest. By 1975, there were more speakers than attendees. Raymond Marlow from Marlow Industries suggested that Professor K.R. Rao, a professor of Electrical Engineering with the University of Texas at Arlington, reorganize as the International Conference on Thermoelectric Energy Conversion (ICOTEC), to be held biannualy. It was at the 1988 meeting (VIIth ICOTEC) that Dr. Charles Wood of NASA/CalTech’s Jet Propulsion Laboratory (JPL) and Professor Mike Rowe, Cardiff University, UK, discussed the sensibility of merging the European Conferences on Thermoelectrics with the International Conference on Thermoelectric Energy Conversion. After the formation of a proper committee Dr. Wood was nominated first president of the new society known as “International Thermoelectric Society” (ITS).
In the years following the birth of ITS there was also renewed interest in thermoelectric technology due to a combination of factors , notably environmental concerns regarding refrigerant fluids, alternative refrigeration and interest in cooling electronics. Contemporary interest in the technology is driven by an increasing awareness of the effect of global warming on the planet’s environment, a renewed requirement for long-life electrical power sources, and the increasing miniaturization of electronic circuits and sensors.
1.3 Thermoelectric Effects
1.3.1 Seebeck Effect, Peltier Effect, Thomson Effect
The thermoelectric effects which underlie thermoelectric energy conversion can be conveniently discussed to the schematic of a thermocouple shown in Figure 1.2.
Figure 1.2
It can be considered as a circuit formed from two dissimilar conductors, a and b (referred to in thermoelectrics as thermocouple legs, arms, thermoelements) which are connected electrically in series but thermally in parallel. If the junctions at A and B are maintained at different temperatures T1 and T2 and T1 > T2 an open circuit electromotive force (emf), V is
developed between C and D and given by V = α (T1 − T2) or α = V/ΔT, which defines the
differential Seebeck coefficient αab between the elements a and b. For small temperature
differences the relationship is linear. Although by convention α is the symbol for the Seebeck coefficient, S is also sometimes used and the Seebeck coefficient referred to as the thermal emf or thermopower. The sign of α is positive if the emf causes a current to flow in a clockwise direction around the circuit and is measured in V/K.
The Seebeck effect is related to the migration of the more energetic electrons that move to a lower potential until an electric field is established to impede the further flow of electrons.
In Figure 1.3 it is shown that the more energetic electrons have a longer mean free path (a). these more energetic electrons (denoted by blue dots) then diffuse to the cold side (b) until an electric field (E) is developed to oppose any further diffusion. Because the electrons are negatively charged, the established electric field is the opposite of that of the temperature gradient.
If in Figure 1.2 the reverse situation is considered with an external emf source applied across C and D and a current I flows in a clockwise sense around the circuit, then a rate of heating q occurs at one junction between a and b and a rate of cooling –q occurs at the other. This effect is known as the Peltier effect and the ratio of I to q defines the Peltier coefficient given by π = I/q, is positive if A is heated and B is cooled, and is measured in watts per ampere or in volts.
The last of the thermoelectric effects, the Thomson effect, relates to the rate of generation of reversible heat q which results from the passage of a current along a portion of a single conductor along which there is a temperature difference ΔT. Providing the temperature difference is small, q = βIΔT where β is the Thomson coefficient. The units of β are the same as those of the Seebeck coefficient V/K. Although the Thomson effect is not of primary importance in thermoelectric devices it should not be neglected in detailed calculations.
1.3.2 The Kelvin Relationships
The above three thermoelectric coefficient are related by the Kelvin relationships:
and
These relationships can be derived using irreversible thermodynamics. Their validity has been demonstrated for many thermoelectric materials and it is assumed that they hold for all materials used in thermoelectric applications.
1.4 Thermoelectric Generation, Description of the Figure-of-Merit
and Thermoelectric Performance
A thermoelectric converter is a heat engine and like all heat engines it obeys the laws of thermodynamics. If we first consider the converter operating as an ideal generator in which there are no losses, the efficiency is defined as the ratio of the electrical power delivered to the load to the heat absorbed at the hot junction. Expressions for the important parameters in thermoelectric generation can readily be derived considering the simplest generator
consisting of a single thermocouple with thermoelements fabricated from n- and p-type semiconductors as shown in Figure 1.4.
Figure 1.4
The efficiency of the generator is given by
If it is assumed that the electrical conductivities, thermal conductivities, and Seebeck coefficients of a and b are constant within an arm, and that the contact resistances at the hot and cold junctions are negligible compared with the sum of the arm resistance, then the efficiency can be expressed as
where λ is the thermal conductance of a and b in parallel and R is the series resistance of a and b. In thermoelectric materials λ and α change with temperature, and in both, generation and refrigeration should be taken into account.
Efficiency is clearly a function of the ratio of the load resistance to the sum of the generator arm resistances, and at maximum power output it can be shown that
while the maximum efficiency
where
The maximum efficiency is thus the product of the Carnot efficiency, which is clearly less than unity, and γ, which embodies the parameters of the materials.
If the geometries of a and b are matched to minimize heat absorption, then
In practice, the two arms of the junction have similar constants, in which case the concept of a figure-of-merit for a material is employed and given by
where is referred to as the electrical power factor.
The above relationships have been derived assuming that the thermoelectric parameters which occur in the figure-of-merit are independent to temperature.
The conversion efficiency as a function of operating temperature difference and for a range of values of the material’s figure-of-merit is displayed in Figure 1.5.
Figure 1.5
Evidently an increase in temperature difference provides a corresponding increase in available heat for conversion as dictated by the Carnot efficiency, so large temperature differences are desirable.
1.5 Thermoelectric Materials
One of the parameters that is used in the classification of materials is the electrical conductivity. Metals have a high electrical conductivity while in insulators the conductivity is very low and under normal conditions is taken as zero with semiconductors occupying an intermediate position between the two. The electrical conductivity is a reflection of the charge carrier concentration and all three parameters which occur in the figure-of merit are functions of carrier concentration as shown in Figure 1.6. The Seebeck coefficient decreases with increase in power concentration and the electrical power factor maximizing at a carrier concentration of around 1025/cm. The electronic contribution to the thermal conductivity λ, which in thermoelectric materials is generally around 1/3 of the total thermal conductivity, also increases with carrier concentration. Evidently the figure-of-merit optimizes at carrier
concentrations which corresponds to semiconductors materials. Consequently, semiconductors are the materials most researched for thermoelectric applications.
Thermoelectric phenomena are exhibited in almost all conducting materials (except for superconductors below Tc). Because the figure-of-merit varies with temperature a more
meaningful measure of performance is the dimensionless figure-of-merit ZT where T is absolute temperature. However, only those materials which possess a ZT>0,5 are usually regarded as thermoelectric materials.
Figure 1.6
1.5.1 Limits to the Dimensionless Figure-of-Merit
Thermodynamics does not place any upper limit on the dimensionless figure-of-merit, ZT, but for many years it was impossible to find values significantly greater than unity. Empirically, one can predict an upper bound by combining the best electronic properties of any known crystalline material with a phonon conductivity that is typical of glass. By this means, one arrives at a highest value of ZT equal to about four. Recently, however, it has been demonstrated that certain low-dimensional structures can have values of the figure-of-merit that exceed those found in bulk materials. This allows us to upgrade our predicted limit for ZT to, perhaps, 20.
Several attempts have been made in the past to estimate the maximum thermoelectric figure-of-merit that will ever be reached. There is no restriction placed on the value of ZT by thermodynamics since, if this quantity ever became infinite, the thermoelectric efficiency would still be no greater than that of the Carnot cycle. At room temperature, the best thermoelectric materials are solid solutions based on bismuth telluride. A value of ZT equal to about one was established for these materials in the late 1950’s and has not been improved upon since then. At the present time , the greatest dimensionless figure-of-merit for bulk materials is of the order of unity under ordinary conditions.
If we referred to the dimensionless figure-of-merit expression described in 1.4 section of this chapter we can considerate that the total thermal conductivity is a sum of two different factors, respectively the lattice and the electronic contribution. In this way, ZT may be increased either by decreasing the lattice factor or by increasing either α or σ. However, σ is tied to the electronic contribution of the thermal conductivity through the Wiedemann-Franz relationship, and their ratio is essentially constant at a given temperature for the majority of TE materials. Some of the goals of current research efforts are to find new materials that either increase the current efficiency of TE devices or have the capability of operating in new and broader temperature regimes, especially at lower temperatures (T<250 K) and at high temperatures (T>400 K).
1.6 Thermoelectric Modules
The basic unit of a thermoelectric (TE) generator or refrigerator is a “thermocouple” shown schematically in Figure 1.7a.
It consists of an n-type and a p-type thermoelement connected electrically in series by a conducting strip (usually copper). Although this basic unit can also be employed as the “engineering” building-block for construction of thermoelectric conversion systems, a less complicated approach for system engineers is to employ “thermoelectric module” as the building-block. Figure 1.7b show schematically a thermoelectric module, which consist of a number of the basic units connected electrically in series but thermally in parallel and sandwiched between two ceramic plates. A complete configuration of a thermoelectric module (in this case a typical Peltier cooler) can be seen in Figure 1.8.
Figure 1.8
The generating performance of a thermoelectric module is caused primarily by the conversion efficiency and power-per-unit-area, while the cooling performance by the coefficient of performance (COP) and heat pumping capacity. These quantities may be estimated using a theory developed by Ioffe based on a simplified model in which the thermal and electrical contact resistances had been neglected. Although this theory has proven to be adequate for analysis of large-dimension thermoelectric modules, it becomes inaccurate for the modules which possess short thermoelement length. Over the past few years, an improved theory has been developed based on a more realistic model which takes into account the thermal and electrical contact resistances of the modules.
The electrical power generated from a module depends upon the numbers of thermocouples in a module, thermoelement configuration, thermoelectric properties of
thermoelement materials, thermal, and electrical properties of contact layers, and the temperature difference across the module. It can be shown then, that when the module operates with a matched load, the output voltage V and current I are given by:
(1.1) (1.2)
where N is the number of thermocouples in a module, α the Seebeck coefficient of the thermoelement material employed, and ρ the electrical resistivity, TH and TC are
temperatures at the hot and cold sides of the module, respectively, A and l are the cross-sectional area and thermoelement length, respectively, lc is the thickness of the contact layer, n=2ρc/ρ and r=λ/λc (where ρc is the electrical contact resistivity, λc the thermal contact
conductivity, and λ the thermal conductivity of thermoelement materials). n and r are usually referred to as electrical and thermal contact parameters, respectively.
1.6.1 Fabrication Cost and Optimization
The parameters appearing in equation (1.1) and equation (1.2) can be grouped into three categories:
1. Specifications: The operating temperatures TC and TH, the required output voltage V
and current I.
2. Material parameters: The thermoelectric properties α, σ, λ and the module contact properties n and r.
3. Design parameters: The thermoelement length l, the cross-sectional area A, and the number of the thermocouples N.
The specifications are usually provided by customers depending on the requirements of a particular application. The material parameters are restricted by currently available materials and module fabricating technologies. Consequently, the main objective of thermoelectric module design is to determine a set of design parameters which meet the required specifications at minimum cost. The number of the thermocouples N, required in a module can be determined using equation (1.1), while the cross-sectional area, A, can be obtained
from equation (1.2). The determination of N and A for a given thermoelement length is usually a straightforward calculation.
In general, a high conversion efficiency is required if the heat source (fuel) is expensive, while a large power-per-unit-area is required if fabrication cost is to be reduced. In practice, the cost-per-kilowatt-hour is generally used as a yardstick of the economic viability of a generator. The cost-per-kilowatt-hour, c, of electricity generated using a thermoelectric module may be estimated using
where cm is the fabrication cost of a thermoelectric module, cf the input thermal energy cost per kilowatt hour, Δt the operation period, and p and Φ are the power output and conversion efficiency, respectively, of a thermoelectric module. Figure 1.9 shows the cost per-kilowatt-hour vs. the conversion efficiency and power-per-unit-area for different fuel costs for ΔT=100 K.
Figure 1.9
It can be seen that a trade-off between the conversion efficiency and power output is dependent on the cost of heat source employed. If the heat source employed is expensive, the module should be designed to obtain large conversion efficiency. However, if the heat source is inexpensive or essentially free, such as in the case of waste heat, increasing the power-per-unit-area will result in a reduction in the cost of electricity generation. This can be achieved by employing thermoelements with shorter legs.
1.7 Thermoelectric Systems Diffusion and Applications
1.7.1 Current Thermoelectric Market
Thermoelectric technology is commercially successful in cooling, refrigeration and space-craft power applications. Estimated sales of thermoelectric modules in 2006 is around $200 million, with the consumer market being the largest sector, accounting for 35% of the total market distribution, followed by telecom at 16% and automotive at 14%. The laboratory, medical and biological market account for 12%, semiconductor processing at 8%, and the Defence and Space sector now accounting for only 6% of the total market.
Historically, the Defence and Space industries used to be at the centre of the industry, with Radioisotope Thermoelectric Generators (RTG’s as discussed in the previous paragraphs) having been a genuinely enabling technology for deep space exploration. However, this sector of the market is now flat and is not showing signs of growth. The consumer market is now the largest sector and includes water coolers, cooler boxes and refrigerators. Thermoelectric coolers are widely employed in microelectronics to stabilize the temperature of laser diodes, to cool infrared detectors and charge-coupled devices, computer electronics and individual computer chips. Recent growth can be seen in the automotive market, especially in automotive seat cooling applications.
1.7.2 Future Thermoelectric Market
The consumer market is predicted to continue with water cooler boxes and mini refrigerators remaining an important product application. Besides this success, thermoelectric refrigeration appears to have made little impact on the domestic refrigeration market. The energy efficiency of thermoelectric refrigerators, based on currently available materials and technology, is still lower than its compressor counterparts. However a market thermoelectric refrigerator can be made with an acceptable Coefficient of Performance (COP). The automotive industry is seen as a potential high volume market, and market growth exists for thermoelectric generators, specifically for waste heat recovery and the replacement of batteries in small remote power sources.
The possibility of using thermoelectric technology to convert waste heat into electrical power has been considered for some time. Thermoelectric solutions for self-powered space and water heating have shown that the electricity generated by a thermoelectric power unit is sufficient to power all the electrical components for a residential central heating system. In some areas of the developing world, electric power supply is unreliable and intermittent, and it is common to find wood or diesel fired stoves. Studies have demonstrated acceptable economic performance for stove-top thermoelectric generators, and a domestic wood-stove and thermoelectric generator system can be achieved at a low cost with minimal complexity.
The need for lightning the battery burden in present and future military systems is a focus for implementing thermoelectric technology within the US Army, and a market exists for thermoelectric air-conditioners in submarines.
An interesting problem potentially facing the thermoelectric industry is the availability of raw materials. There are four main raw materials used in thermoelectric elements, Te, Bi, Sb, Se. These materials are regarded as rare materials and their supply may be limited in the future, highlighting the need to develop other types of materials.
Contemporary problems surrounding climate change will act as a stimulus for the development of thermoelectrics, with the International Thermoelectric Society having recently adopted as their primary goal “To promote an understanding of the role thermoelectric technology may play in environmental impact and mitigating global climate change”.
1.8 Advantages and Disadvantages of Thermoelectric Technology
Thermoelectric technology is considered to have several advantages, notably it has no moving parts, an ability to function in harsh environments, and substantially less maintenance requirements than comparable technologies. For cooling or refrigeration applications, no chlorofluorocarbons or other materials that require periodic replenishment are necessary, providing a potential environment benefit, with precise temperature control. The modules are relatively small in size and weight, and can be mounted in any orientation as they are not position dependent. Furthermore, thermoelectric devices are electrically quiet in operation and can be considered an environmentally friendly technology.
The main disadvantage of thermoelectrics is the relatively low conversion efficiency and figure-of-merit (ZT) compared with other technologies. For thermoelectric power generation, current thermoelectric efficiencies are between 5%-10%. Until recently, thermoelectric applications have been confined to niche applications because of this low conversion efficiency. There is significant research into synthesizing new materials and fabricating material structures with improved thermoelectric performance, in an attempt to improve the thermoelectric figure-of-merit by reducing the lattice thermal conductivity. However, in some parasitic applications this low conversion efficiency can also be viewed as a distinct advantage. Furthermore, it has been acknowledged that in situations where the supply of heat is cheap or free, as in the case of waste heat or solar energy, efficiency of the thermoelectric generation system is not an overriding consideration.
2
Module Test System
2.1 Introduction
This chapter introduces the importance and the different ways of using a module test system in order to gain the most reliable parameters from an operating thermoelectric module. Nowadays the research about thermoelectrics (both for refrigeration and power generation) is focusing on new ways of improvements related to the study of new materials, figure-of-merit optimization, development of future applications, reduction of the most influential physical factors that inhibit the achievement of higher efficiencies and many other aspects that are relevant for a faster growth of the thermoelectric market. With this optic of reaching new goals in this field of thermodynamics it become more and more relevant to acquire and promote the most effective testing systems in order to verify the real potentials of the modern and future thermoelectric modules.
In the next pages there will be shown different ways actually used to test TEGs (thermoelectric module generators) and Peltier cooling modules and how they can be effectively realistic about the output parameters. Different researches have been developed during the recent years in order to achieve a method as close as possible to a standardization of the thermoelectric module testing, in this chapter few of them there will be introduced. Following the pattern outlined by the actual utilization of different module test systems, eventually there will be described and introduced the system used to characterize the commercial modules that form the main body of this thesis work. There will be described its technical and logical characteristics and how an operator that interfaces with the system has to set up all the different elements that contributes to the extrapolation of the parameters
from a module under work conditions. Therefore if it is important to comprehend and analyze all the criteria that drive the development of the thermoelectric modules physical aspects, it’s even more important to obtain the most accurate results in terms of output parameters , especially when it can affect the growth of a recent technology.
2.2 The Importance of Characterization
In the field of thermoelectrics there are several factors that influence the optimization and the commercial success of new modules. Beneath all the steps that contributes to the understanding of how these factors can affect or not a thermoelectric module, there is the validation process that leads to the connection between what has been improved to get the final product and how the product itself relates to the actual thermoelectric standards.
Considering a thermoelectric module generator (TEG), it is possible to follow its timeline growth from the theoretical considerations about its physical behavior to the effective assembly of the thermocouple to form a single module. It is important to understand that all the research and work beneath this process would not be validate if at the end of the timeline a good characterization method is not supporting the results that it is possible to achieve using a TEG.
The important aspects that we have to consider about the characterization of TEG, are essentially the output parameters that helps to compare different modules in order to understand their real potentials. A module test system provides, usually with fast and reliable operations, the best way to collect output parameters such as voltages, currents, heat fluxes across the TEG and temperature fields, that allows later to get power and efficiency values characterizing the single module. Once is possible to have the full range of plots regarding the different reactions of the module under different loads of temperature and resistances, it will be easier to understand what can be done for new improvements. In this way it will be also possible to know what has to be done in order to implement new elements, in the module test system configuration, that could be useful to improve the way and the precision of the data collection.
Comparing to the other ways of using a module test system that are presented in literature (few of them there will be shown in the next paragraphs), this thesis work focuses on a system that will also have the help of an computational model that will be used as a mirror where the results gained from the working conditions will be validated.
It is also important to understand that the optimization of the physical parameters that affect a thermoelectric module is also strictly related to the characterization process. This interrelation is due to the fact that most of these parameters are evaluated through methods that not considers the module in its effective load working conditions. Besides, parameters such as α, ρ, κ, z change not only with temperature but also with respect to the physical
dimensions of the semiconductor. Furthermore, the fact that the structural and technological factors of a real module are not considered in the calculation renders these methods insufficient. That is why the development of a practical and efficient characterization system is very important both for theory and application.
2.3 Literature Overview on Different Ways of Characterization
Approach Using a Module Test System
During the development of the thermoelectric modules in the past years, several methods have been established in order to characterize key properties such as efficiency, current and voltages output values, and heat fluxes throughout the generator. As regarding the efficiency, for example, two main issues have to be underlined as to determine accurate results are the electrical output power and the heat flow. Considering measurement of the electrical output power the usually very low internal resistance of the modules has to be considered, as it has to be possible to apply even lower load resistance to the generator. A greater difficulty and the actual challenge is the measurement of the heat flow that I supplied to the generator. It has been previously proposed by Birkholz et al. to use a comparative measurement by employing a reference material in form of a reference block placed next to the generator into the heat conduction path.
This approach, however, is affected by some sources of serious systematic errors like the uncertainty of the reference material’s heat conductivity. Another difficulty is to avoid heat losses in the reference blocks by radiation or convection. These heat losses are difficult to estimate and correct, which will lead to systematic errors in the hat flow measurement. In order to overcome these uncertainties an absolute method for the measurement of the heat flow is presented by L. Rauscher, S. Fujimoto et al. work [2005]. It is realized by measuring the power dissipation of an electrical heater, which supplies the thermal energy on the hot side of the module. This avoids the necessity of any thermal conductivity reference and does not require the measurement of small temperature differences. The method, however, depends critically on the avoidance of any parasitic heat flow, and the measuring heater has to be shielded very carefully.
In Figure 2.1 it is shown the assembled set up as it was used for the test measurements in Rauscher and Fujimoto work. It can be seen that on top of the guardian heater, a massive copper block was attached to provide mechanical support and a heat reservoir, which was used to thermally anchor all wires and the radiation baffles. Carbon sheets were used to ensure good thermal contact between all parts. The cold side heat exchanger is mounted on a lift cylinder to apply a vertical pressure to the system to achieve good thermal contact between the generator and the heaters. A centered steel ball is used to give a flexible and thermally separated support to an upper side support.
Figure 2.1
Another characterization method was carried on by R. Bonin, D. Boer et al.[2013]. The novelty of this work has to found both in the originality of the proposed device, by considering its whole structure, and the field of application. Moreover, they highlight the peculiarity of the heat source employed since the heat is supplied by a flameless catalytic burner. This kind of heat source is more competitive and reliable with respect to flame burner when it is used for applications where low power and small dimensions are required. In addition, this study permits to model the thermoelectric generator when different natural heat sources are considered since the employed catalytic burner basically provides a low-temperature heat source, exactly representing what can be obtained by a renewable heat source such as geothermal, ocean thermal energy, and waste heat. A schematic section of the whole device is shown in Figure 2.2.
In Bonin and Boer work, in order to properly manage the energy produced by the generator, it is necessary to consider that the system, when switched on, starts to produce energy till the end of the fuel also if no load uses that energy. The best solution is not only to convert this energy to be used with the most part of microprocessors or sensors available on the market, but also to store that part of the energy that is not instantly used. Considering the storage system, it can be divided in two main components based on different technologies:
Electrostatic storage: most suitable when the external load requires small quantity of energy in short intervals and the generator continuously supplies the average energy required.
Chemical storage: most suitable when the generator has an intermittent production or the external load requires medium/large quantity of energy with long pause interval also when the generator is switched off.
Figure 2.2
A characterization method is also proposed by R. Aishka and S. Dislitas work [2010]. Their developed system consists of three sections: TE module mechanism, Cooling System, and Heating System. The main structure can be seen in Figure 2.3.
We can see that 1- indicates the copper base on which there are two water radiators, 2- indicates the water radiators, and 3- is the plate of 2.5 mm width providing a thermal balance. In the figure, 4- is the thermoelectric module, 5- is the second plate providing thermal balance and 6- is the heater. Cold side of the module 4-, thermal balance plate 5-, and the heater 6-, are isolated by cylindrical foam indicated as 7-. The cylindrical foam, 7-, also covers top surface of the heater 6-. This entire sandwich is assembled to the base, 1-, with screws, 9-, and this block is closed with a cover, 10-. In order to ease the usage of the set, this block is assembled to the base, 12-, with screws, 11-, also. Electric supply cables of the thermoelectric module and the heater, and the free ends of the thermocouples T1-T4 are
intentionally extracted out of the structure. As to measure the temperatures of the cold and the hot side of the module as precisely as possible, thermal balancer plates 3- and 5- are made of red copper and thermocouples are placed into thin holes of diameter 1.5 mm, drilled 15 mm to the center of these plates. All contact surfaces around the block are covered with thermally conductive silicon coating. There is also a loop thermoelectric cooling system, consisting of a pump, 16-, fan and a radiator, which keeps temperature TH
constant and remove the thermal load out of the hot surface.
In the literature it is also possible to find different configurations in which thermoelectric modules are tested. It is interesting, for example, to consider the work proposed by Gaowei Liang, Jiemin Zhou et al. [2011]. In their work they show that as the output power of the TEG composed of only one TE module is very small, to obtain higher output power, it is possible to make a TEG by multiple TE modules in series connection or parallel connection. The results showed that when all the modules had the same parameters, and worked in the same condition, the parallel properties of the TEG where the same as the series-parallel properties of common DC power. However, to a multiple modules TEG, it is hard to guarantee every TE module works in the same conditions. Therefore, there are more components in the multiple modules TEG, and its performance analysis is more complex than the one module TEG. In the research carried forward by Liang and Zhou, the output performance of parallel TEG is studied and an analytical model of parallel TEG is proposed based on thermodynamic theory, semiconductor thermoelectric theory, and law of conservation of energy. The model can also be used to analyze the output performance of parallel TEG when all TE modules work in different conditions.
In order to verify their parallel model established in the research, Liang and Zhou developed a parallel TEG experimental system, which schematic representation is shown in
Figure 2.4. The parallel TEG consists of two TE modules which are numbered as TE-1 and
TE-2, respectively. The heat source of each TE module is a heating plate made of aluminum, its temperature can be adjusted by the voltage on the electric heating tube. The heat sink of each TE module is a water cooling plate made of copper, its temperature can be adjusted by the flow and temperature of cooling water. Some U-shaped slots are cut on the heating plates surface and water cooling plates surface which contact with the TE modules.
To reduce the thermal contact resistance, the interfaces of the heat source and the TE module, the TE module and heat sink are all coated with heat conductive silicone grease, it can be thought that all the interfaces have good contact addition.
Figure 2.4
The last characterization method presented in this review has been developed by Bunyamin Ciylan and Sezayi Yilmaz [2006]. Their thermoelectric module test system consists of 3 main blocks; power supply cooling system, an electronic control and data acquisition. Power supply is a switched mode type and cooling system is a water circulation type heat exchanger. Temperature measurements are taken via a K-type thermocouple and current is sampled by a Hall-effect sensor. The front end for temperature measurements is also suitable for T-type thermocouples.
A schematic diagram of the mechanical structure of the test system is shown in Figure
2.5. Hot side of the thermoelectric module is cooled by water circulating cooling system.
There is a thin layer of copper sheet between the brass cooling plate and hot side of the thermoelectric module. Its purpose is to provide a thermally conductive means in which the thermocouples can be attached freely to measure the hot and cold side temperatures and also this layer serves to distribute the heat uniformly all over the surface of the contact area with the aid of a thermally conductive paste. There is a heater plate made form brass between the cold sides of two thermoelectric modules. One of the thermoelectric modules is the device under test, while the other one, which is identical with the module under investigation, is used to distribute the heat load posed by the heater equally between its two sides. All the
test apparatus is covered by a 5 cm polyurethane coating to minimize the external heat load and the internal heat losses.
Figure 2.5
2.4 Module Test System for Characterization of Commercial TEGs
Used in the Development of the Thesis Work
2.4.1 Introduction to Panco TEGeta
The current thesis work is about the extrapolation of output parameters from commercial TEGs modules during their load conditions. A thermoelectric power generation module needs a series of devices that helps to conduct the experiments in a reliable and fast procedure that comprehend different issues, such as a mechanical and electrical set-up, good connections, suitable movable elements, data acquisition process and manageability.
The experiments were carried on in the Department of Energy Conversion and Storage of DTU, Technical University of Denmark, Riso Campus. In this Department is available a system developed by PANCO GmbH - Physics Technology, Development and Consulting, a company involved in the development and application of measurements techniques and thermoelectrics.
The equipment developed by PANCO is known as “TEGeta: Measurement of efficiency
and specifications of Thermoelectric Power Generators”. As can be understood from the
through the elaboration of current and voltages values that occur during the working conditions of a thermoelectric module.
Considering an overlook that synthesize the principal features of the TEGeta, we can say that the thermoelectric module is placed between a heating and a cooling plate in order to establish a temperature gradient. In this way, using different load resistors that can be applied to match the load, currents and voltages of the TEG are measured.
2.4.2 Specifications and System Hardware Characteristics
The facility consists mainly of a measurement pillar, data logger and PC for data acquisition.
The measurement pillar is a cooling plate that is cooled. In between two reference blocks are placed to measure the temperature gradient inside the blocks and thus the heat flow. Moreover, in between these reference blocks the TEG is placed. A thermal insulation is used to minimizes the heat losses.
The measurement equipment consists of temperature sensors (for heater, cooling plate and reference blocks) and the connections for voltage and current of the TEG as well as a data logger and electronics to control the load resistance. In addition a vacuum chamber allows measurements under vacuum conditions or in protective gas atmosphere. Generally the equipment can be used in air up to 900°C/1000°C.
The data are acquired by a data logger and saved into a PC. Furthermore the measurement software allows for the control of the devices, temperature settings for the heater, temperature steps for the measurement and control of the load resistors. The data can be saved into .txt format or Excel format (.xls) for further process.
We can consider a list of the principal specifications:
- References blocks (2 pieces), with dimensions changing with the TEG module used - Cooling plate
- Heater with PID controller - Thermal insulation
- Connectors for thermal sensors, electrical connections for heater and TEG - Thermal sensors (type K)
- Load resistors
- Data logger Keithley 2770 - Multiplexer card Keithley 7710 - GPIB-USB connector
- PC with measurement software
- Measurement range temperature: room temperature up to 1000°C - Measurement range voltage: 0-60 V (accuracy ±1%)
In the following Figure 2.6, Figure 2.7 and Figure 2.8 is shown a schematic representation of the system and some pictures of the hardware configuration before starting the experiments.
Figure 2.6
2.4.3 Hardware Preparation Before Starting Measurements
In Figure 2.7 and Figure 2.6 it is possible to see the mechanical support and the cooling water element that constitutes the basis of the measurement pillar. After positioning the reference cooling block, that has been chosen considering thermoelectric module dimensions, on the cooling plate, it is possible to insert the TEG module sandwiched between the upper reference block and the cooling block. This operation has to be accurate in order to line up all the different elements between each other. It is an important step of the hardware configuration since the TEG has to be totally covered by the blocks without any visible part of its surfaces in order to avoid heat flux dispersions and a temperature gradient collapse.
Once that the first three elements are placed (cooling block, TEG module and upper block) it is possible to place on the top of the pillar the heater and the weight that is needed to assure a good surface contact between the different element of the pillar. The heater element it is shown in Figure 2.9 and Figure 2.10 where it is possible to see the wires connections through which the PID controller set the temperature and the hole where the thermocouple is placed.
Figure 2.9 Figure 2.10
During the preparation of the pillar graphite sheets, with the same dimensions of the blocks and the TEG module, are placed in between the different elements surfaces in order to improve the contact between the blocks, the TEG module and the heater. Furthermore graphite is a good conductor that is able to inhibit the thermal resistance that opposes to the heat flow.
The following step after the pillar is formed is to place the thermocouples. Thermocouples are needed in order to control the temperature gradient along the pillar/blocks and to study the heat flow across the module. It is also very important to know the temperatures related
to the hot side and cold side of the TEG module to have an accurate measurement of the heat flow during the different steps of temperature distribution to which the module is subjected. Thermocouples are slightly thinner than the holes drilled in the blocks so it is easy to place them before the experiments and remove them when the data acquisition process is over. In Figure 2.8 it is possible to notice that there is the same number of holes in both the upper and the cooling block and a respective equal number of thermocouples. There are also different types of commercial thermocouples that could be used in these kind of experiments, in our case we are using a K-type thermocouple that guarantees a wide range of supportable temperatures during its working conditions.
Figure 2.11
In Figure 2.11 it is possible to see the internal configuration of a thermocouple, made by two thermocouple wires grounded by a magnesium oxide insulation and a metal sheath. In the Table 1 below it is showed the comparison between type K thermocouples and other different types.
It can be seen from the Table 1 above how, according to different sizes, K type thermocouples have the most flexible range of tolerated temperatures compared to the other different types.
The last step of the hardware preparation is the switching of the cooling pump in order to let the water begin to circulate in the cooling plate. It is better to make this operation several minutes before the beginning of the experiments in order to get the water to reach a stabilized temperature. The cooling pump, as it is possible to see from Figure 2.12, has an adjustable controller that permits to decide at which cooling temperature we want to take the measurements.
Figure 2.12
2.4.4 Software Configuration
Once the hardware configuration has been set, it is possible to proceed with the software starting. Basically the main features of the software are the temperature control and the data acquisition related to the output voltages and currents. The TEG module is connected through electrical wires to the data acquisition system where load resistors can be adjusted in order to get the matched load (the maximum power output is reached when the internal resistance of the module is equal to resistance load, as explained in the first chapter).
Since a wide range of resistance loads have to be adjusted during the experiment tests, the electrical circuit that provides the load for the current output of the TEG module, is composed by a series of relais which can be configured in order to operate with the desired resistance load. In the Figure 2.13 it is shown how the relais are combined with the load resistors.
Figure 2.13
Relais 1 is closed for current measurement (short circuit current), while relais 2 is open for the measurement of the Seebeck voltage without any resistance (open circuit voltage), when using the load resistors relais 2 must be closed. The combination of open and closed relais 3 to 8 will adjust the desired load resistors.
In order to set the software for the configuration, the system has to be programmed following the procedure that is shown below in Figure 2.14.
Figure 2.14
It is possible to notice that the command # of passes sets the number of measurement runs for each load resistor combination. Relais means the value which is send to a controller to
switch the relais. This number can be calculated with #calc. values of relais and will be shown at the question mark’s position. In Rges the real value of this relais-resistors combination has to be set, this number will appear in the data. With add a line, delete a line or new line new combinations can be set or withdrawn.
The data acquisition system is powered by a Keithley 2700 and it is integrated with a PC that elaborates the data acquired from the TEG module. It is possible to see the integrated system in the Figure 2.15 below.
Figure 2.15
The last step of the software configuration is the setting of the temperature steps that are needed to apply to the TEG in order to acquire the data and the range of time that is necessary in order to have a good stabilization of the system. We can refer to the Figure
2.16 where it is possible to divide the screen in ten parts:
1. Temperature settings 2. Start button
3. Stop button 4. Configuration 5. Machine test
6. Time between measurements
7. Time after set-point temperature reached 8. Measurement data
9. Save button
Figure 2.16
With button 1 the set point temperature can be adjusted. The start temperature is the first temperature to which the PID controller is set. After the measurements at this temperature, the PID controller goes on with the stepwidth further until the end temperature has been reached. The number of steps is thus given.
Field 6 contains the time in seconds that will be waited after each measurement round, while field 7 is the waiting time after the heater has reached the set-point temperature. This time should not be too short, since an equilibrium in the reference blocks and the TEG should be reached.
Field 4 refers to the configuration of the relais-resistors system, as it has been described previously.
As regarding field 5, it opens a new window for a machine test. It means that independently from the main program the temperatures and voltages can be measured and relais combinations can be set. Machine test window is shown in Figure 2.17. This is an important part of the command part of the software since it help to check the parameters involved in the process before starting the measurements. Therefore it is possible to control at the same time the heater temperature and the relais configuration in order to get in real time how they affect the TEG module behavior. Using this procedure the operator that is facing the experiments can adjust in the best way possible all the parameters that are needed during the following start of the measurement process.
After setting all the parameters the button 2 Start can be pressed. During the measurement a red bar appears as it can be seen in Figure 2.18 below.
Figure 2.17
Figure 2.18
The measurement will stop automatically after the last temperature, but it is also possible to stop all the process using the button 3 Stop.
During the data collection, we can see that, from Figure 2.18, all the results are listed in a panel where labels referred to the different parameters are present. It is possible to check, while the experiments are carried on, the different time steps, heater temperature, thermocouples temperature (in the system a total number of ten thermocouples is used), current output, voltage output and resistance load applied respectively for each step of temperature.
Eventually, all the data collected at the end of the experiment can be saved using button 9. By using button 10 it is also possible to plot a graph showing the power output vs the resistance load, but, as will be shown in the next chapter, these kind of graph will be obtained through Microsoft Office Excel when all the data of the singles TEG wil be collected.
3
Temperatures and Heat Fluxes Distribution
3.1 Introduction
This chapter describes the first part of the experimental process that led to the data acquisition on the thermoelectric commercial modules.
As described in the previous chapter the combination between the hardware configuration and the software one is very important in order to get accurate results. This is why, once the system has been prepared to start getting the data, a good calibration is required. In the following paragraphs there will be shown which kind of materials have been used to impose a heat flow across the module, what are their physical characteristics, and how a temperature and heat distribution can be extrapolated using the module test system.
In this first part of the experiment, calculations were made without considering the TEG modules. In this way it was able to analyze the different temperature gradients and heat flows along the blocks that constitute the pillar in which the thermoelectric module is inserted.
These results are very important for two main reasons. The first one is to set all the module test system before starting the electric output extrapolations from the TEGs. In fact, knowing how the thermodynamic characteristics are distributed along the test pillar helps to understand if the real acquisition process is reliable or not. Thanks to the use of the thermocouples inserted in the upper and the cooling block, it is possible then to have information that will be later elaborated and showed in appropriate plots. The second reason is the possibility of comparisons between the experimental results and the simulation ones. As will be described in the next chapters a simulation model will be implemented with the
![Figure 3.10 Figure 3.11 133000 138000 143000 148000 153000 158000 163000 168000 0 20 40 60 80 Heat Flow [W/m²]Lenght [mm]](https://thumb-eu.123doks.com/thumbv2/123dokorg/7473666.102589/55.892.167.730.108.896/figure-figure-heat-flow-w-m-lenght-mm.webp)
![Figure 4.5 Figure 4.6 0 10 20 30 40 50 60 70 80 90 0 10 20 30 40 50 60 70 80 Temperature [°C]Lenght [mm]](https://thumb-eu.123doks.com/thumbv2/123dokorg/7473666.102589/65.892.169.732.290.669/figure-figure-temperature-c-lenght-mm.webp)
![Table 5 a) b) 66000 66100 66200 66300 66400 66500 66600 66700 66800 66900 67000 0 20 40 60 80 Heat Flow [°C]Lenght [mm]](https://thumb-eu.123doks.com/thumbv2/123dokorg/7473666.102589/72.892.182.713.657.1132/table-b-heat-flow-c-lenght-mm.webp)

![Figure 4.18 Figure 4.19 166200 166400 166600 166800 167000 167200 167400 167600 167800 0 20 40 60 80 Heat Flow [°C]Lenght [mm]](https://thumb-eu.123doks.com/thumbv2/123dokorg/7473666.102589/74.892.177.718.103.429/figure-figure-heat-flow-c-lenght-mm.webp)
![Figure 5.3 Figure 5.4 68000 70000 72000 74000 76000 78000 80000 82000 84000 0 10 20 30 40 50 60 70 80 Heat Flow [W/m²]Lenght [mm]](https://thumb-eu.123doks.com/thumbv2/123dokorg/7473666.102589/79.892.167.727.336.928/figure-figure-heat-flow-w-m-lenght-mm.webp)
![Figure 5.6 Figure 5.7 0 2 4 6 8 10 0 0,5 1 1,5 2 Output Voltage [V]](https://thumb-eu.123doks.com/thumbv2/123dokorg/7473666.102589/82.892.164.730.314.808/figure-figure-output-voltage.webp)
