PAPER
Validation of the nerve axon reflex for the
assessment of small nerve fibre dysfunction
A Caselli, V Spallone, G A Marfia, C Battista, C Pachatz, A Veves, L Uccioli
. . . .
See end of article for authors’ affiliations . . . . Correspondence to: Dr Antonella Caselli, Department of Internal Medicine, University of Tor Vergata, Viale Oxford, 81 00133 Rome, Italy; [email protected]; antonella.caselli@ uniroma2.it
Received 28 April 2005 Revised version received 14 March 2006 Accepted 26 March 2006 Published Online First 19 April 2006
. . . .
J Neurol Neurosurg Psychiatry 2006;77:927–932. doi: 10.1136/jnnp.2005.069609
Objective: To validate nerve–axon reflex-related vasodilatation as an objective method to evaluate C-nociceptive fibre function by comparing it with the standard diagnostic criteria.
Methods: Neuropathy was evaluated in 41 patients with diabetes (26 men and 15 women) without peripheral vascular disease by assessing the Neuropathy Symptom Score, the Neuropathy Disability Score (NDS), the vibration perception threshold (VPT), the heat detection threshold (HDT), nerve conduction parameters and standard cardiovascular tests. The neurovascular response to 1% acetylcholine (Ach) iontophoresis was measured at the forearm and at both feet by laser flowmetry. An age-matched and sex-matched control group of 10 healthy people was also included.
Results: Significant correlations were observed between the neurovascular response at the foot and HDT (rs= 20.658; p,0.0001), NDS (rs= 20.665; p,0.0001), VPT (rs= 20.548; p = 0.0005), tibial nerve
conduction velocity (rs= 0.631; p = 0.0002), sural nerve amplitude (rs= 0.581; p = 0.0002) and autonomic
function tests. According to the NDS, in patients with diabetes who had mild, moderate or severe neuropathy, a significantly lower neurovascular response was seen at the foot than in patients without neuropathy and controls. A neurovascular response ,50% was found to be highly sensitive (90%), with a good specificity (74%), in identifying patients with diabetic neuropathy.
Conclusion: Small-fibre dysfunction can be diagnosed reliably with neurovascular response assessment. This response is already reduced in the early stages of peripheral neuropathy, supporting the hypothesis that small-fibre impairment is an early event in the natural history of diabetic neuropathy.
D
iabetic neuropathy includes nerve fibres with bothsmall and large diameter.1 Small-fibre neuropathy
remains a diagnostic challenge because currently available techniques are not objective, have a high variability and are not routinely applied.2 3Consequently, the diagnosis
of small-fibre neuropathy can easily be missed.
Assessment of nerve–axon reflex-related vasodilatation, or neurovascular response, has been proposed as an objective method to quantify C-nociceptive fibre function.4Activation
of peripheral C-fibres by different noxious stimuli, or activation experimentally by acetylcholine (Ach), leads to the conduction of the impulse, both orthodromically to the spinal cord and antidromically to other branches of the same C-fibres, which then release vasodilating neuropeptides. This vasodilative response is part of Lewis’s triple anti-inflamma-tory response.5
This neurovascular response is impaired in patients with
diabetic neuropathy.6Moreover, local anaesthesia markedly
reduces the neurovascular response in controls and patients with diabetes without peripheral neuropathy, whereas in patients with diabetic peripheral neuropathy, the already low neurovascular response at the foot does not decrease further after the induction of local anaesthesia.7
As all previous findings indicate that C-fibre function is the main determinant of the neurovascular response, it is reason-able to hypothesise that the assessment of this response may be used as a surrogate measure of C-fibre integrity. The aim of the present study was therefore to validate the neurovascular response for the assessment of small-fibre function by comparing it with the currently used techniques.
RESEARCH DESIGN AND METHODS Patients
Forty one patients with diabetes were recruited from our unit. The inclusion criterion was an established diagnosis of
type 1 or type 2 diabetes mellitus—that is, the presence of one condition among symptoms of diabetes and casual plasma blood glucose >200 mg/dl, fasting plasma glucose >126 mg/
dl or 2-h post-load glucose >200 mg/dl.8 Patients were
excluded if there was evidence of other neurological or peripheral vascular disease. Peripheral vascular disease was excluded on the basis of clinical signs and symptoms and of an ankle brachial index .0.9. The clinical evaluation included sex, age, height and weight, body mass index (weight (kg)/height2(m2)), duration of diabetes, metabolic
control (HbA1c; normal range 4.3–5.9%) and the presence of
other chronic complications (retinopathy and nephropathy). Ten age-matched and sex-matched controls were also included. The institutional review board approved the study protocol and a written consent form was obtained from all participating volunteers.
Neuropathy evaluation Neuropathy Symptom Score
We used a simplified Neuropathy Symptom Score, a diagnostic tool widely used for assessing symptoms in the legs.9–11Burning, numbness or tingling in the legs scored 2;
fatigue, cramping or aching scored 1; symptoms in the feet scored 2; symptoms in the calves scored 1 and those elsewhere scored 0; nocturnal exacerbation scored 2 versus 1 for both day and night and 0 for daytime alone. A score of 1 was added if the symptoms had ever awakened the patient from sleep. A score of 2 or 1, respectively, was added if either
Abbreviations: Ach, acetylcholine; AUC, area under the curve; HDT, heat detection threshold; NDS, Neuropathy Disability Score; QSART, Quantitative Sudomotor Axon Reflex Test; ROC, receiver-operating characteristic; SNP, sodium nitroprusside; VPT, vibration perception threshold
walking or standing alleviated the symptoms. The range was 0–9 and a score >3 was considered to be abnormal. Neuropathy Disability Score
We used a modified Neuropathy Disability Score (NDS), which is based on the assessment of ankle reflexes and sensory modalities on the big toes of both feet, and scored ankle reflexes (0, normal; 1, present with reinforcement; 2, absent), vibration with a 128-Hz tuning fork, pinprick with Neurotip (Owen Mumford, Oxford), and temperature sensa-tion with tubes filled with warm and cool water (0, normal; 1, abnormal). Final scores of 3–5, 6–8 and 9–10 were considered to be evidence of mild, moderate and severe clinical neuropathy, respectively.9 10 12
Quantitative sensory testing
The vibration perception threshold (VPT) was evaluated with
a neurothesiometer (Horwell, Wilford Industrial Est,
Nottingham, UK). The lowest voltage at which the patient could perceive the vibration stimulus on the distal pulp of the big toe was recorded and the mean of three readings for each foot was considered. VPT values above age-related normal values were defined as abnormal.13
Heat detection threshold (HDT) was evaluated with the
Thermoskin (Medimatica, Teramo, Italy).14 The lowest
temperature that the patient perceived as a warm sensation at the dorsum of the foot, throughout three consecutive readings for each foot, was recorded. The relative HDT, which is derived by subtracting the skin temperature, was used for analysis. HDT temperatures of 4
˚
C and 7˚
C above the skin temperature for patients aged ,60 years and .60 years, respectively, were considered to be abnormal.14Electrophysiological studies
Nerve conduction studies were carried out on both tibial and sural nerves and the left peroneal nerve. Recordings were obtained by using Medtronic Keypoint EMG equipment (Skovlunde, Denmark). All studies were conducted with surface electrodes, using a standardised technique described
previously.15 16The amplitudes of compound muscle action
potentials and sensory nerve action potentials, distal motor latencies, motor and sensory conduction velocities and tibial minimal F-wave latencies were measured. For electrophysio-logical parameters, z scores were calculated from values of healthy volunteers obtained by similar techniques.15 16Results
of electrodiagnostic studies were considered to be abnormal if at least one pathological parameter was found in two of the five nerves that were examined.15
Cardiovascular autonomic function tests
Four cardiovascular tests were conducted according to standard procedure and evaluated by using age-related reference values.17The expiration:inspiration (E:I) ratio was
the ratio of the mean of the three longest R–R intervals on expiration to the mean of the three shortest R–R intervals on inspiration during 1 min of deep breathing at six breaths a minute. The lying-to-standing ratio was the ratio of the longest R–R interval around the 30th beat after standing to the shortest R–R interval around the 15th beat after standing. The Valsalva ratio was the ratio of the longest R–R interval after the manoeuvre of breathing against a resistance of 40 mm Hg for 15 s to the shortest R–R interval during the manoeuvre. Postural hypotension was defined as a fall in systolic pressure of at least 20 mm Hg on standing
(border-line values 10–19 mm Hg).18 Autonomic neuropathy was
diagnosed if at least one test result was abnormal.17 An
autonomic function score was obtained by scoring each test (0, normal; 1, borderline; 2, abnormal). The range was 0–8.
Diabetic neuropathy was diagnosed if at least three of five diagnostic modalities among symptoms, signs, quantitative sensory testing, electrodiagnostic and autonomic function tests were abnormal.19
Laser Doppler iontophoresis
Each patient was evaluated after a 20-min acclimatisation
period in a warm environment (23–24
˚
C). The blood flowresponses to iontophoresis of 1% Ach chloride solution were assessed at the volar surface of the forearm and at the dorsum of both feet with two single-point laser probes and a DRT4 Laser Doppler Blood Flow Monitor (Moor Instruments, Millwey, Devon, England). The laser Doppler protocol has been described in detail previously.7
Briefly, the iontophoresis delivery vehicle device, which is firmly attached to the patient’s skin, consists of a chamber that accommodates two single-point laser probes: one probe is in direct contact with the iontophoresis fluid and measures the vasodilatation relating to direct stimulation of the endothelial cells by Ach; the other probe is located in the centre of the chamber, is not in direct contact with the iontophoresis fluid and measures the vasodilatation relating to the stimulation of the local C-fibres by Ach (neurovascular response).20The baseline blood flow was measured for 40 s.
Iontophoresis was carried out for 60 s with a constant current of 200 mA. The vasodilative response was measured for 90 s after the iontophoresis. Two measurements per second were taken and the mean of the measurements was entered for analysis.
To assess the function of the vascular smooth muscle cells—that is, their ability to respond to vasodilating stimuli, we also evaluated the direct vasodilative response to iontophoresis of 1% sodium nitroprusside (SNP) solution at the forearm and at both feet in the first 26 patients with diabetes. SNP is a nitric oxide donor; therefore, it causes an endothelium-independent vasodilatation, but does not spe-cifically stimulate the C-fibres.21
The coefficient of variation of the single-point laser Doppler measurements, tested on five volunteers over 10 consecutive days, was 38.5% for the total response and 37.1% for the neurovascular response to Ach.
Statistical analysis
The Minitab statistical package (Minitab, State College, Pennsylvania, USA) was used for statistical analysis. For parametric data, the analysis of variance test was used, followed by the Bonferroni approach as a form of readjust-ment to the p value. The Kruskal–Wallis test was used for non-parametric data and the x2test for categorical variables.
The correlation between variables was tested with the Spearman correlation.
Receiver-operating characteristic (ROC) analysis, a widely accepted test included in the checklist for reporting on studies on diagnostic accuracy, was used to assess the accuracy of the neurovascular response in distinguishing between patients with and without diabetic neuropathy to identify its optimal cut-off point and to compare different diagnostic modalities by calculating the area under the curve (AUC).22–24
Changes in microvascular blood flow are expressed as the percentage of increase over the baseline blood flow. Parametric data are expressed as mean (SD). Non-parametric data are expressed as median (between the 25th and 75th centiles). All tests are two tailed, with significance taken as p,0.05.
RESULTS
The patients were divided into three groups according to the presence of diabetes and peripheral neuropathy—that is,
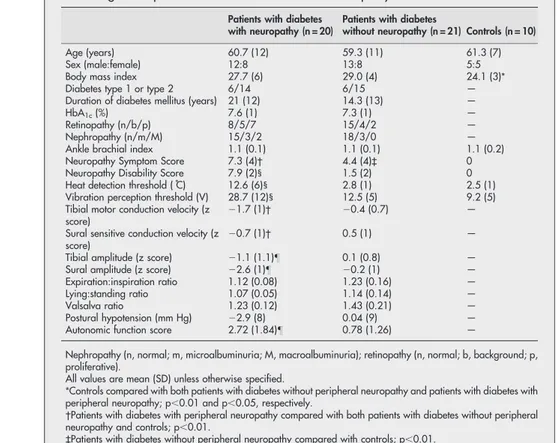
patients with diabetes with peripheral neuropathy, patients with diabetes without peripheral neuropathy and controls. We found no differences of age and sex between the three groups (table 1). The body mass index was lower in controls than in patients with diabetes without peripheral neuropathy and in patients with diabetes with peripheral neuropathy, whereas no differences were observed between the two diabetic groups of patients with diabetes with regard to the other clinical parameters. The ankle brachial index was within the normal range in all groups, as established in the inclusion criteria. As shown in table 1, patients with diabetes with peripheral neuropathy had lower scores on all tests, with the exception of the cardiovascular tests, than patients with diabetes without peripheral neuropathy. This was also the case when comparing the tests in common between patients with diabetes with peripheral neuropathy and controls.
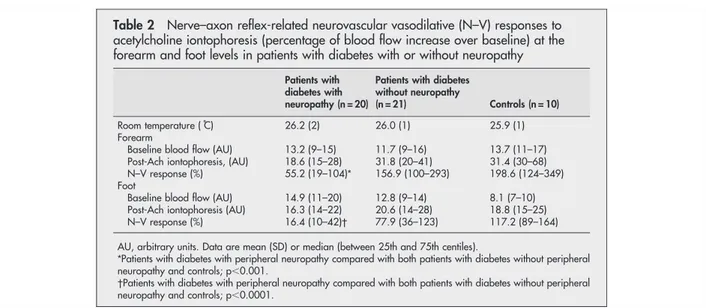
Table 2 shows the results of the nerve–axon reflex-related (neurovascular) responses to Ach iontophoresis in the three groups. We observed no significant differences in the baseline blood flow between patients with diabetes with peripheral neuropathy, patients with diabetes without peripheral neuropathy and controls at both the forearm and foot levels. The neurovascular responses at both the forearm and foot levels were markedly reduced in patients with diabetes with peripheral neuropathy compared with patients with diabetes without peripheral neuropathy and controls, whereas we observed no differences in the neurovascular responses between patients with diabetes without peripheral neuro-pathy and controls at both levels.
The direct vasodilative response to SNP iontophoresis was also evaluated at the forearm and foot levels in the first 26
patients with diabetes. We found no differences in the endothelium-independent vasodilatation between patients with and without diabetic neuropathy at both the forearm (98.4 (78–200) v 87.8 (67–179); p: non-significant) and foot (75.5 (43–148) v 107.8 (65–149); p: non-significant) levels.
When all patients with diabetes were considered as one group, Spearman’s correlation analysis showed significant correlations among the neurovascular response to Ach at the foot level and measurements of nerve function. More specifically, significant correlations were observed between
the neurovascular response and HDT (rs= 20.658; p,0.0001;
fig 1), NDS (rs= 20.665; p,0.0001), VPT (rs= 20.548;
p = 0.0005), tibial nerve conduction velocity (rs= 0.631;
p = 0.0002), sural nerve amplitude (rs= 0.581; p = 0.0002),
expiration:inspiration ratio (rs= 0.538; p = 0.0015), Valsalva
ratio (rs= 0.464; p = 0.0068) and autonomic function score
(rs= 20.378; p = 0.0252). We observed no correlation
between the neurovascular response and symptoms of peripheral neuropathy (rs= 20.122; p: non-significant).
No correlation was observed between the neurovascular response at the forearm and any neuropathy measurement or between the endothelium-independent vasodilatation at both the forearm and foot levels and any measure of nerve function.
Furthermore, when patients were stratified according to the severity of clinical somatic neuropathy, on the basis of the NDS measurement, those patients who were classified as having mild neuropathy showed a considerably reduced neurovascular response compared with that of patients without neuropathy (fig 2). We found no marked differences in the neurovascular response among the three neuropathic groups.
Table 1 Clinical characteristics and neuropathy measurements of 51 patients divided according to the presence or absence of diabetic neuropathy
Patients with diabetes with neuropathy (n = 20)
Patients with diabetes
without neuropathy (n = 21) Controls (n = 10) Age (years) 60.7 (12) 59.3 (11) 61.3 (7)
Sex (male:female) 12:8 13:8 5:5
Body mass index 27.7 (6) 29.0 (4) 24.1 (3)* Diabetes type 1 or type 2 6/14 6/15 — Duration of diabetes mellitus (years) 21 (12) 14.3 (13) —
HbA1c(%) 7.6 (1) 7.3 (1) —
Retinopathy (n/b/p) 8/5/7 15/4/2 — Nephropathy (n/m/M) 15/3/2 18/3/0 — Ankle brachial index 1.1 (0.1) 1.1 (0.1) 1.1 (0.2) Neuropathy Symptom Score 7.3 (4)! 4.4 (4)` 0 Neuropathy Disability Score 7.9 (2)1 1.5 (2) 0 Heat detection threshold (˚C) 12.6 (6)1 2.8 (1) 2.5 (1) Vibration perception threshold (V) 28.7 (12)1 12.5 (5) 9.2 (5) Tibial motor conduction velocity (z
score)
21.7 (1)! 20.4 (0.7) — Sural sensitive conduction velocity (z
score)
20.7 (1)! 0.5 (1) —
Tibial amplitude (z score) 21.1 (1.1)" 0.1 (0.8) — Sural amplitude (z score) 22.6 (1)" 20.2 (1) — Expiration:inspiration ratio 1.12 (0.08) 1.23 (0.16) — Lying:standing ratio 1.07 (0.05) 1.14 (0.14) — Valsalva ratio 1.23 (0.12) 1.43 (0.21) — Postural hypotension (mm Hg) 22.9 (8) 0.04 (9) — Autonomic function score 2.72 (1.84)" 0.78 (1.26) —
Nephropathy (n, normal; m, microalbuminuria; M, macroalbuminuria); retinopathy (n, normal; b, background; p, proliferative).
All values are mean (SD) unless otherwise specified.
*Controls compared with both patients with diabetes without peripheral neuropathy and patients with diabetes with peripheral neuropathy; p,0.01 and p,0.05, respectively.
!Patients with diabetes with peripheral neuropathy compared with both patients with diabetes without peripheral neuropathy and controls; p,0.01.
`Patients with diabetes without peripheral neuropathy compared with controls; p,0.01.
1Patients with diabetes with peripheral neuropathy compared with both patients with diabetes without peripheral neuropathy and controls; p,0.001.
"Patients with diabetes with peripheral neuropathy compared with both patients with diabetes without peripheral neuropathy and controls; p,0.05.
Finally, we verified the accuracy of the neurovascular response in distinguishing patients with diabetes with neuropathy from those without peripheral neuropathy by using the ROC analysis (fig 3). The AUC for the neurovas-cular response was 0.83, confirming the validity of this method in predicting diabetic neuropathy. Moreover, a cut-off value of 50% was shown to have a good sensitivity (90%) and an acceptable specificity (74%) in identifying patients with diabetes with peripheral neuropathy. We observed no significant differences between the AUC for the neurovas-cular response and those for the other diagnostic modalities. Table 3 shows the diagnostic accuracy of different instru-mental modalities for comparison.
DISCUSSION
The main finding from this study is the validation of the neurovascular response at the foot level as an accurate tool for assessing diabetic neuropathy. We identified a cut-off value of neurovascular response ,50% to be highly sensitive in distinguishing between patients with and without diabetic neuropathy. Moreover, we found that this response was already reduced in patients with mild peripheral neuropathy, indicating that this abnormality may represent an early event in the natural history of diabetic neuropathy. Finally, we confirmed and extended the observation that the neurovas-cular response correlated with various measures of peripheral nerve function and, specifically, with measures testing small nerve fibres.
In a previous study, we showed that the neurovascular
response correlates with measurements of nerve function.7
That study, however, had a smaller sample of patients, most of whom had moderate to severe diabetic neuropathy, and did not test small nerve fibres with the currently available state-of-the-art techniques. The present study included patients with diabetes with varying degrees of peripheral nerve impairment and assessed small-fibre function by evaluating the temperature sensation and autonomic func-tion. Thus, this study showed that the neurovascular response strongly correlated with the two aforementioned test methods, supporting the conclusion that this diagnostic tool specifically evaluated small fibre integrity.
Although the neurovascular response assessment did not permit distinguishing between patients with different degrees of peripheral neuropathy, we showed that this response was already markedly reduced in the early stages of diabetic nerve impairment. This finding suggests that the loss of the neurovascular response represents an early marker of nerve function impairment, whereas other quantitative sensory tests are still in the normal range.25 26This renders
neurovascular response assessment even more appealing, as Table 2 Nerve–axon reflex-related neurovascular vasodilative (N–V) responses to
acetylcholine iontophoresis (percentage of blood flow increase over baseline) at the forearm and foot levels in patients with diabetes with or without neuropathy
Patients with diabetes with neuropathy (n = 20)
Patients with diabetes without neuropathy
(n = 21) Controls (n = 10) Room temperature (˚C) 26.2 (2) 26.0 (1) 25.9 (1) Forearm
Baseline blood flow (AU) 13.2 (9–15) 11.7 (9–16) 13.7 (11–17) Post-Ach iontophoresis, (AU) 18.6 (15–28) 31.8 (20–41) 31.4 (30–68) N–V response (%) 55.2 (19–104)* 156.9 (100–293) 198.6 (124–349) Foot
Baseline blood flow (AU) 14.9 (11–20) 12.8 (9–14) 8.1 (7–10) Post-Ach iontophoresis (AU) 16.3 (14–22) 20.6 (14–28) 18.8 (15–25) N–V response (%) 16.4 (10–42)! 77.9 (36–123) 117.2 (89–164) AU, arbitrary units. Data are mean (SD) or median (between 25th and 75th centiles).
*Patients with diabetes with peripheral neuropathy compared with both patients with diabetes without peripheral neuropathy and controls; p,0.001.
!Patients with diabetes with peripheral neuropathy compared with both patients with diabetes without peripheral neuropathy and controls; p,0.0001.
0 50 100 150 200 250 300 350 400 0 5 10 15 20
Heat detection threshold (°C) rs = _ 0.658 p!0.0001
N–V
response
(%)
Figure 1 Correlation between the heat detection threshold, which specifically evaluates functions of the small myelinated and unmyelinated fibres and the neurovascular (N–V) response at the foot level.
0 20 40 60 80 100 120 140 160 180
C D DN mild DN moderate DN severe *
*
Blood flow increase over baseline (%)
Figure 2 The nerve–axon reflex-related vasodilatation at the foot level in the population of patients with diabetes, stratified on the basis of the Neuropathy Disability Score in controls (n = 10), patients without neuropathy (n = 17), with mild neuropathy (mild; n = 6), with moderate neuropathy (moderate; n = 8) and with severe neuropathy (severe; n = 10). Median (between 25th and 75th centiles). *Controls and patients with diabetes without peripheral neuropathy versus patients with diabetes with peripheral neuropathy—mild; patients with diabetes with peripheral neuropathy—moderate; and patients with diabetes with peripheral neuropathy—severe; p = 0.001. C, controls; D, diabetes; DN, diabetic neuropathy.
it permits a reliable detection of subclinical neuropathy when therapeutic intervention can be of maximal help.
The early impairment of the neurovascular response in patients with diabetes may be related to an inability of the vascular smooth muscle cells to respond to the
vasomodu-lators released by C-fibres.27 The endothelium-independent
vasodilatation that specifically evaluates the function of the vascular smooth-muscle cells, however, was not different between patients with diabetes with and without neuropathy or among patients with different degrees of neuropathy (data not reported), not supporting this hypothesis.
The neurovascular response was also reduced at the forearm, an area that is generally spared by severe neuro-pathy, in patients with diabetic neuropathy compared with
those without neuropathy.28 It is believed that the
micro-angiopathic processes, leading to the development of overt nerve damage, are accelerated in the lower limbs compared with the upper limbs because of increased systemic
pres-sure.27 29 The finding that the neurovascular response is
impaired at the forearm of patients with diabetes with clinical neuropathy of the lower extremities supports the hypothesis that the loss of this response is an early event.
With the ROC analysis, we identified a cut-off of 48% as the value of the neurovascular response with high
sensit-ivity and an acceptable specificity in distinguishing
between patients with and without an established diagnosis of diabetic neuropathy. When comparing all diagnostic
measures, a neurovascular response ,50% had the best sensitivity and the lowest specificity. As this diagnostic test should be of value in screening for early neuropathy, the cut-off value that is set in this study is optimal to this purpose. On the contrary, the HDT showed itself to be highly specific, although less sensitive. The thermal threshold determination, however, is associated with a higher variability.30
The neurogenic axon flare induced by intradermal elec-trical stimulation and the axon reflex associated with skin
heating to 44
˚
C are recently proposed techniques used toassess small-fibre function by laser Doppler imaging.31 32
Although these techniques share the same physiological background as the neurovascular response to Ach, no data are available at the moment to make any comparison. The intradermal electrical stimulation technique, however, is more invasive and painful and the axon reflex with skin
heating to 44
˚
C is slightly more traumatic than theiontophoresis for patients without neuropathy.
Punch-skin biopsy is a relatively reproducible and reliable technique to quantify the epidermal nerve fibres by immu-nostaining with anti-protein-gene-product 9.5 antibodies.33 34
Compared with the nerve–axon reflex assessment, however, this technique is quite invasive and requires specific training in an established cutaneous nerve laboratory.34
The Quantitative Sudomotor Axon Reflex Test (QSART)
measures the severity and pattern of autonomic deficit.35
Given that autonomic dysfunction does not necessarily reflect impairment in somatic function, QSART and neurovascular response may have different and integrated clinical applica-tions.
Thus, nerve–axon reflex assessment is a valid tool for testing C-fibres, with the advantage of evaluating peripheral C-fibres themselves rather than the nervous pathway as a whole. This technique does not require the cooperation of the patients, is not invasive or time consuming, permits serial analysis and requires only a short training period. One disadvantage is that it cannot be used if the patient has peripheral vascular disease.6
In conclusion, this study validated the nerve–axon reflex-related vasodilatation for assessing small nerve fibre func-tion. The technique has the potential to identify patients with diabetes with early neuropathy and can be used to assess therapeutic interventions to prevent or reverse C-fibre dysfunction.
Authors’ affiliations
. . . .
A Caselli, V Spallone, C Battista, L Uccioli, Department of Internal Medicine, University of Tor Vergata, Rome, Italy
G A Marfia, C Pachatz, Department of Neurological Sciences, University of Tor Vergata
A Veves, Joslin-Beth Israel Deaconess Foot Center, Department of Surgery, Microcirculation Laboratory, Beth Israel-Deaconess Medical Center, Harvard Medical School, Boston, Massachusetts, USA Competing interests: None.
0 0.2 0.4
True negative fraction (1–specificity)
0.6 0.8 1 1 0.8 0.6 0.4 0.2 0 True positive fraction (sensitivity)
Figure 3 Receiving operator characteristics plot showing the diagnostic accuracy of nerve–axon reflex-related vasodilatation in distinguishing between patients with or without an established diagnosis of diabetic neuropathy, on the basis of the presence of three of five abnormal diagnostic modalities among symptoms, signs, quantitative sensory tests, electrodiagnosis and autonomic function tests. Area under the curve = 0.83 (95% confidence interval 0.7 to 0.9). The arrow indicates the cut-off value of 48.3% with a sensitivity of 89% and a specificity of 62%.
Table 3 Diagnostic accuracy of different modalities in identifying patients with diabetes with and without peripheral neuropathy
Test Sensitivity (%) Specificity (%) PPV (%) NPV (%)
N–V response (,50%) 90 74 78 88
VPT (.age-related normal values) 75 84 83 76 HDT (.4˚C or .7˚C depending on age) 85 100 100 86 Autonomic tests (abnormality in 1 of 4
tests)
61 82 79 67
Electrophysiology (abnormality in 2 of 5 nerves)
84 89 89 85
HDT, heat detection threshold; N–V, neurovascular; NPV, negative predictive value; PPV, positive predictive value; VPT, vibration perception threshold.
Ethical approval: The necessary ethics committee approval was secured for the study. The study was approved by the local ethics committee of the Tor Vergata Hospital in Rome and each patient signed a written informed consent.
Part of the study was presented at the 40th Annual Meeting of the European Association for the Study of Diabetes, Mu¨nich, 5–9 September 2004, and published as an abstract (Diabetologia 2004;47(Suppl 1):A34).
REFERENCES
1 Watkins PJ, Edmonds ME. Clinical features of diabetic neuropathy. In: Pickup J, Williams G, eds. Textbook of diabetes. Oxford: UK Blackwell Scientific, 1997;50:1–20.
2 Valensi P, Attali JR, Gagant S. Reproducibility of parameters for assessment of diabetic neuropathy. The French Group for Research and Study of Diabetic Neuropathy. Diabetes Med 1993;10:933–9.
3 Arezzo JC. New developments in the diagnosis of diabetic neuropathy. Am J Med 1999;107:S9–16.
4 Parkhouse N, Le Quesne PM. Impaired neurogenic vascular response in patients with diabetes and neuropathic foot lesions. N Engl J Med 1988;318:1306–9.
5 Lewis T. The blood vessels of the human skin and their responses. In: Shaw, Sons, eds. London: Oxford University Press, 1927;.
6 Hamdy O, Abou-Elenin K, LoGerfo FW, et al. Contribution of nerve-axon reflex-related vasodilation to the total skin vasodilation in diabetic patients with and without neuropathy. Diabetes Care 2001;24:344–9.
7 Caselli A, Rich J, Hanane T, et al. Role of C-nociceptive fibers in the nerve axon reflex-related vasodilation in diabetes. Neurology 2003;60:297–300. 8 American Diabetes Association. Diagnosis and classification of diabetes
mellitus. Diabetes Care 2005;28(Suppl 1):S37–42.
9 Young MJ, Boulton AJ, MacLeod AF, et al. A multicentre study of the prevalence of diabetic peripheral neuropathy in the United Kingdom hospital clinic population. Diabetologia 1993;36:150–4.
10 Pham H, Armstrong DG, Harvey C, et al. Screening techniques to identify people at high risk for diabetic foot ulceration: a prospective multicenter trial. Diabetes Care 2000;23:606–11.
11 Boulton AJ, Malik RA, Arezzo JC, et al. Diabetic somatic neuropathies. Diabetes Care 2004;27:1458–86.
12 Donaghue VM, Giurini JM, Rosenblum BI, et al. Variability in function measurements of three sensory foot nerves in neuropathic diabetic patients. Diabetes Res Clin Pract 1995;29:37–42.
13 Wiles PG, Pearce SM, Rice PJ, et al. Vibration perception threshold: influence of age, height, sex, and smoking, and calculation of accurate centile values. Diabetes Med 1991;8:157–61.
14 Liniger C, Albeanu A, Moody JF, et al. The Thermocross: a simple tool for rapid assessment of thermal sensation thresholds. Diabetes Res Clin Pract 1991;12:25–33.
15 Falck B, Stalberg E, Bischoff C. Sensory nerve conduction studies with surface electrodes. Methods Clin Neurophysiol 1994;5:1–20.
16 Stalberg E, Falck B. Clinical motor nerve conduction studies. Methods Clin Neurophysiol 1993;4:61–80.
17 Ewing DJ. Analysis of heart rate variability and other non-invasive tests with special reference to diabetes mellitus. In: Bannister R, Mathias CJ, eds. Autonomic failure. 3rd edn. Vol 16. Oxford: Oxford University Press, 1992:312–33.
18 Anon. Consensus statement on the definition of orthostatic hypotension, pure autonomic failure, and multiple system atrophy. The Consensus Committee of the American Autonomic Society and the American Academy of Neurology. Neurology 1996;46:1470.
19 Consensus Statement. Report and recommendations of the San Antonio conference on diabetic neuropathy. Diabetes 1988;37:1000–4. 20 Walmsley D, Wiles PG. Assessment of the neurogenic flare response as a
measure of nociceptor C fibre function. J Med Eng Technol 1990;14:194–6. 21 Morris SJ, Shore AC, Tooke JE. Responses of the skin microcirculation to
acetylcholine and sodium nitroprusside in patients with NIDDM. Diabetologia 1995;38:1337–44.
22 Zweig MH, Campbell G. Receiver-operating characteristic (ROC) plots: a fundamental evaluation tool in clinical medicine. Clin Chem
1993;39:561–77.
23 Bruns DE, Huth EJ, Magid E, et al. Toward a checklist for reporting of studies of diagnostic accuracy of medical test. Clin Chem 2000;46:893–5. 24 Metz CE. Rockit 0.9.1B Beta Version. Apple MacintoshTMversion. February,
1998.
25 Veves A, Young MJ, Manes C, et al. Differences in peripheral and autonomic nerve function measurements in painful and painless neuropathy. A clinical study. Diabetes Care 1994;17:1200–2.
26 Herrmann DN, Griffin JW, Hauer P, et al. Epidermal nerve fiber density and sural nerve morphometry in peripheral neuropathies. Neurology
1999;53:1634–40.
27 Vinik AI, Erbas T, Park TS, et al. Methods for evaluation of peripheral neurovascular dysfunction. Diabetes Technol Ther 2001;3:29–50. 28 Stansberry KB, Peppard HR, Babyak LM, et al. Primary nociceptive afferents
mediate the blood flow dysfunction in non-glabrous (hairy) skin of type 2 diabetes: a new model for the pathogenesis of microvascular dysfunction. Diabetes Care 1999;22:1549–54.
29 Vinik AI, Erbas T, Park TS, et al. Dermal neurovascular dysfunction in type 2 diabetes. Diabetes Care 2001;24:1468–75.
30 Gelber DA, Pfeifer MA, Broadstone VL, et al. Components of variance for vibratory and thermal threshold testing in normal and diabetic subjects. J Diabetes Complications 1995;9:170–6.
31 Kramer HH, Schmelz M, Birklein F, et al. Electrically stimulated axon reflexes are diminished in diabetic small fiber neuropathies. Diabetes
2004;53:769–74.
32 Krishnan ST, Rayman G. The LDIflare: a novel test of C-fiber function demonstrates early neuropathy in type 2 diabetes. Diabetes Care 2004;27:2930–5.
33 Kennedy WR, Wendelschafer-Crabb G. Utility of skin biopsy in diabetic neuropathy. Semin Neurol 1996;16:163–71.
34 Lauria G, Cornblath DR, Johansson O, et al. EFNS guidelines on the use of skin biopsy in the diagnosis of peripheral neuropathy. Eur J Neurol 2005;12:747–58.
35 Itoh H, Uebori S, Asai M, et al. Early detection of orthostatic hypotension by quantitative sudomotor axon reflex test (QSART) in type 2 diabetic patients. Intern Med 2003;42:560–4.