Politecnico di Milano
D
EPARTMENT OF
C
IVIL
&
E
NVIRONMENTAL
E
NGINEERING
S
CHOOL OFC
IVIL,
E
NVIRONMENTAL ANDL
AND MANAGEMENTE
NGINEERINGM
ASTER
T
HESIS
T
HE
BIM
APPROACH
:
A COMBINED ANALYSIS
ON COSTS AND ENERGY SAVINGS OF A PROJECT
Andrea MACCHI, ID: 905617
Pasquale PERRI, ID: 892134
ADVISOR:
Prof. Carlo Iapige D
E
G
AETANI
CONTENTS
Contents ... I List of figures ... III List of tables ... VI Ringraziamenti ... VIII Abstract ... IX
1 Introduction ... 1
1.1 AEC Industry and BIM technology ... 1
1.2 Energy consumption problem ... 7
1.3 Literature review ... 8
2 Proposed methodology ... 13
2.1 Geometrical characterization of a BIM model ... 13
2.2 Energy analysis ... 15
2.3 Cost processing and comparison of design alternatives ... 17
3 Validation of the proposed methodological framework ... 19
3.1 Case study ... 19 3.1.1 Walls alternatives... 21 3.1.2 Roof alternatives ... 26 3.1.3 Floor alternatives ... 28 3.1.4 Windows alternatives ... 30 3.1.5 Window-to-wall-ratios values ... 32
3.3 Construction costs evaluation ... 48
3.4 Maintenance costs estimation ... 53
3.5 Energy consumption analysis on Green Building Studio ... 55
3.5.1 Energy settings on Revit ... 55
3.5.2 Green Building Studio analysis ... 60
3.6 Evaluation of main and interaction effects ... 63
4 Results discussion ... 72
4.1 Main effect results ... 72
4.2 Investment ratios comparison ... 76
4.2.1 Investment ratios based on interaction effects... 82
5 Conclusions ... 88
References ... 93
Appendix A ... 98
Walls and roof quotations ... 98
Foamglas floor quotations ... 103
Windows transmittance and quotations ... 104
Appendix B ... 109
Walls price list entries ... 109
Roof price list entries ... 115
Floor price list entries ... 121
Doors and windows price list entries... 126
Appendix C ... 131
Maintenance price list entries ... 131
LIST OF FIGURES
Figure 1 Differences between Traditional and Integrated Project Delivery [4] ... 2
Figure 2 The MacLeamy Curve (2004) [5] ... 3
Figure 3 Conceptual Framework of Building Information Modeling [10] ... 4
Figure 4 BIM dimensions [11] ... 7
Figure 5 Workflow diagram ... 13
Figure 6 Energy Use Intensity calculation [29] ... 16
Figure 7 Spaces layout ... 20
Figure 8 External walls 1 stratigraphy and data ... 22
Figure 9 Internal walls 1 stratigraphy and data [33]... 23
Figure 10 External walls 2 stratigraphy and data ... 24
Figure 11 Internal walls 2 stratigraphy and data ... 25
Figure 12 Roof stratigraphy and data ... 27
Figure 13 Wooden structure of the roof adopted [34] ... 28
Figure 14 Floor 1 stratigraphy and composition ... 29
Figure 15 Floor 2 stratigraphy and composition ... 30
Figure 16 WWR 1 layout, South-West (left) and North-East (right) views ... 33
Figure 17 WWR 2 layout, South-West (left) and North-East (right) views ... 33
Figure 18 WWR 3 layout, South-West (left) and North-East (right) views ... 34
Figure 19 Revit stratigraphy adopted for external walls 1 – Milan ... 35
Figure 20 Revit stratigraphy adopted for external walls 1 – Livigno ... 35
Figure 21 Revit stratigraphy adopted for external walls 2 – Milan and Livigno ... 36
Figure 22 Revit thermal properties tab ... 36
Figure 23 Poroton P800 appearance and thermal properties ... 37
Figure 24 Revit stratigraphy adopted for roof 1 – Milan ... 39
Figure 26 Revit stratigraphy adopted for roof 2 – Milan and Livigno ... 39
Figure 27 Wooden structure of the roof modeled on Revit ... 42
Figure 28 Revit stratigraphy adopted for floor 1 – Milan ... 44
Figure 29 Revit stratigraphy adopted for floor 1 – Livigno ... 44
Figure 30 Revit stratigraphy adopted for floor 1 – Milan and Livigno ... 44
Figure 31 Model thermal properties of floor 1 - Milan ... 44
Figure 32 Model thermal properties of floor 1 - Livigno ... 45
Figure 33 Model thermal properties of floor 2 – Milan and Livigno ... 45
Figure 34 Windows properties added into the XML file Constructions ... 46
Figure 35 Windows types used in the Revit model ... 47
Figure 36 Windows schedule obtained from Revit ... 50
Figure 37 Doors schedule obtained from Revit ... 51
Figure 38 Wooden structural system schedule obtained from Revit ... 51
Figure 39 Walls material takeoff schedule ... 52
Figure 40 Roof material takeoff schedule ... 52
Figure 41 Floor material takeoff schedule ... 52
Figure 42 Location configuration for Milan on Revit ... 55
Figure 43 Location configuration for Livigno on Revit ... 56
Figure 44 Energy Settings window on Revit ... 56
Figure 45 Advanced Energy Settings window on Revit ... 57
Figure 46 3D Energy Model view on Revit ... 59
Figure 47 Screenshot of a run on Green Building Studio ... 60
Figure 48 Building Details and Assumptions panel on GBS ... 61
Figure 49 GBS assumption on temperature during the year ... 62
Figure 50 Costs trend related to energy consumption during the year ... 62
Figure 51 “Annual Electric End Use” pie charts ... 63
Figure 52 "Model 1" total cost trend plot ... 65
Figure 53 Main effects - Total construction costs for "Walls 1" and "Walls 2" ... 66
Figure 54 Walls main effect calculation concept ... 66
Figure 56 Floor main effect calculation concept ... 67
Figure 57 WWR main effect calculation concept ... 67
Figure 58 Main effects - EUI for "Walls 1" and "Walls 2" ... 68
Figure 59 Example of interaction effect concept ... 69
Figure 60 Interaction plot – EUI for walls and roof ... 70
Figure 61 Interaction plot – Total construction costs for walls and roof ... 70
Figure 62 Main effects - Windows & WWR for Livigno ... 73
Figure 63 Main effects (Milan) - EUI ... 74
Figure 64 Main effects (Livigno) - EUI ... 74
Figure 65 Main effects (Milan) – Total construction costs ... 74
Figure 66 Main effects (Livigno) – Total construction costs ... 74
Figure 67 Main effects (Milan) - Total costs after 50 years ... 75
Figure 68 Main effects (Livigno) - Total costs after 50 years ... 75
Figure 69 Main effects (Milan) - Total costs after 100 years ... 75
Figure 70 Main effects (Livigno) - Total costs after 100 years ... 75
Figure 71 Investment ratios trend – Milan ... 77
Figure 72 Investment ratios trend – Livigno ... 77
Figure 73 EUI comparison between Milan and Livigno ... 79
Figure 74 Interaction plot - EUI ... 82
Figure 75 Interaction plot – Total construction costs ... 83
Figure 76 Interaction plot – Total costs after 50 years ... 83
Figure 77 Interaction plot – Total costs after 100 years ... 84
LIST OF TABLES
Table 1 Limit values of thermal transmittance ... 20
Table 2 Walls typologies adopted ... 21
Table 3 Roof typologies adopted ... 26
Table 4 Floor typologies adopted ... 28
Table 5 Windows typologies adopted ... 30
Table 6 Windows typologies for Milan ... 31
Table 7 Windows typologies for Livigno ... 32
Table 8 WWR 1 calculations ... 33
Table 9 WWR 2 calculations ... 33
Table 10 WWR 3 calculations ... 33
Table 11 Run alternatives, from 1 to 16 ... 34
Table 12 Run alternatives, from 17 to 32 ... 34
Table 13 Run alternatives, from 33 to 48 ... 34
Table 14 Comparison between real and model thermal properties of external walls .. 38
Table 15 Comparison between real and model thermal properties of the roof ... 41
Table 16 Naturaflex cost computation from price list ... 49
Table 17 Maintenance program ... 54
Table 18 "Model 1" total cost trend ... 65
Table 19 Impact on energy consumption of the different building components ... 76
Table 20 Impact on construction costs of the different building components ... 76
Table 21 Investment ratio values – Milan ... 78
Table 22 Investment ratio values – Livigno ... 78
Table 23 Investment ratio ranking up to 35 years ... 80
Table 24 Investment ratio ranking up to 45 years ... 81
Table 26 Investment ratio ranking up to 100 years ... 82
Table 27 Investment ratio values for intervention on combination of elements ... 85
Table 28 Combined investment ratio ranking up to 35 years ... 86
Table 29 Combined investment ratio ranking up to 45 years ... 86
Table 30 Combined investment ratio ranking up to 55 years ... 87
RINGRAZIAMENTI
Un primo grande ringraziamento va alle nostre famiglie e alle persone care che ci hanno sostenuto, in questi anni di studio, con continui sacrifici, consigli ed affetto. Grazie per il supporto nei momenti più faticosi e per aver condiviso la gioia di ogni traguardo.
Ringraziamo, inoltre, tutti i compagni di studio conosciuti in questi anni: grazie per l’aiuto nell’affrontare le varie prove che il Politecnico ci ha posto dinanzi, ma soprattutto per i momenti di svago passati assieme che hanno permesso la nascita veri rapporti d’amicizia che dureranno nel tempo, nonostante la lontananza.
Infine vorremmo ringraziare tutte le persone che hanno contribuito a rendere questa tesi completa e interessante: in primis il Prof. De Gaetani che, grazie alla sua disponibilità nel confrontarsi con noi con continuità e alla pari, ha reso possibile un benefico scambio di idee e intuizioni che ci ha stimolati ad ampliare e rendere più esaustivo il nostro lavoro.
Non vogliamo, inoltre, dimenticare tutte le figure professionali esterne al Politecnico. In particolare, un sentito ringraziamento va al Sig. Tiziano Lucca, al Geom. Luca Gregori e all’Arch. Cristina Niada. Grazie per la pazienza avuta nel fornirci continuo aiuto e per l’interessamento dimostrato verso il nostro lavoro.
Grazie a tutti di cuore!
ABSTRACT
Buildings sector plays a central role in facing the problem of global energy consumptions. Therefore, effective design measures need to be taken to ensure an efficient usage and management of a new structure, starting from the early stages of construction. The challenging task for the designers is to reduce energy demands, while keeping high quality of the indoor environment. The correct application of BIM technology can be a valid solution for this challenge. This study proposes a methodological framework that enables decision-makers to resolve conflicts between thermal comfort, energy demand and lifecycle costs. A realistic case of study is analysed to validate the proposed method, adopting different solutions for walls, roof, floor, windows, window-to-wall-ratios and geographical locations. Revit building models are created on the basis of all the possible combinations between these elements, correctly reporting their thermal properties and construction costs, consulting price lists and quotations. The 96 obtained models are then uploaded to Green Building Studio to carry out energy analysis, providing an estimation of consumptions and related annual costs. By calculating the total cost of each model, as the sum of construction, energy and maintenance costs, it is possible to compute an “investment ratio” that takes into account the interaction between costs and consumptions of the different design alternatives, allowing the evaluation of the building elements with the greatest impact with respect to this analysis, in function of a variable lifecycle. The results obtained for the proposed method confirm the validity of such approach based on BIM technology. In fact, designers are able to make accurate choices already in the early stages of the project that will lead to the optimization of future energy
1
INTRODUCTION
1.1 AEC Industry and BIM technology
The AEC (Architecture, Engineering and Construction) industry consists of separate players who work together to bring a project to fruition [1]. The most common traditional design and construction methods used in the industry are known as Design-Bid-Build, Design-Build and Construction Management at Risk [2].
In general, these approaches have the same limitation: there is a big fragmentation of the information that are not shared between the members of the different team involved in the various project phases. The three major and most common problems related to poor information exchange are the following: costly errors in design/construction, time wasting in making decisions and shorter life-span of design/construction projects due to poor judgement [3].
For these reasons, another approach called Integrated Project Delivery has become increasingly popular in the AEC industry. The main goal of this method is to create an environment in which each team can work together sharing information during the development of the project.
IPD is based on three main objectives. First, it is fundamental to align the interest of the key project team participants with the project mission. Indeed, one of the main problems of traditional approaches is the fragmentation of works among participants that leads to many different interests involved and different responsibility.
Another important aim is to increase efficiency in all phases of the project. In general, by promoting better collaboration and interoperability, a more detailed and precise project is expected [4]. Finally, the IPD approach proposes to reduce waste. Due to the nature of traditional approaches, indeed, many mistakes occur and it is generally necessary to spend more time and more capital to complete projects than previously planned.
In the following Figure 1 the main differences between traditional approaches and IPD are reported.
Figure 1 Differences between Traditional and Integrated Project Delivery [4]
In 2004, Patrick MacLeamy drew a set of curves based on a direct observation of his works: the more an architectural project develops, the more difficult it becomes to modify [5]. Thanks to this idea, MacLeamy understood the importance of shifting the effort at the earliest stages to make modification easier and less expensive.
These ideas are well represented into a plot named as its author: the MacLeamy curve.
Figure 2 The MacLeamy Curve (2004) [5]
The concepts contained in the MacLeamy Curve are strictly related with what is at the base of IPD idea. Indeed, considering the features previously described, the use of an IPD approach involves a greater effort by all participants in the early stages of the project, in order to obtain the greatest benefits in the following phases, reducing costs and waste.
To achieve the objectives that this modern approach requires, IPD needs support from a technological point of view. For this reason, IPD concept emerges as a natural companion to the Building Information Modeling (BIM) technology. IPD is gaining popularity thanks to the expansion of the use of BIM in the AEC facility management industry [6].
Building Information Modeling encompasses the technology and the process of creating a model containing both graphical and non-graphical information regarding a building or a facility [7]. A Common Data Environment (CDE) is generated to store the digital data and these information become more and more detailed during the progress of the project phases.
US National BIM Standard (NBIMS-US) defined Building Information Modeling as a digital representation of physical and functional characteristics of a facility [8].
“As such, it serves as a shared knowledge resource for information about a facility and it is also useful to make reliable decisions for the life cycle management. Thanks to its
nature, Building Information Modeling allows and encourages collaboration by different stakeholders at different phases of the lifecycle of a facility to insert, extract, update or modify information in the model to support and reflect the roles of that stakeholder” [9], as shown in Figure 3.
Figure 3 Conceptual Framework of Building Information Modeling [10]
As it is possible to imagine, there are great differences between BIM technology and the traditional 3D CAD approach.
First of all, CAD describes a building by independent 2D views such as plans, sections and elevations. When it is necessary to update or modify one of these views, the others must be modified independently because they are not directly related among them. In general, this is one of the most common reason for errors. With a BIM based model, a modification on one view is reflected on the others and it is also reported if there are resulting errors or superposition. This feature is one the advantages to use a “parametric” modelling during the design phase.
The BIM technology is based on the object-oriented parametric modeling technique. The term “parametric” describes a process whereby if a change is made on an element, it is also reflected on adjacent elements, in order to maintain the previously established
Parametric modelling allows to change drawings at multiple scales and across fragmented drawing sheets, avoiding errors and saving time.
Another important characteristic of CAD based project, is that all the drawings are graphical entities only, such as lines or points [6].
In a BIM model, all the objects can be described as “smart” objects because they are defined in terms of building elements and systems (such as beams and columns or spaces) and they contain all information that are important to completely define itself. These data are, for example, the physical and functional characteristics or project life cycle information [6].
In addition, BIM plays a fundamental role in automation in construction. Indeed, in a BIM approach the modelling is multidimensional which means that many different aspects of the lifecycle phases of construction projects can be taken into account in addition to 3D geometry.
The possible n-dimensions of a BIM based project, listed in Figure 4, are the following [11]: geometric modelling (3D); time (4D); costs (5D); sustainability assessment (6D); facility management (7D).
The simplest dimension is the 3D BIM. This is adopted for creating graphical information that is shared in a Common Data Environment [12] that can be accessible to all the project participants in order to improve interoperability.
4D BIM dimension add the time to the model and so the purpose is to bind the set of data in the 3D modeling with project programming and scheduling data [11].Indeed, it is possible to add information to the elements about time needed for delivery, installation, realization or to become operational and also the sequence in which components should be installed [2]. This dimension could be really useful, for example, to avoid errors because of superposition of elements that could occur in different phases of construction.
5D BIM is used for budget tracking and cost analysis [11]. A model that includes this dimension, can introduce three main type of costs: construction costs, which represent the costs of material, labors, equipment and contractor's profit; usage costs related to operation and maintenance; end of life costs, which include demolition, waste collection and transportation to landfills [13].
6D BIM is related to sustainability and so it contains all the information needed to perform energy consumption analysis [11]. This dimension can be really useful to choose the best material configuration to guarantee good insulation, but also to estimate consumption related to the chosen object, like electric one related to a specific appliance. It also allows for measurement and verification during building occupation. This information provides different design configuration and it allows to choose the optimal one considering every possible aspect such as, for example, costs and time needed to carry out the project.
7D dimension extends BIM for facilities management, which is considered an integrated approach to maintain, improve and adapt buildings [12]. Since this dimension is related to a structure that is operating, it starts to be relevant after the end of construction phase and lasts over the entire operation and maintenance phase of construction projects until the end of the lifecycle of the facility. In general, a facility management program based on reliable information obtained from an “As-built” BIM provides the most effective solutions for the management of a building [2]. An “As-built” model include what it has been designed but also what it is being built during the construction phase due to subsequent variations necessary, in general, to solve operational or geometrical conflicts arising during construction [2].
Using 7D dimension, it is possible to obtain a more coherent project and any operation related to replacement, renovation or dismission becomes quicker and easier.
Considering this characterization, it is easy to guess that the higher the dimension used for the BIM, the more reliable is the construction documentations and the related quality of the project.
Figure 4 BIM dimensions [11]
1.2 Energy consumption problem
The construction industry is commonly known as “the industry of the 40%”, due to the fact that buildings produce nearly 40% of overall 𝐶𝑂2 emissions, 40% of overall waste
generation and consume 40% of overall natural resources over their entire lifespans [12]. Furthermore, in 2016 it has been estimated that in EU countries the amount of total household waste generated was 214˙240˙000 𝑡𝑜𝑛𝑠/𝑦𝑒𝑎𝑟, which 18% was recyclable [14]. Besides, the buildings’ sector accounts for half of global electricity demands and 30% of 𝐶𝑂2 emissions [15]. The overall use of electricity in buildings has grown by an average of 2,5% per year since 2010, when 𝐶𝑂2 emissions from buildings started to increase at a rate
of approximately 1% per year [15]. However, two-thirds of all countries still do not have mandatory energy codes for this sector [15].
It is interesting to notice that the majority of the energy in the construction sector is consumed during the operating phase of buildings: heating, cooling, lighting and hot water equipment [12].
Indeed, the continuous rapid socio-economic growth induces the building sector to provide continuous improvement of people’s living conditions that means a good living environment and high-demand building configuration. This leads to a growing worldwide demand for better comfort, especially in developing countries. Thus, to provide the indoor air comfort to the occupants, it is generally requested to implement mechanical means for heating and cooling. Hence, the building sector in urban areas are becoming more and
more energy consumptive. It has been estimated that even if all the energy-efficiency policies are implemented with grand success, global primary energy demand is expected to increase by 35% by 2040 [16].
This scenario is generating a growing concern for the impact that the buildings’ sector has for the environment and what it is possible to do to improve the sustainability in this industry. The United Nations stated that the world can barely sustain a level of consumption consisting of six billion people at a middle income, but this is a scenario that we already experienced in 1990s [9].
The population of the world is expected to reach to almost ten billion by 2050 [9] and, as previously said, the worldwide demand for better comfort and services is constantly increasing. Taking this into account, it is obvious that the world will not be able to meet these exponentially growing infinite demands in a short span of time. This situation leads us to be in a much more critical position which cannot be ignored anymore [9].
There has been needed to find new passive strategies for providing occupants with indoor air comfort to reduce the dependency on the mechanical heating/cooling and reduce the negative impact of buildings industry on the environment.
As a result, modeling energy performance is a critical issue to perform and manage the energy efficiency in buildings [12]. Several tools and methods have been assessed to support the implementation of sustainable strategies in the built environment.
For its characteristic, described in the previous section, BIM technology can be the best approach to address the problem. Indeed, using a BIM based model, it is possible to associate to each element its thermal characteristic and this gives the possibility to perform an energy analysis. Furthermore, as already mentioned, it is also possible to take into account costs and time. Thanks to all the features described, it is possible to analyze the entire lifecycle of a structure.
1.3 Literature review
As previously stated, BIM can be a really useful approach to increase the energy performance of construction projects together with the sustainability of the built
important role of BIM and used it to optimize different aspect of projects. For example, Raut et al. [17] analyzed the effectiveness of various roof systems with different insulations layers in hot climatic condition in India. The model has been realized with Autodesks’s Revit while the Energy analysis results have been obtained through Autodesk’s Green Building Studios. They analyzed both the annual energy use and related costs to understand the occupant’s indoor comfort, environmental and long-term economic benefits of insulation for a building envelope. Thanks to this research, it is interesting to understand how to use a BIM approach to also link costs on energy consumptions.
Costs are considered also in the research of Jalilzadehazhari et al. [18]. The authors used the incorporation of BIM, experimental design and an analytical hierarchy process to obtain the analysis of the performance of 375 construction solutions, considering different solutions based on a trade-off among visual comfort, thermal comfort, energy demand, and lifecycle costs. As optimization variables, three types of windows, five types of ground floors, roofs, and external walls constructions with different thermal transmittance values were considered. The results have been used to obtain two different main scenarios. The first one concentrated on the importance of visual and thermal comfort, while the second focused on the further decrease in the lifecycle costs.
Sandberg et al. [19] conducted a similar research focusing their attention on the problem of designing a “BIM-based process using neutral file formats to enable multidisciplinary optimization of lifecycle energy and cost” [19]. The authors proposed a framework consisting on a centralized master model, from which different discipline-specific domain models are generated and evaluated and on an optimization algorithm to control the loop. The prototype has been used for a Swedish multifamily residential building to test the framework’s applicability. The main goal was to enhance the building’s sustainability performance by optimizing the trade-off between the building’s lifecycle energy (LCE) and lifecycle cost (LCC) considering different alternative for the material.
An energy analysis using Green Building Studios based on a Revit model has performed by Singh and Sadhu [20] too. They consider again different materials for roof, walls but also variable window-to-wall-ratio (WWR), different orientation in space and combinations of building network.
The selection of different software can be fundamental to obtain a good interoperability between the project participants. Spiridigliozzi et al. [21], proposed a research in which they modelized a single dwelling of two floors sites with Revit and, then, they imported it into IDA Indoor Climate and Energy (IDA-ICE) simulation tool to obtain the energy demand variation over the months. The aim of the authors was to demonstrate how crucial good interoperability is when designers decides to perform energy analysis through the BIM and Building Energy Modeling (BEM).
A similar approach has been used by Tallberg and Bohne [22] which reported “a BIM based iterative energy performing simulations performed in IDA-ICE, with aim to establish a procedure for techno-economic optimization” [22]. The building was designed using Revit 2018. The authors evaluated the energy performance of a traditional apartment building designed with the Norwegian TEK-17 standard and compared the results with the recommended thermal properties given by the nZEB (nearly Zero Emission Buildings) standard. In this paper, it is possible to notice two possible standardizations that can be helpful for designers to avoid critical choice for the building’s elements.
In this field, Leadership in Energy and Environmental Design (LEED) is one of the most diffused green building rating systems to quantify the level of sustainability. This has been used by Akcay and Arditi [23] that described a method helpful for designers in obtaining the desired number of earned points in the “Optimize Energy Performance” credit of the “Energy and Atmosphere” category of LEED certification at minimum cost. The model creates different scenarios and identifies the LEED points and costs for each of it. Revit, Sefaira, RSMeans and Excel are the used software considering an office building as a case study.
The problems of negative environmental impact, obviously, is not only related to the new construction and, for this reason, the study conducted by Ijasahmed et al. [24], on existing buildings, assumes great importance. They used Revit 2017 to model a single storey building with floor area of 88 𝑚2, located in Kozhikode city and then they performed energy analysis comparing the real structure with a one that incorporated passive features (insulation for roof and walls, double glazing for windows and energy efficient air conditioning systems) and renewable energy system (Solar PV system)
.
In the field of existing building, the research of Maciela and Carvalho [25] is interesting too. The authors focused their attention on the residential buildings located in Brazil. As seen on the other papers, in fact, climate classification of the facility locations strongly changes the heating/cooling necessities and therefore the energy consumption. The research investigates the energy benefit of opaque ventilated façades compared to cladding façades in multi-floor residential buildings located in nine climate zones, in Brazil. The authors also considered the cost of implementing the system in different locations to take into account the cost-benefit against the yearly energy benefits. They found the greatest energy and cost benefits in the warmer regions, which is a significant result for a country that has the climate conditions of Brazil. As this paper shown, the different climate conditions can be decisive for the method to be used to improve energy performance. Another research focalized on a specific region has been conducted by Seyedehzahra et al. [26] that considered the Malaysian Tropical climate. The authors focused their attention on the passive design method to reduce environmental impacts of the building, which is one of the most potential strategies on hot-humid tropical regions. For their purpose, a selection of elements that has to be considered fundamental (such as form, width, length, height, external walls, roof, glazing area and external shading devices) has been made to achieve the best natural ventilation and occupants thermal comfort. Based on other studies, they provided recommendations to help designers on a proper selection of the various elements.
As previously stated, climate zones are a crucial point for the energy consumption of the buildings. So, understating how this aspect impacts on the structure, can make much easier and faster any decision-making process. In this field, the research of Najjar et al. [12] can be considered really important. The authors proposed a framework based on various performance parameters to assist the designers in decisions relating the sustainability and management in buildings considering six different locations for the structure to cover all the possible main “Climate Group”. As performance parameters, they selected exterior walls, roof and window-to-wall-ratio. A single-family house has been modelled on Revit and the energy analysis has been performed through Green Building Studios considering different material configurations. Finally, a linear regression analysis obtained through
Minitab is used to understand the effects of the various chosen parameters in function of the climate zone.
Sadeghifam et al. [16] conducted a similar research. They used Revit to create the model and Energy Plus to obtain the energy analysis. They considered different types of floor, walls, windows and ceiling and through the Taguchi statistical method, they determined the level of importance of the building components in term of energy insulation, also considering the effects of noise factors such as temperature, humidity and air flow.
Starting from what the other authors have done in the reported literature, the aim of this work is to use the BIM technology to improve the simplicity in decision-making process regarding the sustainability of the buildings. It is possible to notice that, in literature, there are many researches that can be considered theoretical only. Moreover, particular attention has been given to the concept expressed by Patrick MacLeamy with his curve. Taking this into account, this work used a methodological framework, obtained by drawing inspiration from the literature, to improve energy efficiency focusing on elements with precise commercial characteristics and costs.
Today we have the tools and technology to improve the description of project details and the interoperability of work. As a consequence, this work can be useful for many designers to understand the real potential of a BIM application and also to get an idea of what is the best choice for the building components that might affects energy consumption in relation with their costs.
2
PROPOSED METHODOLOGY
In this chapter, the methodology adopted in this study is described. The aim of this work is assessing the BIM approach by comparing several design alternatives through analysis on costs related to construction, maintenance and energy consumption.
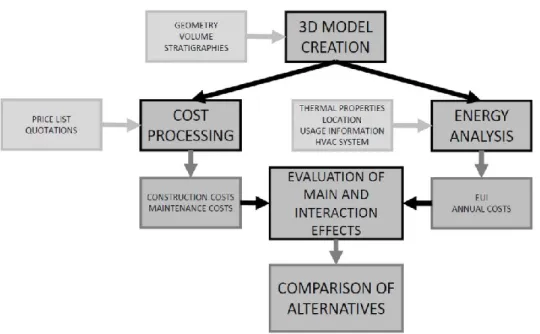
The needed steps are shown in the diagram in Figure 5.
Figure 5 Workflow diagram
2.1 Geometrical characterization of a BIM model
The first step requires the collection of all information related to the geometrical characterization of the building under analysis. This means defining quantities and characteristics of the structure: for each architectural component (walls, roof, floor…) it is
necessary to define their dimensions and their shape in order to determine each areas and volumes of the spaces of the structure. This information is used to create a BIM model which will be analyzed.
Since the purpose of this work is to compare different design alternatives, the key point is defining which construction components should be considered in relation to their impacts in terms of construction costs and energy consumption of the whole building.
Based on the previous literature, in this study five elements have been selected: walls, roof, floor, windows and window-to-wall-ratio. For these members, the definition of their composition is necessary in order to allow a precise characterization of their realization costs and their thermal properties.
Walls, roof and floor need to be characterized in terms of stratigraphy. For each of them, indeed, there may be differences in terms of materials used for insulation, finishing and structural core and also in terms of thickness of these layers.
For windows, the material used for the frame and the type of glass must be chosen. In addition to these elements, it has been decided to consider the window-to-wall-ratio because, according to the literature [12], it is one of the most important parameters that affects the energy consumption of a building. WWR represents the ratio between the area occupied by the windows and the whole surface of the walls which divided indoor (heated) and outdoor spaces measured from the outside.
It is important to note that there are also other parameters not considered in this work that may affect energy consumption. For example, the orientation of the building in space or the presence and position of adjacent structures. The reason for their exclusion is that, in a real project, these parameters are, in general, set by external constraints and it is not possible to consider many different solutions for them. Then, for the sake of simplicity, the analysis will be conducted considering only the aforementioned variables.
Once that variables members have been defined, through a manipulation of their composition, several design alternatives can be obtained.
Starting from the geometrical characteristics of these design alternatives, it is possible to proceed with the next steps: energy analysis and evaluation of construction cost.
2.2 Energy analysis
The BIM approach allows making energy analysis of a building on the basis of its virtual counterpart. Thanks to this feature, several design alternatives in terms of different member stratigraphies and compositions can be evaluated from the point of view of energy consumption.
In fact, based on them, there is a direct changing of the main parameters taken into account for energy analysis, such as:
Thermal conductivity 𝜆 (expressed as 𝑊/𝑚𝐾) which describe the capacity of a material to conduct heat when there is a difference of temperature. It depends on the nature of the material but not on its shape;
thermal resistance 𝑅 (expressed as 𝑚2𝐾/𝑊) which represents the difficulty of heat
to pass through a material. It is strictly correlated to 𝜆 as it is obtained as ratio between thickness and thermal conductivity;
thermal transmittance 𝑈 (expressed as 𝑊/𝑚2𝐾) which is the inverse of the thermal
resistance and therefore describes the tendency of an element to disperse heat in presence of a temperature difference.
Once that all the thermal characteristics of passive elements have been defined, also HVAC (Heating, Ventilation and Air Conditioning)system should be properly defined. This because depending on different solutions, different energy consumptions can be simulated. Since this study is focused on improving energy performance related only to passive building components, the HVAC system is considered as a constant parameter.
While the previous aspects refer to the building from the point of view of construction elements, there are many other factors that can influence the results of an energy analysis. First of all, the typology of the building and so the activities expected to be carried out in. Also in this case, this aspect will not be considered as variable but in the following sections it will be well defined the hypothesized use of the modelled building under investigation.
Also the geographical location of the structure affects energy requirements. Depending on it, indeed, the consumption will vary due to possible climates modifying the differences between design alternatives in term of energy requirements. For this reason, in addition to
the components reported in the Section 2.1, also the site of the structure is considered a variable parameter in this study.
All these non-constructive aspects, HVAC system adopted and thermal characteristic of the components of the building are used, for each design alternatives, for the calculation of the EUI (Energy Use Intensity), which has been chosen in this study as the fundamental parameter to evaluate energy consumptions.
This choice is related to the fact that EUI has gaining popularity among governmental organizations, non-government organizations and building industry groups [12], including American Society of Heating, Refrigerating and Air-Conditioning Engineers (ASHRAE) [27].
This coefficient represents the total energy consumed by the building in one year per unit area [28] and it is expressed as 𝑀𝐽/𝑚2/𝑦𝑒𝑎𝑟. Through the EUI, energy efficiency of a building can be assessed, depending on its size, building function, occupation density and daily and yearly using periods [12]. In Figure 6 a schematic representation of the meaning of EUI and the parameters that can affect its value is reported.
Figure 6 Energy Use Intensity calculation [29]
This parameter must be calculated for each design alternatives in order to be able to compare them.
2.3 Cost processing and comparison of design alternatives
Performing building components, as one can expect, improve energy saving, but their impact on manufacturing, installation and maintenance costs cannot be avoided to be taken into account. For this reason, the following equation has been used in order to obtain a comparison between design alternatives:
𝐶𝑡𝑜𝑡= 𝐶𝑐+ 𝐶𝑚+ 𝐶𝑢 The meaning of each terms is described below.
𝐶𝑐 represents the cost of construction. This takes into account the costs of
manufacturing and installation. 𝐶𝑐 varies in function of the typology and quantity of the materials used and the related handling and installation needed.
𝐶𝑚 is the cost of maintenance. The presence of this term is due to the incidence of time
factor in this work. Indeed, some stratigraphies are often more expensive in term of 𝐶𝑐 due
to better durability in time. This characteristic allows to maintain the properties unchanged over time, whether mechanical, thermal or aesthetic.
Durability is a characteristic that becomes more and more important as the considered lifecycle lengthens. Indeed, for a less durable material, the number or the costs of interventions will be higher. For this reason, considering the costs of maintenance in addition to the costs of construction is fundamental if an evaluation of a specific lifecycle is required.
𝐶𝑢 is the energy cost related to the usage of the building during its lifecycle. It is obtained summing up the annual energy costs of each year considered in the lifecycle, as shown in the following equation:
𝐶𝑢 = ∑ 𝐶𝑦 𝑛
𝑦=1
Where 𝐶𝑦 is the annual energy cost of the specific year 𝑦 considered and 𝑛 represents the total number of considered years.
In general, through an energy analysis, it is possible to obtain a single value of annual energy cost and so, by assuming 𝐶𝑦 constant for each year, the value of 𝐶𝑢 becomes:
Finally, 𝐶𝑡𝑜𝑡 can be calculated. It represents the total costs needed to obtain design
alternatives with different energy performances.
For how 𝐶𝑡𝑜𝑡 has been expressed, it is possible to make a comparison considering
different values for the lifecycle of the structure. Indeed, as previously explained, while 𝐶𝑐
is due just at the epoch of construction, 𝐶𝑚 and 𝐶𝑢 vary over the years. Obviously, the
longest the lifecycle considered, the highest the impact of 𝐶𝑚 and 𝐶𝑢 on total cost.
Another possible comparison between design solutions can be made considering not only their total cost, but also the ratio between the differences in terms of 𝐶𝑡𝑜𝑡 of two
alternatives and the differences between their energy consumption in terms of EUI, as it is expressed in the following formula:
𝑖𝑛𝑣𝑒𝑠𝑡𝑚𝑒𝑛𝑡 𝑟𝑎𝑡𝑖𝑜 =Δ𝐶𝑡𝑜𝑡 Δ𝐸𝑈𝐼
In order to obtain a good result, this ratio must be low. In fact, the investment ratio can be lowered increasing Δ𝐸𝑈𝐼 or decreasing Δ𝐶𝑡𝑜𝑡. A great value of Δ𝐸𝑈𝐼 means that there
is a big difference between alternatives in term of consumptions justifying the interest on a comparison between them. Moreover, a small Δ𝐶𝑡𝑜𝑡 means that the requested increasing
on the investment to have better energy performance is not so high, justifying again the interest for this comparison.
This ratio will be used, in particular, to find differences on using different typologies of the same building components.
In Chapter 3, a realistic case study of a single-family house is analysed adopting the proposed approach, describing the steps done with the chosen software and documentation used to obtain all the needed information.
3
VALIDATION OF THE PROPOSED
METHODOLOGICAL FRAMEWORK
In this chapter the methodology previously described is applied on a case study, focusing on practical aspects of each step.
3.1 Case study
The study carried out concerns a realistic architectural project of a single-family house, whose surface area is about 90 𝑚2. This is designed to accommodate a family of 4 people and is divided as follows:
a spacious living room, about 22 𝑚2, equipped with two windows;
a kitchen, about 15 𝑚2, with a French door and a window;
a small anteroom;
a double bedroom, equipped with a window; a smaller bedroom, also equipped with a window; a bathroom with a small single window.
Figure 7 Spaces layout
The house is designed to be located in Lombardy, Italy. Two possible locations have been considered, Milan and Livigno. This is because the D.P.R 26/08/1993 n.412 [30] divides the national territory into six climate zones, defined with letters from A to F, according to the average temperature recorded in a year. In Lombardy only two typologies of climates are present: E and F. When considered in Milan, the building will be classified in zone E, while when in Livigno, zone F, in order to analyze the possible differences given by the climate.
Once defined and fixed the geometrical characteristics of the building, different design alternatives are created properly modifying the five elements described in Chapter 2. In particular, for both locations, are considered: two types of external and internal walls, two stratigraphies for roof and slab structure, two types of windows and three window-to-wall-ratios (WWR) which will then create three different configurations with respect to the arrangement of the windows. According to D.M. 26/06/2015 (table 1-4, Appendix A, Annex 1) [31], different minimum requirements in terms of thermal transmittance must be satisfied depending on the climate zones, as shown in Table 1. For this reason, the less performing alternatives considered are different for the two location.
Table 1 Limit values of thermal transmittance
Climate zone Thermal transmittance U [W/m
2K] limit
Walls Roof Floor Windows E (Milan) 0,26 0,22 0,26 1,40 F (Livigno) 0,24 0,20 0,24 1,10
For walls, roof and floor, the best alternatives are, instead, kept constant regardless of the location. The only difference is given by windows because of different glasses used.
Based on the differences just described, the different design alternatives chosen are presented in the following paragraphs for each component.
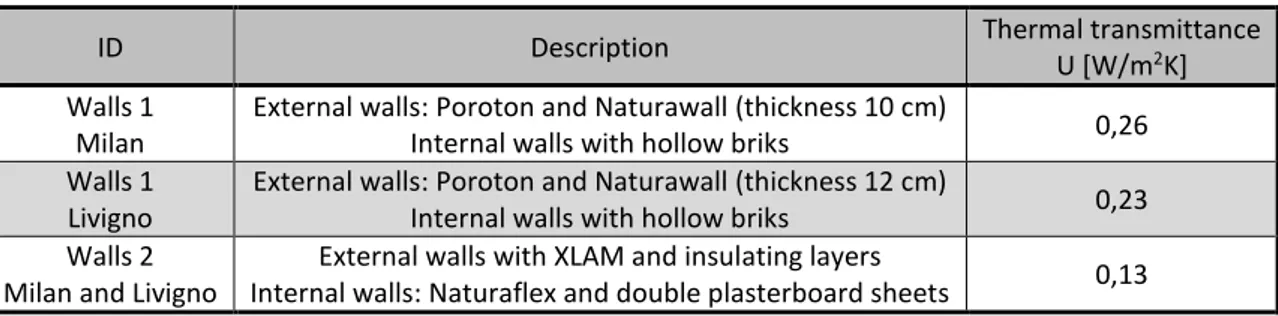
3.1.1 Walls alternatives
The typologies of walls chosen and their relative thermal transmittance are reported in Table 2.
Table 2 Walls typologies adopted
ID Description Thermal transmittance U [W/m2K]
Walls 1 Milan
External walls: Poroton and Naturawall (thickness 10 cm)
Internal walls with hollow briks 0,26 Walls 1
Livigno
External walls: Poroton and Naturawall (thickness 12 cm)
Internal walls with hollow briks 0,23 Walls 2
Milan and Livigno
External walls with XLAM and insulating layers
Internal walls: Naturaflex and double plasterboard sheets 0,13
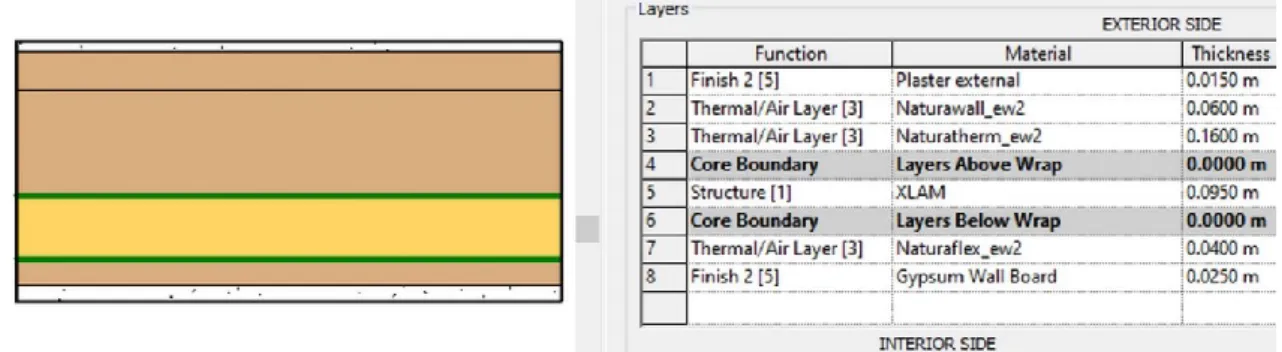
The first solution, for the external and internal walls, is one of the most used for projects of this type in the considered region. Concerning the external walls - as shown in Figure 8 - there is a load-bearing part made of brick blocks called “Poroton P800”, 25 𝑐𝑚 thick, and an overcoat insulation layer added to it. Two plaster layers complete the stratigraphy of the wall: one inside the building and one outside, both 1,5 𝑐𝑚 thick.
The choice of insulation is made by consulting a green building guide that proposes the use of ecological materials [32]. In particular, it is suggested the use of a wood fiber, called “Naturawall”, supplied in the form of plasterable panels. These elements are very practical for the realization of insulation on external walls of masonry, concrete or wood, and are characterized by a thermal conductivity of 0,040 𝑊/𝑚𝐾.
In case the building is located in Milan, the external insulation layer adopted is 10 𝑐𝑚 thick; instead if Livigno is considered as location, a thickness of 12 𝑐𝑚 is chosen for the overcoat insulation.
In combination with this type of external walls, it is decided to adopt the corresponding masonry solution for internal planks consisting of hollow bricks, 8 𝑐𝑚 thick, then plastered on the external surfaces. This is reported in Figure 9.
Figure 9 Internal walls 1 stratigraphy and data [33]
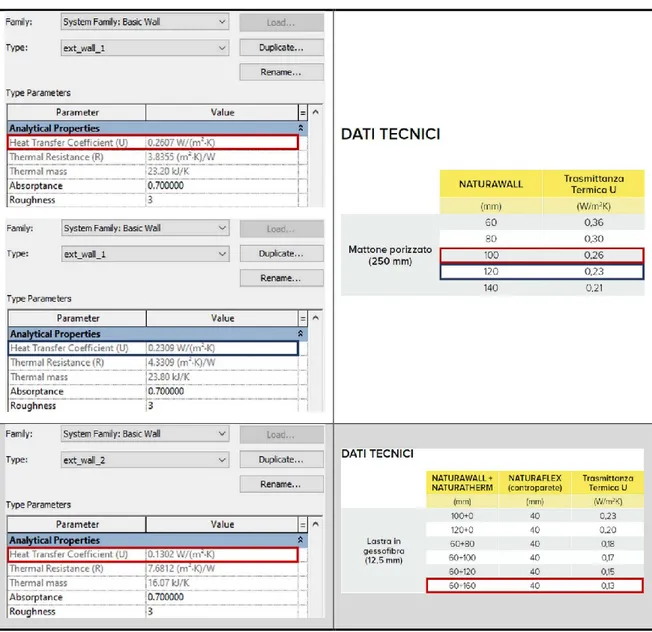
As a second type of external walls, a solution with glulam structure is adopted. Also this stratigraphy, reported in Figure 10, is chosen with reference to the green building guide [32] and is thus constituted starting from inside:
internal finish made of a double plasterboard sheet, 2,5 𝑐𝑚 thick;
an insulated counterwall, made by a wooden fiber called “Naturaflex”, 4 𝑐𝑚 thick and thermal conductivity of 0,036 𝑊/𝑚𝐾;
a structural part made of glue laminated timber, called “XLAM”, 9,5 𝑐𝑚 thick; overcoat insulation consisting of two different panels: “Naturatherm” (wood fiber
characterized by a thermal conductivity of 0,038 𝑊/𝑚𝐾) 16 𝑐𝑚 thick and “Naturawall” 6 𝑐𝑚 thick;
Coupled with this type of external walls, there is an internal walls typology made by a layer of “Naturaflex”, 6 𝑐𝑚 thick, coated by a double plasterboard sheet. This solution is shown in Figure 11.
Figure 11 Internal walls 2 stratigraphy and data
It has been chosen to use this type of materials because being particularly sensitive to their future reuse, recycling or disposal, which is the aim of a green building approach.
3.1.2 Roof alternatives
In Table 3, the different roof solutions adopted are reported with their transmittance values.
Table 3 Roof typologies adopted
ID Description Thermal transmittance U [W/m2K]
Roof 1 Milan
Roof with wooden structure
Insulating layers in Naturatherm (total thickness 16 cm) Roofing shingles
0,22 Roof 1
Livigno
Roof with wooden structure
Insulating layers in Naturatherm (total thickness 18 cm) Roofing shingles
0,20 Roof 2
Milan and Livigno
Roof with wooden structure
Insulating layers in Naturatherm (total thickness 32 cm) Roofing shingles
0,11
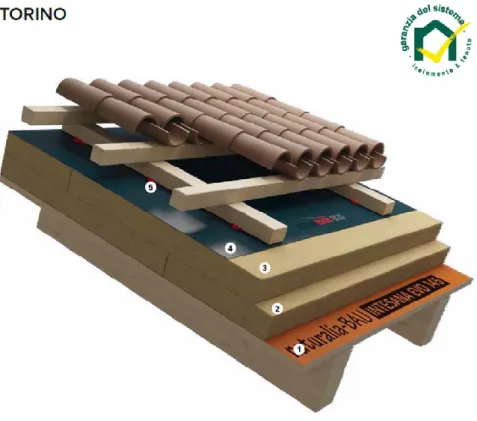
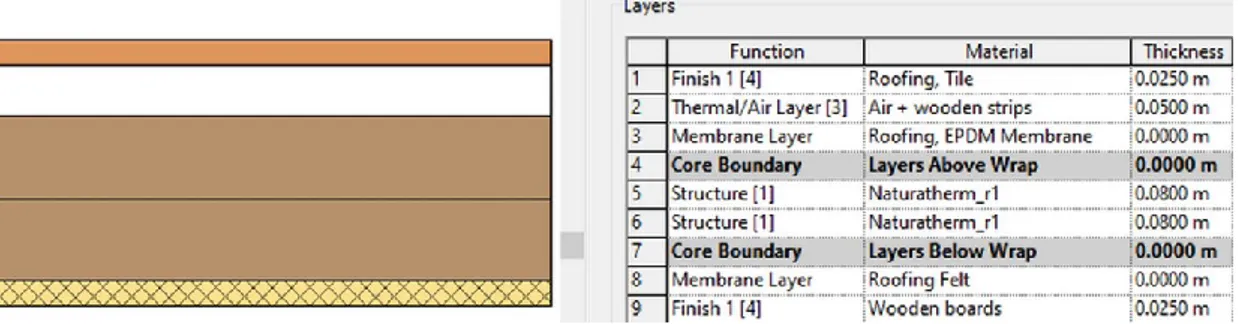
A single construction type is adopted for this component, changing only the thickness of the insulating layers. Also for this element, reference is made to the solutions proposed by the bio-construction guide used for the walls [32]: the “TORINO” roof type is chosen, due to the fact that this is the classical solution adopted by the designers of the region.
It consists of a first layer, visible from the inside of the building, of wooden planks, 2,5 𝑐𝑚 thick and just above it there is a membrane layer consisting of roofing felt with the function of a vapour barrier. Then there are two layers of “Naturatherm” insulation, these are chosen in this way:
for the first solution, if the building is located in the city of Milan, both layers are 8 𝑐𝑚 thick;
if the building is situated in Livigno, for the first arrangement, the thickness of the insulating panels is 10 𝑐𝑚 for the first one and 8 𝑐𝑚 for the second one;
finally, as a second alternative, for both locations, it is decided to adopt both “Naturatherm” panels with a thickness of 16 𝑐𝑚.
This insulation layer is followed by a waterproofing sheath (EPDM membrane). In the end, there is an air gap for the ventilation of the roof, in which wooden joists tiles holders, 5 𝑐𝑚 thick, are placed and brick tiles, 2,5 𝑐𝑚 thick, are then fixed to them.
All the solutions are supported by a system of wooden joists (base 10 𝑐𝑚 and height 16 𝑐𝑚), parallel to the slope of the roof pitches, and placed at a distance of about 60 𝑐𝑚 from each other. These are fixed at the top to a glulam ridge beam, with a base of 20 𝑐𝑚 and a height of 80 𝑐𝑚. To support the eaves of the roof that come out of the perimeter of the external walls, there are wooden cantilevers, 20 𝑐𝑚 base and 24 𝑐𝑚 high, stuck in the perimetral walls at the base of the roof, in the corners of the building and at the entrance of the house. An example of the structural system described is shown in Figure 13.
Figure 13 Wooden structure of the roof adopted [34]
3.1.3 Floor alternatives
The stratigraphies of the chosen slabs and the relative total resulting thermal transmittances are shown in Table 4.
Table 4 Floor typologies adopted
ID Description Thermal transmittance U [W/m2K]
Floor 1 Milan
Ventilation layer (thickness 30 cm) Polystyrene insulating layer (thickness 12 cm)
Screed for installations and finishing tiles
0,26 Floor 1
Livigno
Ventilation layer (thickness 30 cm) Polystyrene insulating layer (thickness 14 cm)
Screed for installations and finishing tiles
0,24 Floor 2
Milan and Livigno
Foamglas insulating layer (thickness 20 cm)
Also with regard to the slab, the first solution – in Figure 14 - is the one that is typically adopted by the designers in the region where the house of this study rises. This is structured, starting from the ground, as follows:
sand and cement foundation slab, 10 𝑐𝑚 thick;
ventilation layer, made of plastic igloo with 30 𝑐𝑚 height; 5 𝑐𝑚 thick concrete casting filling, above the plastic igloos;
thermal insulation made of expanded polystyrene, 12 𝑐𝑚 thick (thermal conductivity 0,034 𝑊/𝑚𝐾) for Milan, or, for Livigno, 14 𝑐𝑚 thick (with conductivity 𝜆 = 0,036 𝑊/𝑚𝐾);
5 𝑐𝑚 thick concrete slab;
19 𝑐𝑚 thick sand and cement screed, where underfloor heating systems and pipes can be accommodated;
1 𝑐𝑚 thick surface finish made of tiles.
Figure 14 Floor 1 stratigraphy and composition
For the second solution, the alternatives proposed by the site “Foamglas” are consulted [35]; this insulation system, reported in Figure 15, consists of an innovative material made of cellular glass.
It is decided to adopt the solution that provides a foundation of sand and cement resting on gravel, on which “Foamglas board T4+” panels [36], 20 𝑐𝑚 thick, are directly placed. Above this insulating layer, the stratigraphy is repeated identically to the previous solution, i.e. with a concrete slab followed by the screed for the installations and, finally, the tiles.
Figure 15 Floor 2 stratigraphy and composition
This last insulating material is particularly practical for these applications for various reasons: first of all, it has good mechanical strength and therefore also excellent durability over time [37, 38], thus requiring almost no maintenance and also making possible to cast directly above it a load-bearing layer of concrete. Its characteristics of waterproofing are important too and also the fact that it prevents the infiltration of gas radon from the ground, ensuring greater habitability and comfort to those who will use the building.
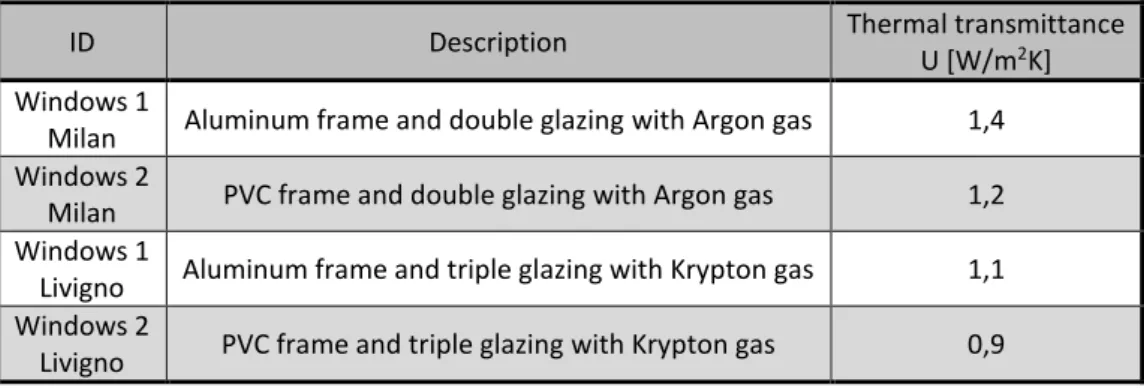
3.1.4 Windows alternatives
In Table 5, the different windows used are reported with their transmittance values. Table 5 Windows typologies adopted
ID Description Thermal transmittance U [W/m2K]
Windows 1
Milan Aluminum frame and double glazing with Argon gas 1,4 Windows 2
Milan PVC frame and double glazing with Argon gas 1,2 Windows 1
Livigno Aluminum frame and triple glazing with Krypton gas 1,1 Windows 2
Livigno PVC frame and triple glazing with Krypton gas 0,9
As shown in Table 5, it is decided to consider the possibility of installing aluminum or PVC windows. The first ones are characterized by a higher thermal transmittance than the second ones, which are also less expensive; the aluminium ones, however, are much more durable and will therefore require less maintenance over time. For this reason, these two solutions are the most popular and consequently are adopted as alternatives in these analyses.
It is important to underline how the thermal characteristics for these elements have been obtained. The calculation of thermal transmittance is carried out with the following equation, in accordance with UNI EN ISO 10077-1 [39]:
𝑈𝑤 =𝐴𝑔𝑈𝑔+ 𝐴𝑝𝑈𝑝+ 𝐴𝑓𝑈𝑓+ 𝐿𝑔𝛹𝑔 + 𝐿𝑝𝛹𝑝 𝐴𝑔+ 𝐴𝑝+ 𝐴𝑓
where:
𝐴𝑔 is the area of glass, expressed in 𝑚2;
𝑈𝑔 is the thermal transmittance of glass, expressed in 𝑊 𝑚⁄ 2𝐾; 𝐴𝑝 is the area of the panel, expressed in 𝑚2;
𝑈𝑝 is the thermal transmittance of the panel, expressed in 𝑊 𝑚⁄ 2𝐾; 𝐴𝑓 is the area of the frame, expressed in 𝑚2;
𝑈𝑓 is the thermal transmittance of the frame, expressed in 𝑊 𝑚⁄ 2𝐾; 𝐿𝑔 is the total perimeter of the glass, expressed in 𝑚;
𝛹𝑔 is the linear thermal transmittance of the glass, expressed in 𝑊 𝑚𝐾⁄ ; 𝐿𝑝 is the total perimeter of the panel, expressed in 𝑚;
𝛹𝑝 is the linear thermal transmittance of the panel, expressed in 𝑊 𝑚𝐾⁄ .
For the solution with aluminium windows 𝑈𝑤 = 1,4 𝑊 𝑚⁄ 2𝐾 is the result, while for PVC
windows, 𝑈𝑤 = 1,2 𝑊 𝑚⁄ 2𝐾 is obtained.
The values obtained through the above calculations for the chosen windows are reported in Table 6 and in section “Windows transmittance and quotations” of the Appendix A. Here are also reported the costs related to the complete installation of each single element. The methodology by which these are obtained is explained in Chapter 3.3.
Table 6 Windows typologies for Milan
Type 1 2 3 1 2 3 Frame material Aluminum PVC
b [m] 1,40 1,40 0,80 1,40 1,40 0,80 h [m] 1,40 2,40 1,40 1,40 2,40 1,40 Ag [m2] 1,3209 2,4024 0,7590 1,3209 2,4024 0,7590 Ug [W/m2K] 1,00 1,00 1,00 1,00 1,00 1,00 Af [m2] 0,6391 0,9576 0,3610 0,6391 0,9576 0,3610 Uf [W/m2K] 1,83 1,83 1,83 1,20 1,20 1,20 Lg [m] 7,0806 11,0806 3,7016 7,0806 11,0806 3,7016 Ψg [W/mK] 0,036 0,036 0,036 0,036 0,036 0,036 Uw [W/m2K] 1,4 1,4 1,4 1,2 1,2 1,2 Cost [€] € 1.035,00 € 1.435,00 € 680,00 € 785,00 € 1.235,00 € 490,00
If, on the other hand, the house is considered to be located in Livigno, it is decided to adopt a triple glazing with Krypton gas cavity [39], in order to reach the thermal standards required by the regulations for this climate zone. In this case, for aluminium windows 𝑈𝑤 =
1,1 𝑊 𝑚⁄ 2𝐾 is obtained, while for PVC windows, the result is 𝑈𝑤 = 0,9 𝑊 𝑚⁄ 2𝐾.
In Table 7, the results for Livigno are listed.
Table 7 Windows typologies for Livigno
Type 1 2 3 1 2 3 Frame material Aluminum PVC
b [m] 1,40 1,40 0,80 1,40 1,40 0,80 h [m] 1,40 2,40 1,40 1,40 2,40 1,40 Ag [m2] 1,3209 2,4024 0,7590 1,3209 2,4024 0,7590 Ug [W/m2K] 0,55 0,55 0,55 0,55 0,55 0,55 Af [m2] 0,6391 0,9576 0,3610 0,6391 0,9576 0,3610 Uf [W/m2K] 1,83 1,83 1,83 1,20 1,20 1,20 Lg [m] 7,0806 11,0806 3,7016 7,0806 11,0806 3,7016 Ψg [W/mK] 0,036 0,036 0,036 0,036 0,036 0,036 Uw [W/m2K] 1,1 1,1 1,1 0,9 0,9 0,9 Cost [€] € 1.182,00 € 1.687,00 € 764,00 € 932,00 € 1.487,00 € 574,00
As it is possible to notice, also the costs of each single window have increased: this increment, of about 75 €/𝑚2, is justified by the fact that the glass panel is not only more valuable but also heavier and therefore necessitates more care during the installation phase.
3.1.5 Window-to-wall-ratios values
Najjar et al. [12] stated that the ratio between the total glazed area to the surface area of external walls is the parameter that has the greatest influence on the consumption of dwellings. For this reason, it is decided to consider three different provisions for the arrangement of the windows, in order to obtain different WWR equal to 10% (starting configuration), 20% and 30%, as shown in Table 8, Table 9 and Table 10. The three chosen layouts are reported in Figure 16, Figure 17 and Figure 18.
Table 8 WWR 1 calculations
Façade Walls area [m2]
Windows
WWR 1 Number per type
Area [m2] 1 2 3 South 44,473 1 0 1 3,08 10% East 31,291 0 0 0 0,00 North 36,493 3 0 0 5,88 West 31,291 1 1 0 5,32 Total 143,549 7 14,28 Table 9 WWR 2 calculations
Façade Walls area [m2]
Windows
WWR 2 Number per type
Area [m2] 1 2 3 South 44,473 1 1 1 6,44 20% East 31,291 0 1 1 4,48 North 36,493 1 2 1 9,80 West 31,291 0 2 1 7,84 Total 143,549 12 28,56 Table 10 WWR 3 calculations
Façade Walls area [m2]
Windows
WWR 3 Number per type
Area [m2] 1 2 3 South 44,473 1 2 1 9,80 30% East 31,291 0 3 0 10,08 North 36,493 4 1 0 11,20 West 31,291 1 3 0 12,04 Total 143,549 16 43,12
Figure 16 WWR 1 layout, South-West (left) and North-East (right) views
Figure 18 WWR 3 layout, South-West (left) and North-East (right) views
Based on the alternatives described for each element, combining them, a total of 96 models are obtained, 48 for both locations. Their schematic representation is reported in Table 11, Table 12 and Table 13 by adopting the same “ID” number introduced in the previous paragraphs.
Table 11 Run alternatives, from 1 to 16
Run 1 2 3 4 5 6 7 8 9 10 11 12 13 14 15 16 Walls 1 1 1 1 1 1 1 1 1 1 1 1 2 2 2 1 Roof 1 1 1 1 1 1 1 1 1 2 2 2 1 1 1 1 Floor 1 1 1 1 1 1 2 2 2 1 1 1 1 1 1 2 Windows 1 1 1 2 2 2 1 1 1 1 1 1 1 1 1 2 WWR 1 2 3 1 2 3 1 2 3 1 2 3 1 2 3 1
Table 12 Run alternatives, from 17 to 32
Run 17 18 19 20 21 22 23 24 25 26 27 28 29 30 31 32 Walls 1 1 1 1 1 2 2 2 1 1 1 2 2 2 2 2 Roof 1 1 2 2 2 1 1 1 2 2 2 1 1 1 2 2 Floor 2 2 1 1 1 1 1 1 2 2 2 2 2 2 1 1 Windows 2 2 2 2 2 2 2 2 1 1 1 1 1 1 1 1 WWR 2 3 1 2 3 1 2 3 1 2 3 1 2 3 1 2
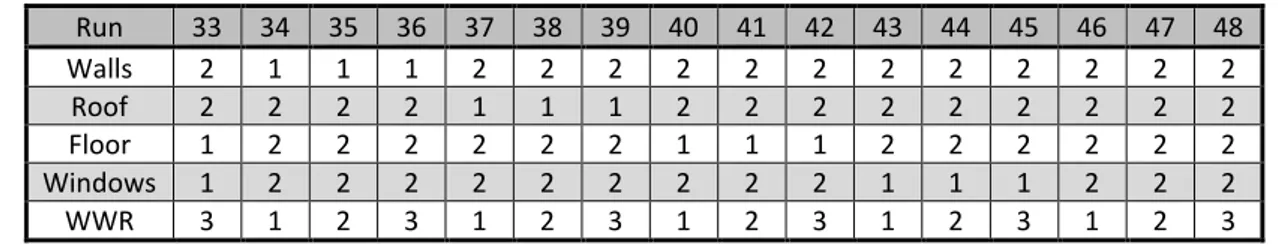
Table 13 Run alternatives, from 33 to 48
Run 33 34 35 36 37 38 39 40 41 42 43 44 45 46 47 48 Walls 2 1 1 1 2 2 2 2 2 2 2 2 2 2 2 2 Roof 2 2 2 2 1 1 1 2 2 2 2 2 2 2 2 2 Floor 1 2 2 2 2 2 2 1 1 1 2 2 2 2 2 2 Windows 1 2 2 2 2 2 2 2 2 2 1 1 1 2 2 2 WWR 3 1 2 3 1 2 3 1 2 3 1 2 3 1 2 3
3.2 BIM model creation on Revit
Based on the geometric and thermal characteristics described above, a BIM model is created using Revit 2019.
It is necessary to create a new type of wall belonging to the “Basic Wall” family. Starting from one of the types of wall already present, it is possible to duplicate and rename it on the basis of its functionality (external or internal wall). The desired stratigraphy is then created by editing the structure in the “Construction” panel: here layers can be added and removed to the wall section, and it is possible to assign a “Function” based on the purpose for which this layer works (structural part, insulation, finish, etc.). It is important to emphasize that each “Function” corresponds to a priority with which that layer of the wall will connect to the layers of the underlying slab and the overlying roof: this priority is indicated with a number in square brackets and the lower it is, the higher the importance of that layer. Clearly, on the basis of how the layers (especially those with thermal insulation functionality) are connected between the various architectural elements of the house, the overall thermal response of the structure will be different.
The two types of external walls, for each location, and the corresponding internal walls are then created. The stratigraphies for the external walls are shown in the following Figure 19, Figure 20 and Figure 21.
Figure 19 Revit stratigraphy adopted for external walls 1 – Milan
Figure 21 Revit stratigraphy adopted for external walls 2 – Milan and Livigno
The importance of correctly assigning the thermal properties of each material used is underlined: in the “Thermal” tab of each material, in fact, these properties, including thermal conductivity, specific heat, density and other parameters can be modified.
In Figure 22 an example of these thermal properties is reported.
Figure 22 Revit thermal properties tab
For materials that are not present in the Autodesk's libraries, it is necessary to create a custom material by duplicating one of the available materials with characteristics as close as possible to those desired.
Once this is done, it is possible to adjust its thermal properties but also other parameters, such as appearance and mechanical properties, but paying attention to use the “Duplicate this asset” command. This is important because, without using it, a modification related to a new material would be reflected also on the original one.
worked on. This procedure is performed for the brick blocks “Poroton P800”, downloaded from the website “Giussani Laterizi” [40]. The properties of this imported material are reported in Figure 23.
Having now created the various types of wall, in the “Type Properties” box, it is possible to verify that the overall analytical properties of the element correspond to those proposed by the green building guide, as shown in Table 14.
Table 14 Comparison between real and model thermal properties of external walls
The walls created in the model are now placed; after the creation of the perimetral walls of the house, the insertion of the internal planks is performed, following what the architectural design provides.
At this point the roof can be created. By opening the plan view Level 1, of which the height has previously been set equal to 3 𝑚, using the “Roof by Footprint” command, a generic roof is created by drawing its perimeter, considering an eaves of 80 𝑐𝑚. Since the
architectural design provides a two-pitch roof, the slope is defined only for the two long sides of the roof: an angle of 23° is set to represent a slope of about 40%.
Now that the roof has been correctly inserted, as seen for the walls, the three different stratigraphies are created: always starting from one of the “Basic Roof”, a new type is created by duplicating an existing one. The following Figure 24, Figure 25 and Figure 26 show their characteristics.
Figure 24 Revit stratigraphy adopted for roof 1 – Milan
Figure 25 Revit stratigraphy adopted for roof 1 – Livigno
Figure 26 Revit stratigraphy adopted for roof 2 – Milan and Livigno
As specified for walls, it is important to assign the correct thermal properties to the various layers, creating new materials if necessary, and assigning to each layer a function - and therefore a priority - in order to ensure the correct conjunction of the various roof materials with those of the walls.
Particular attention must be paid to the presence of the air gap with ventilation function to avoid overheating of the roof system. This layer corresponds to the definition of
![Figure 1 Differences between Traditional and Integrated Project Delivery [4]](https://thumb-eu.123doks.com/thumbv2/123dokorg/7515731.105624/12.892.137.783.356.870/figure-differences-traditional-integrated-project-delivery.webp)
![Table 1 Limit values of thermal transmittance Climate zone Thermal transmittance U [W/m 2 K] limit](https://thumb-eu.123doks.com/thumbv2/123dokorg/7515731.105624/30.892.284.631.1015.1098/table-limit-values-thermal-transmittance-climate-thermal-transmittance.webp)