Modeling light below tree canopies overestimates net photosynthesis and radiation use 1
efficiency in understory crops by averaging light in space and time 2
Adolfo Rosatia*, Kevin J Wolzb, Lora Murphyc, Luigi Pontid,e, Shibu Josef 3
4
a Consiglio per la ricerca in agricoltura e l'analisi dell'economia agraria, centro di ricerca 5
Olivicoltura, Frutticoltura, Agrumicoltura (CREA-OFA), via Nursina 2, 06049 Spoleto (PG), 6
Italy. 7
b Savanna Institute, Madison, Wisconsin 53715 USA 8
c Cary Institute of Ecosystem Studies, Box AB, Millbrook, New York 12545 USA 9
d Agenzia nazionale per le nuove tecnologie, l’energia e lo sviluppo economico sostenibile (ENEA), 10
Centro Ricerche Casaccia, 00123 Rome, Italy 11
e Center for the Analysis of Sustainable Agricultural Systems (CASAS Global 12
www.casasglobal.org), 37 Arlington Avenue, Kensington, CA 94707, USA. 13
f School of Natural Resources, The Center for Agroforestry, University of Missouri, Columbia, 14
MO, USA 15
16
* Correspondence: [email protected], CREA, Via Nursina 2, 06049, Spoleto (PG), Italy. 17
Phone: +39 074349743 18
Abstract 19
By averaging in time and/or space, models predict less variable light patterns under tree canopies 20
than in reality. We measured light every minute in 24 positions in a grid under different chestnut 21
orchards, for several clear and overcast days. We also modelled this light with a purposely created 22
3D, spatially explicit, ray-tracing light interception model, where canopy porosity was calibrated to 23
match measured daily light. Finally, we used both the measured and modeled light patterns 24
transmitted under the tree canopies to estimate the daily net photosynthesis (An) and radiation use 25
efficiency (RUE) of an understory wheat leaf. As expected, modeled light was more uniform than 26
measured light, even at equal daily light. This resulted in large overestimation of daily An and RUE 27
of the understory leaf. Averaging light in time increased the overestimations even further. A 28
sensitivity analysis showed that this overestimation remained substantial over the range of realistic 29
values for leaf photosynthetic parameters (i.e. Vc,max, Jmax, Rd) of the understory crop. 30
31
Keywords: agroforestry, alley cropping, leaf response curve, shade tolerance, silvoarable, PAR 32
2 33
1. Introduction 34
Agroforestry systems (AFS) are increasingly recognized for their potential contribution towards 35
sustainable intensification (Doré et al., 2011). Alley cropping (i.e. silvoarable, crops grown in the 36
alleys between lines of trees), is one of the agroforestry practices most studied and developed in 37
temperate regions (Palma et al., 2007; Liagre et al. 2009) because of its potential to increase yield 38
and income while providing environmental benefits and allowing modern mechanization (Dupraz 39
2005; Garrity et al., 2010; Luedeling et al., 2011; Cardinael et al. 2015). Field experiments in AFS 40
are time-consuming and expensive because of the long-term nature of trees and the many possible 41
combinations of trees and crops (Knörzer et al., 2011; Lovell et al., 2017). Modeling becomes 42
indispensable as an initial test of the many possible field designs and management strategies, 43
improving our understanding of the complex interaction in AFS (Chimonyo et al., 2015). In 44
particular, process-based models are considered particularly suitable (Bayala et al., 2015; Luedeling 45
et al., 2016). 46
Light is often the most limiting factor in crop growth in AFS (e.g. Friday and Fownes 2002; 47
Jose et al. 2004; Zamora et al. 2009), therefore a proper representation of light distribution between 48
trees and crops becomes essential for effective modeling (Dufour et al., 2013). Light distribution 49
under trees has been addressed with different levels of complexity in different models (for a review, 50
see Malézieux et al., 2009). Initial models considered trees and crops with a single one-dimensional 51
canopy representation, with strong limitations. Two-dimensional models improved upon this, but 52
only three-dimensional (3D), spatially explicit models are suited to represent the highly variable 53
light distribution when combining trees and crops (Chazdon and Pearcy, 1986; Knapp and Smith, 54
1987). 55
Only models that reproduce the exact architecture of trees, at the individual shoot or leaf 56
level (e.g. Dauzat et al. 2001; Mialet-Serra et al. 2001; Casella and Sinoquet 2007; Lamanda et al. 57
2008) can predict the exact light pattern available under the trees in both time and space. While 58
possible, this approach is computationally demanding, making it impossible on a large scale. 59
Therefore, the most common 3D models of AFS approximate light interception by tree canopies 60
using: 61
1) a fixed geometric shape for the canopy (e.g. cylinder, ellipsoid) 62
2) a homogeneous canopy of a fixed porosity to light 63
3) averaging the position of the sun over time 64
These simplifications result in predictions of light patterns under the trees that are always averaged 65
at some level of time and space, not representing the actual variability. 66
For a given total light interception, photosynthesis is reduced under variable light compared to 67
more uniform light (Külheim et al., 2002; Poorter et al., 2016; Kromdijk et al., 2016; Vialet-68
Chabrand et al., 2017). This is because the photosynthetic response of a leaf to light is curvilinear: 69
at high irradiance, net photosynthetic assimilation (An) tends to saturate, reducing the radiation use 70
efficiency (RUE). At very low light, the apparent quantum yield is highest, but RUE decreases due 71
to leaf respiration. RUE is zero at the light compensation point and becomes negative at lower 72
irradiance (Hirose and Bazzaz, 1998; Rosati and DeJong, 2003). Therefore, two minutes at average 73
irradiance can result in greater An than one minute at high and one at low irradiance. 74
Work on sunflecks and shadeflecks supports the idea that accounting for the effects of 75
variable light is important not only in understory plants (Pearcy et al., 1996; Way and Pearcy, 2012) 76
but also in common crops (Lawson et al., 2012; Carmo-Silva et al., 2015, Kromdijk et al., 2016), 77
where most of the leaves are still exposed to variable light levels due to self-shading (Pearcy et al., 78
1990; Rosati et al., 2004). Accounting for the variability in the patterns of incident light is 79
especially important for understory crops in AFS, where the incident light is filtered through tree 80
canopies. Variability in light patterns in AFS is caused by both large gaps between trees and small 81
gaps within tree canopies (Chazdon and Pearcy, 1986; Knapp and Smith, 1987). For an equal total 82
incident radiation transmitted below the trees, different light patterns likely result in different An and 83
RUE. 84
4 Here, we hypothesize that averaging of sub-tree canopy light patterns in time and space 85
overestimates An and RUE of understory crops in AFS. 86
87
2. Materials and Methods 88
First, we built a 3D, spatially explicit, ray tracing light interception model with a minutely 89
resolution. While ray-tracing models are commonly used in biophysical modeling, most do not have 90
a minutely resolution. We also measured minutely light transmitted during several days to 24 points 91
in a grid under several chestnut (Castanea mollissima Blume) orchards of different ages and 92
spacings. Then, we compared measured and modeled values of light transmitted to the understory 93
crop. Finally, we modeled An of a wheat leaf in each of the 24 positions as exposed to (1) the actual 94
(i.e. measured every minute) light pattern transmitted under the trees, (2) temporal averages (half-95
hourly, hourly, and daily) of the measured light, and (3) modeled (minutely, half-hourly, hourly, 96
and daily) light when approximating the tree crowns to ellipsoids or cylinders. A sensitivity analysis 97
was also performed by changing the photosynthetic parameters of the understory crop to simulate 98
variation in leaf physiology. 99
100
2.1 Measuring light under tree canopies in the field
101
We measured the photosynthetically active radiation (PAR) transmitted under the canopies of four 102
adjacent trees in two mature and two young chestnut orchards differing in age, spacing, and row 103
orientation (Table 1). The orchards were located at the Horticulture and Agroforestry Research 104
Center of the University of Missouri, in New Franklin, MO, USA. The mature orchards were 20 105
years old, and the young orchards were five years old. Tree characteristics (i.e. trunk circumference, 106
bole height, tree height, within-row canopy radius, and between-row canopy radius) were measured 107
on each of the 16 trees (four per orchard) under which PAR was measured (Table S1). Canopy 108
volumes were then calculated approximating the canopy shape to either an ellipsoid or a cylinder. 109
The trees in the mature orchards were heterogeneous in size, with canopy volumes ranging from 56 110
to 135 m3 in mature orchard A and from 56 to 285 m3 in mature orchard B. In the young orchards, 111
tree canopy ranged from 8 to 25 m3 in young orchard A and from 12 to 29 m3 young orchard B. 112
In each orchard, 24 PAR sensors (GaAsP photosensors, Hamamatsu, Japan), previously 113
calibrated with a quantum sensor (LI-190; LI-COR Inc., Lincoln, NE, USA) and connected to a 114
datalogger (GP2, Delta-T Devices Ltd, Cambridge, UK), were placed in a grid in the rectangular 115
area between the four adjacent trees. The grid was designed with regular spacing to be 116
representative of the whole area. Measurements were made in September and October 2016, over 117
two-five days in each orchard (Table 1), measuring PAR every minute. Daily PAR incident on each 118
orchard was then computed by summing the minutely values for the whole daylight period. 119
Measurement days included clear, partly overcast, and heavily overcast days, as indicated by the 120
total daily incident PAR measured outside the orchard with a PAR sensor (LI-190; LI-COR Inc., 121
Lincoln, NE, USA) connected to a datalogger recording PAR every minute (Table 1). 122
123
2.2 Light interception model
124
Most 3D canopy light interception models do not run on a minutely time scale. Therefore, to 125
compare PAR measured every minute with modeled PAR, we built a model capable of modeling 126
light at any time scale. The model is built using the R statistical computing software version 3.5.1 127
(R Core Team, 2018). The model utilizes a horizontal scene, onto which trees can be placed, and a 128
hemispherical sky discretized into one-degree by one-degree grid cells. The location of the sun and 129
the proportions of direct and diffuse radiation are first calculated using the solaR package 130
(Perpiñán, 2012) using a supplied date, time, and latitude. The proportions of direct and diffuse 131
radiation are calculated following the method of Collares-Pereira and Rabl (1979). Direct radiation 132
is allocated to the sky cell where the sun is located, and diffuse radiation is allocated uniformly 133
across the entire sky. If a day is deemed completely overcast (two days in this study), then both 134
direct and diffuse radiation are allocated uniformly across the entire sky. 135
6 Tree canopies are placed onto the scene using an x and y location, upper and lower heights 136
of the crown, a uniform canopy porosity (Table 1), and crown radii: two independent radii for an 137
ellipsoid or one uniform radius (i.e. the average of the radii measured in two directions) for a 138
cylinder (Table S1). For a given point of interest on the scene floor, a line is drawn between each 139
sky grid cell and the point. The radiation transmitted to the point is the sum of the radiation of all 140
sky grid cells, with the radiation from a given sky cell reduced by the canopy porosity if its line 141
intersects a tree canopy. Tree canopies are assumed to reduce radiation uniformly regardless of the 142
path length of a radiation ray through the canopy. The effect of tree trunks was assumed negligible 143
during the months of the experiment, as all trees had full foliage (Dupraz et al. 2018). Sensors in the 144
field were placed in a grid within the rectangle between four adjacent trees, avoiding the border of 145
the orchard, to avoid edge effects. Similarly, the model for each orchard included two additional 146
rows of trees in all directions; the dimensions of additional trees in each orchard were taken as the 147
mean of the four primary trees in that orchard. 148
The purpose of the study was not to assess whether the model could correctly estimate total 149
daily PAR transmitted under the trees, but rather to investigate whether the intra-daily variability of 150
the PAR pattern affects estimation of daily An and RUE of an understory crop leaf. Therefore, we 151
set the canopy porosity for each orchard and canopy shape that provided the best match of measured 152
and modeled daily PAR averaged across the 24 sensors (Fig. 1; Table 1). By matching measured 153
and modeled daily PAR, any difference in estimated daily An can be attributed to different daily 154
patterns of PAR transmitted under the canopy. The model and the data files are available on 155
GitHub: https://github.com/kevinwolz/Rosati_etal_2019. 156
157
2.3 Modeling daily An with measured and modeled light 158
The daily An for an understory crop leaf was estimated by using the Farquhar model 159
(Farquhar et al., 1980) with parameters for winter wheat (Triticum aestivum; Guo et al., 2015). 160
Wheat was selected because it is the most common crop grown in temperate alley cropping 161
experiments to date (Wolz and DeLucia, 2018). Instantaneous An was estimated from instantaneous 162
PAR via eight different approaches: using measured or modeled data, each as measured each 163
minute, or averaged over half-hour, hour, or all daylight hours. Daily An for each sensor was then 164
obtained for each calculation approach by summing instantaneous An over each day (for further 165
details on this approach see Rosati et al., 2003; 2004). The daily An obtained with measured 166
minutely PAR was assumed to be the most realistic, thus all other approaches were compared to this 167
An. Daily RUE was then calculated by dividing daily An, obtained with the different PAR data, by
168
its respective daily incident PAR. 169
170
2.4 Sensitivity analysis
171
To ensure that results were relevant beyond the specific leaf physiology of winter wheat 172
measured in Guo et al. (2015), a sensitivity analysis of the overestimation of daily An in the 173
understory crop to the Farquhar et al. (1980) photosynthesis model parameters was performed. This 174
was done by estimating daily An using a range of values for the three key Farquhar et al. (1980) 175
model parameters: (1) Vc,max, the maximum RuBP saturated rate of carboxylation ( mol m-2 s-1), (2) 176
Jmax, the maximum rate of electron transport used in the regeneration of RuBP ( mol m-2 s-1), and 177
(3) Rd, the mitochondrial respiration rate in the day ( mol m-2 s-1). The ranges explored for Vc,max 178
and Rd were taken from the ranges measured in winter wheat by Sun et al. (2015). Since Vc,max and 179
Jmax are known to be highly correlated across plant species and plant functional types (Wullschleger 180
1993, Walker et al. 2014), the values explored for Jmax were calculated from the Vc,max values and 181
the relationship demonstrated by Walker et al. (2014). 182
183
3. Results 184
Even though we set the canopy porosity so that total daily modeled and measured PAR below the 185
orchard were matched (Fig. 1), the difference in the daily patterns between measured and modeled 186
8 188
Fig. 1 Average modeled vs. measured daily PAR incident on the understory crop across the
189
orchard floor after calibration of the canopy porosity in each orchard. Point shapes represent the
190
different orchards, and point color represent the two modeled canopy geometries (ellipsoid: black;
191
cylinder: grey).
192 193
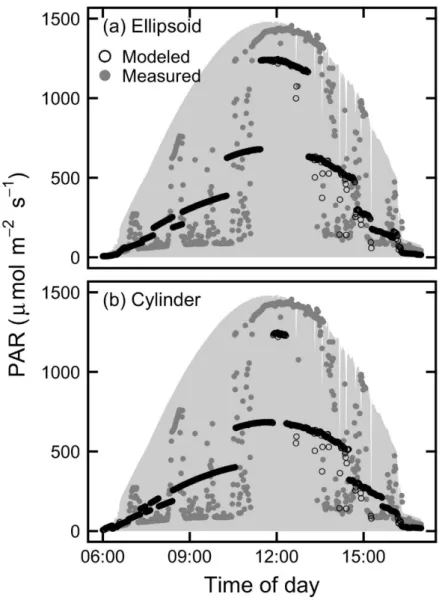
While generally following the same trends, measured data was much more variable, whereas 194
modeled data maintained smooth curves since the modeled light is passing through unrealistically 195
homogeneous canopies (Fig. 2). Since the results were nearly identical when modeling canopy 196
shape as a cylinder or as an ellipsoid, the rest of results are shown only for one shape (i.e. ellipsoid). 197
198
Fig. 2 Representative example time series of measured and modeled minutely PAR from one
199
sensor under the canopy in the Young A orchard on a clear day. The shaded area shows the PAR
200
incident on the orchard above the tree canopy. Modeled data is shown for (a) ellipsoidal and (b)
201
cylindrical tree canopies.
202 203 204
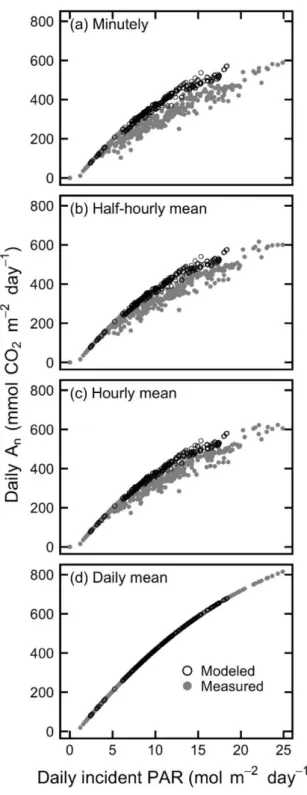
An always increased with daily incident PAR, both when estimated with measured or with 205
modeled PAR, and when estimated using the minutely PAR data, or the half-hour, hour and daily 206
PAR averages (Fig. 3). However, An was always greater at any PAR value when estimated with 207
modeled PAR, both for minutely PAR and at any time averaging level except for daily averages, 208
10 where it was the same by default design of the modeling (i.e. when using a single PAR value for a 209
day, there is no difference in daily pattern between modeled and measured data, and the response 210
curve takes the shape of the instantaneous response curve). Daily An estimated with modeled PAR 211
was also less variable at any given daily PAR. Daily RUE was similarly overestimated with 212
modeled data and more scattered with measured data (Fig. 4). 213
215
216
Fig. 3 Measured and modeled daily An as a function of daily incident PAR. Modeled data is for
217
ellipsoidal tree canopies. Each point represents one of the 24 sensor locations for one of the 11
218
orchard-date combinations measured in the field. Daily An is calculated using incident PAR
219
averaged at the (a) minutely, (b) half-hourly, (c) hourly, and (d) daily level.
12 221
222
Fig. 4 Measured and modeled daily RUE as a function of daily incident PAR. Modeled data is for
223
ellipsoidal tree canopies. Each point represents one of the 24 sensor locations for one of the 11
224
orchard-date combinations measured in the field. Daily RUE is calculated using incident PAR
225
averaged at the (a) minutely, (b) half-hourly, (c) hourly, and (d) daily level.
Compared to daily An estimated using the actual (i.e. measured minutely) PAR, modeled 227
minutely PAR overestimated daily An by an average of 26% across all orchards (top right panel; 228
Fig. 5). When temporally averaging the light as well, in addition to the spatial averaging of light 229
inherent in the model (i.e. uniform canopy porosity), the overestimation increased: Half-hourly 230
(28%) and hourly (29%) approaches were only marginally worse, but calculating daily An using 231
mean daily modeled PAR resulted in overestimation by 46%. Using temporal averages of measured 232
PAR overestimated daily An less than with the corresponding modeled PAR, except for daily 233
averages, with daily An overestimations of 7%, 11% and 49% respectively for half-hourly hourly 234
and daily averages (Fig. 5). 235
14 236
Fig. 5 Comparison between daily An calculated from measured minutely PAR (x-axis) and daily An
237
calculated from measured/modeled PAR in each temporal averaging window. Each point
238
represents the mean of the 24 sensor locations for one of the 11 orchard-date combinations
239
measured in the field.
240
The overestimations of daily An resulted in similar overestimations of daily RUE (Fig. 6). 241
242
Fig. 6 Comparison between daily RUE calculated from measured minutely PAR (x-axis) and daily
243
RUE calculated from measured/modeled PAR in each temporal averaging window. Each point
244
represents the mean of the 24 sensor locations for one of the 11 orchard-date combinations
245
measured in the field.
246
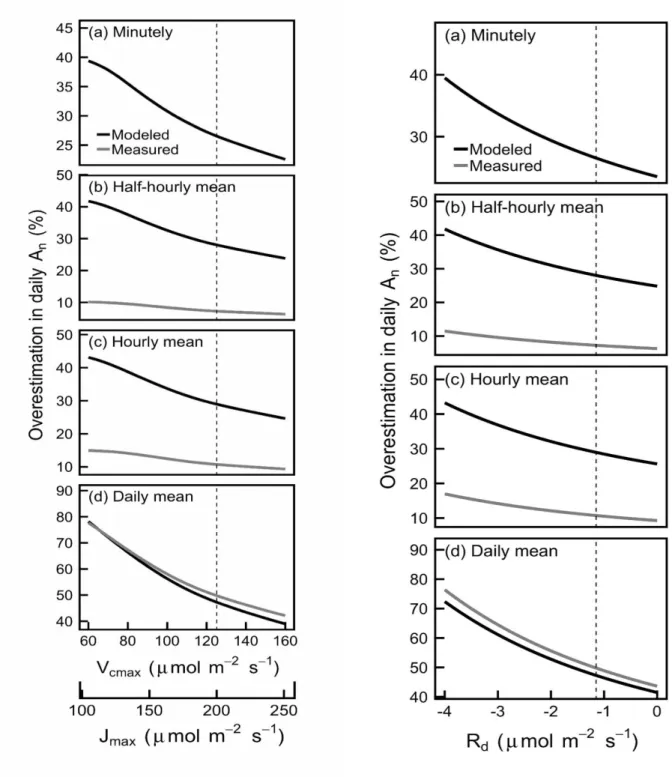
The sensitivity analysis (i.e. estimating An with a range of photosynthetic model parameter 247
values for the understory crop) showed that modeling and averaging PAR resulted in large 248
16 overestimation of An for any realistic values of the Farquhar et al. (1980) model parameters (i.e. 249
Vc,max, Jmax and Rd: Fig. 7).
250 251
A B
252
Fig. 7 Sensitivity analysis of the overestimation of daily An (A) and RUE (B) in the understory crop
253
calculated as in figure 5 and 6, but at varying Vc,max, Jmax and Rd parameters of the Farquhar et al.
254
(1980) photosynthesis model. The vertical dotted line represents the parameter values used in all
255
other figures.
18 257
4. Discussion 258
Our hypothesis was that, by averaging the PAR transmitted under the tree canopy in space (i.e. by 259
approximating canopy shapes and assuming uniform canopy porosity) and time, crop models 260
overestimate An and RUE of understory crops. The results fully supported the hypothesis. Daily An 261
estimated with measured minutely PAR was always lower than the An estimated using the modeled 262
PAR, even when modeling PAR for every minute (Fig. 3). Averaging in time further increased the 263
overestimation, both for modeled and measured PAR. By comparing daily An estimated with 264
measured and modeled PAR at the different time resolutions, the overestimations were shown to be 265
large (Fig. 5). This resulted in similar overestimation of RUE (Fig. 4 and 6). The sensitivity 266
analysis showed that this overestimation remained substantial across realistic values of the Farquhar 267
et al. (1980) photosynthesis model parameters for the understory crop (Fig.7). 268
It has long been known that averaging of light in space and/or time overestimates An (Sinclair 269
et al., 1976; Spitters, 1986). In previous work (Rosati et al., 2003), we also found that averaging 270
measured PAR over one hour resulted in overestimation of daily An of different leaves within a tree 271
canopy. However, in a tree or indeed any overstory canopy, most of the photosynthesis is 272
contributed by the outer-canopy, better-exposed leaves, which receive a more uniform irradiance. 273
Understory crops are instead exposed to more variable light patterns even on their outer-canopy 274
leaves. Therefore, quantifying the overestimation of An with averaging of light is likely more 275
important. This is the first time that the overestimation is quantified for an understory crop exposed 276
to the PAR transmitted by the overstory canopy, a typical agroforestry situation. 277
Additionally, our data allowed us to analyze the overestimation due to time and space 278
averaging. Figure 5 shows that daily An was overestimated by about 7% when averaging measured 279
PAR data to half-hour intervals, by 11% when averaging hourly, and by 49% when averaging over 280
the entire daylight period. Therefore, time averaging, even at intervals as short as half-hour, results 281
in important overestimations of daily An. However, the overestimation was much greater at any time 282
averaging step, when using modeled PAR (i.e. approximating tree canopies to regular shape and 283
assuming uniform canopy porosity). When using the modeled PAR at minutely time steps, the 284
overestimation was 26%, more than two or three times the overestimation observed with hourly or 285
half-hourly averages of measured data, respectively. 286
Given that the overestimation results from averaging variable PAR, these results suggest that, 287
at least under the conditions of this experiment, approximating tree canopies to regular shape and 288
assuming uniform canopy porosity results in averaging PAR to a larger extent than hourly time 289
averaging. In fact, it appears clearly that modeled PAR remains at almost constant values for up to 290
three hours, while measured PAR is much more variable (Fig. 2). This suggests that approximating 291
tree canopies to a regular shape and assuming uniform canopy porosity results in greater model bias 292
than setting half-hourly or hourly time steps to save computational effort. This could be due, at least 293
in part, to the fact that our model assumed a regular canopy shape and a uniform canopy porosity, 294
neglecting both clumping (and gaps), and the actual canopy depth crossed by light rays, which 295
depends on where the ray passes (i.e. canopy center or margins). Simple geometrical shapes are 296
very rough approximations of real tree shapes, and leaves are clustered within shoots (Cohen et al. 297
1995; Falster and Welstoby, 2003). Finer geometry descriptions have divided the canopy either in 298
sub-volumes (Mariscal et al. 2000) or voxels (Knyazikhin et al. 1996; Sinoquet et al. 2005). Leaf 299
area distribution within sub-volumes may be considered uniform or described by statistical 300
functions (Wang and Jarvis 1990; Cescatti 1997). Finer canopy descriptions result in dramatic 301
increases in computation time (Mialet-Serra et al. 2001; Roupsard et al. 2008) and, while improving 302
model predictions (Sinoquet et al. 2005), light patterns are still averaged at some levels of space and 303
time. Based on the present results, averaging, even at the scale of relatively short time and/or space 304
intervals, results in important overestimations of daily An. 305
For instance, Zhao et al. (2003) accounted for some of these aspects in their model and found 306
the modeled and measured light to be very similar when averaged over half-hour. In this model the 307
actual canopy thickness crossed by each ray was considered, and gaps in the canopy where 308
20 accounted for by calculating the statistical probability of a ray to pass through the canopy without 309
intercepting a leaf (based on hemispherical photographs). However, this did not yield the actual 310
light available on a given point and time, but rather the “expected average radiation flux on the 311
point”. Therefore, while variations in canopy porosity and gap probability were considered, light 312
was still averaged compared to reality. Additionally, canopy shape was still approximated to a 313
regular geometric shape and leaf orientation was assumed to be spherical. Therefore, while better 314
representation of canopy porosity is noteworthy, it probably did not allow measured and modeled 315
transmitted light to match at the instantaneous time scale. Unfortunately, data were presented only 316
as half-hourly averages. At this scale, our results show An as overestimated by 7% when using 317
measured PAR, and by 26% when using modeled PAR. 318
Talbot and Dupraz (2012) also attempted to consider non-uniform canopy porosity, by 319
accounting for clamping with a clumping coefficient, but concluded that this did not improve model 320
predictions of transmitted light. However, this resulted from the fact that the clumping coefficient 321
was too dependent on the canopy volume adjustments procedure. They concluded that their model 322
was not suited to account for the effects of architectural specificities of individual trees. Their 323
results, therefore, do not suggest that more realistic modeling of light transmittance through the 324
canopy is not important, but only that other limitations, particularly the approximation of canopy 325
shape to regular geometric shapes, override possible improvements via other approaches. 326
Some light models use an explicit stand description at scale of shoot or leaf (Dauzat et al. 327
2001; Mialet-Serra et al. 2001; Casella and Sinoquet 2007; Lamanda et al. 2008). Models that 328
account for individual leaves are the most likely to predict light patterns under the tree canopy that 329
closely match the actual patterns, but these models are very demanding in terms of the number of 330
parameters needed and computational effort. Consequently, they are not suitable for field 331
agroforestry simulations (many trees), over long time scales. 332
When using modeled PAR, estimated daily An was not only higher but also less variable 333
than when using measured PAR, resulting in a narrower range of An values at any daily PAR (Fig. 334
3). This trend is also evident for RUE (Fig. 4). In other words, for a given daily incident PAR, 335
measured light results in more variable daily An and RUE than for modeled light. This is because a 336
given daily PAR can be obtained with long exposure at uniformly low irradiance or with short 337
alternating exposure at high and low irradiance. In the first case, daily An and RUE are higher, while 338
in the second case they are lower, despite having the same daily PAR, because fluctuating 339
irradiance negatively impact time-integrated photosynthesis at equal total irradiance (Külheim et al., 340
2002; Poorter et al., 2016; Kromdijk et al., 2016; Vialet-Chabrand et al., 2017). By averaging in 341
space and time, modeling PAR reduces the difference in variability in the incident PAR (i.e. more 342
variable light is more affected by averaging than less variable light, which is already closer to an 343
average value), thus not only overestimating daily An and RUE but also reducing their variability at 344
any given daily PAR. 345
No current models used in agroforestry account for this variation in An and RUE with 346
different sub-canopy light patterns, because all models do some averaging of light in space and/or 347
time. The present results suggest that the light estimation approach used by these models is likely to 348
result in overestimation of An and RUE for understory crops. Some models, however, do not use 349
mechanistic approaches (e.g. Farquhar et al. 2018) to estimate An in the understory crop, but rather 350
convert daily incident PAR into biomass growth using empirical RUE coefficients. These RUE 351
coefficients are typically measured under field conditions or modeled, calibrated, and validated with 352
field measurements. However, our results show that RUE varies greatly not only with daily PAR, 353
but also with the daily PAR pattern, which, as discussed above, results in quite variable daily An 354
and RUE even at equal daily PAR (Fig. 4). The variation of RUE with daily PAR is well 355
established, and the shape of the RUE response curve to daily PAR (Fig. 4) closely resembles the 356
one we previously published (Rosati et al. 2004) or the one often used in modeling (e.g. STICS 357
component in the Hi-SAFe agroforestry model; Brisson et al. 2009, Dupraz et al. 2019). However, 358
in these models, the RUE of the crop is calibrated under full-sun conditions, with a more uniform 359
PAR pattern compared to that experienced under tree canopies. The present work suggests that, 360
22 when such calibrations in open fields are used in the crop component of agroforestry models, they 361
are likely to overestimate the An and RUE of the crop under the trees. In this work, with chestnut 362
orchards with different tree ages and spacing, An of the understory crop was overestimated by 26-363
46% (Fig. 5), and RUE by 22-38% (Fig. 6). 364
The impact of these results on global biophysical models is difficult to predict. Most crop-365
only models are applied only in full-sun situations, and most forest models do not model 366
photosynthesis directly. Nevertheless, considering that agroforestry is practiced on almost half of all 367
agricultural area worldwide (Nair et al. 2009), and there is increasing interest in mixed tree-crop 368
land uses, it will be critical to consider these results to correctly develop global biophysical 369 agroforestry models. 370 371 5. Conclusions 372
The current results suggest that modeling understory crop An and RUE is quite challenging for 373
several reasons. First, the daily PAR incident over the understory canopy varies from place to place 374
during the same day, therefore the modeling must be done separately for different positions, 375
receiving different daily PAR. Some models account for this by estimating the PAR incident under 376
the trees at various space scales, then using this PAR to run the crop sub-model for each area unit 377
(e.g. STICS crop model in the Hi-sAFe agroforestry model, Dupraz et al., 2019). However, the 378
daily PAR transmitted in each area under the trees estimated by the models is not realistic, being 379
more uniform than in reality, thus probably resulting in overestimated crop RUE. 380
Ideally, therefore, crop RUE should be calculated under real agroforestry situations, using 381
experimental agroforestry setups. While possible, this complicates model calibration, especially 382
considering, as discussed above, that different agroforestry situations result in different light 383
patterns of daily PAR, resulting in substantially different possible RUE values for a given daily 384
PAR (i.e. high variability of RUE for any daily PAR value, Fig. 4). With varying whether 385
conditions (i.e. frequency of sunny and overcast days), seasons (i.e. duration and intensity of 386
radiation), tree age (i.e. canopy size) and relative shade patterns, and position under the trees, the 387
transmitted PAR pattern under the trees can vary greatly even for an equal daily total PAR, 388
resulting in variable RUE values. Therefore, estimating the correct RUE in agroforestry models 389
might be more challenging than previously thought. Possible solutions to overcome these modeling 390
challenges are desirable. 391
24 Acknowledgements
392
This work was supported by a Fulbright research scholarship 2016, that was awarded to the 393
first author, allowing him to visit the Center for Agroforestry at the University of Missouri, 394
Columbia, MO, USA, and to collaborate with the other authors. The work was also supported by 395
the European Union's Horizon 2020 Research and Innovation programme under Grant agreement 396
No. 776467 (MED-GOLD project). 397
398
References 399
Bayala, J., Sanou, J., Teklehaimanot, Z., Ouedraogo, S.J., Kalinganire, A., Coe, R., Noordwijk, M. 400
van, 2015. Advances in knowledge of processes in soil–tree–crop interactions in parkland 401
systems in the West African Sahel: A review. Agriculture, Ecosystems & Environment 205, 402
25–35. https://doi.org/10.1016/j.agee.2015.02.018
403
Brisson, N., M. Launay, B. Mary, and N. Beaudoin (Eds.) 2009. Conceptual Basis, Formalisations 404
and Parameterization of the STICS Crop Model, 304 pp., Ed. Quae, Versailles, France. 405
Cardinael, R., Chevallier, T., Barthès, B.G., Saby, N.P.A., Parent, T., Dupraz, C., Bernoux, M., 406
Chenu, C., 2015. Impact of alley cropping agroforestry on stocks, forms and spatial 407
distribution of soil organic carbon — A case study in a Mediterranean context. Geoderma 408
259–260, 288–299. https://doi.org/10.1016/j.geoderma.2015.06.015 409
Carmo‐ Silva, E., Scales, J.C., Madgwick, P.J., Parry, M. a. J., 2015. Optimizing Rubisco and its 410
regulation for greater resource use efficiency. Plant, Cell & Environment 38, 1817–1832. 411
https://doi.org/10.1111/pce.12425 412
Casella, E., Slnoquet, H., 2007. Botanical determinants of foliage clumping and light interception in 413
two-year-old coppice poplar canopies: assessment from 3-D plant mockups. Annals of 414
Forest Scince 64, 395–404. https://doi.org/10.1051/forest:2007016 415
Cescatti, A., 1997. Modelling the radiative transfer in discontinuous canopies of asymmetric 416
crowns. I. Model structure and algorithms. Ecological Modelling 101, 263–274. 417
https://doi.org/10.1016/S0304-3800(97)00050-1 418
Chazdon, R.L., Pearcy, R.W., 1986. Photosynthetic responses to light variation in rainforest 419
species. Oecologia 69, 524–531. https://doi.org/10.1007/BF00410358 420
Chimonyo, V.G.P., Modi, A.T., Mabhaudhi, T., 2015. Perspective on crop modelling in the 421
management of intercropping systems. Archives of Agronomy and Soil Science 61, 1511– 422
1529. https://doi.org/10.1080/03650340.2015.1017816 423
Cohen, S., Mosoni, P., Meron, M., 1995. Canopy clumpiness and radiation penetration in a young 424
hedgerow apple orchard. Agricultural and Forest Meteorology 76, 185–200. 425
https://doi.org/10.1016/0168-1923(95)02226-N 426
Collares-Pereira, M., Rabl, A., 1979. The average distribution of solar radiation-correlations 427
between diffuse and hemispherical and between daily and hourly insolation values. Solar 428
Energy 22, 155–164. https://doi.org/10.1016/0038-092X(79)90100-2 429
Dauzat, J., Rapidel, B., Berger, A., 2001. Simulation of leaf transpiration and sap flow in virtual 430
plants: model description and application to a coffee plantation in Costa Rica. Agricultural 431
and Forest Meteorology 109, 143–160. https://doi.org/10.1016/S0168-1923(01)00236-2 432
Doré, T., Makowski, D., Malézieux, E., Munier-Jolain, N., Tchamitchian, M., Tittonell, P., 2011. 433
Facing up to the paradigm of ecological intensification in agronomy: Revisiting methods, 434
concepts and knowledge. European Journal of Agronomy 34, 197–210. 435
https://doi.org/10.1016/j.eja.2011.02.006 436
Dufour, L., Metay, A., Talbot, G., Dupraz, C., 2013. Assessing Light Competition for Cereal 437
Production in Temperate Agroforestry Systems using Experimentation and Crop Modelling. 438
Journal of Agronomy and Crop Science 199, 217–227. https://doi.org/10.1111/jac.12008 439
Dupraz, C., 2005. From silvopastoral to silvoarable systems in Europe: sharing concepts, unifying 440
policies. Silvopastoralism and sustainable land management. CAB International, 441
Wallingford 432. 442
Dupraz, C., Blitz-Frayret, C., Lecomte, I., Molto, Q., Reyes, F., Gosme, M., 2018. Influence of 443
26 latitude on the light availability for intercrops in an agroforestry alley-cropping system. 444
Agroforestry Systems 92:1019–1033. doi: 10.1007/s10457-018-0214-x 445
Dupraz, C., Wolz, K.J., Lecomte, I., Talbot, G., Vincent, G., Mulia, R., Bussière, F., Ozier-446
Lafontaine, H., Andrianarisoa, S., Jackson, N., Lawson, G., Dones, N., Sinoquet, H., 447
Lusiana, B., Harja, D., Domenicano, S., Reyes, F., Gosme, M., Van Noordwijk, M., 2019. 448
Hi-sAFe: A 3D Agroforestry Model for Integrating Dynamic Tree–Crop Interactions. 449
Sustainability 11, 2293. https://doi.org/10.3390/su11082293 450
Falster, D.S., Westoby, M., 2003. Leaf size and angle vary widely across species: what 451
consequences for light interception? New Phytologist 158, 509–525. 452
https://doi.org/10.1046/j.1469-8137.2003.00765.x 453
Farquhar, G.D., Caemmerer, S. von, Berry, J.A., 1980. A biochemical model of photosynthetic CO2 454
assimilation in leaves of C3 species. Planta 149, 78–90. 455
https://doi.org/10.1007/BF00386231 456
Friday, J.B., Fownes, J.H., 2002. Competition for light between hedgerows and maize in an alley 457
cropping system in Hawaii, USA. Agroforestry Systems 55, 125–137. 458
https://doi.org/10.1023/A:1020598110484 459
Garrity, D.P., Akinnifesi, F.K., Ajayi, O.C., Weldesemayat, S.G., Mowo, J.G., Kalinganire, A., 460
Larwanou, M., Bayala, J., 2010. Evergreen Agriculture: a robust approach to sustainable 461
food security in Africa. Food Security 2, 197–214. https://doi.org/10.1007/s12571-010-462
0070-7 463
Guo, L.P., Kang, H.J., Ouyang, Z., Zhuang, W., Yu, Q., 2015. Photosynthetic parameter estimations 464
by considering interactive effects of light, temperature and CO2 concentration. International 465
Journal of Plant Production 9, 321-345. https://doi.org/10.22069/ijpp.2015.2220 466
Hirose, T., Bazzaz, F.A., 1998. Trade-off Between Light- and Nitrogen-use Efficiency in Canopy 467
Photosynthesis. Annals of Botany 82, 195–202. https://doi.org/10.1006/anbo.1998.0668
Jose, S., Gillespie, A.R., Pallardy, S.G., 2004. Interspecific interactions in temperate agroforestry. 469
Agroforestry Systems 61:237-255 470
Knapp, A.K., Smith, W.K., 1987. Stomatal and photosynthetic responses during sun/shade 471
transitions in subalpine plants: influence on water use efficiency. Oecologia 74, 62–67. 472
https://doi.org/10.1007/BF00377346 473
Knörzer, H., Grözinger, H., Graeff-Hönninger, S., Hartung, K., Piepho, H.-P., Claupein, W., 2011. 474
Integrating a simple shading algorithm into CERES-wheat and CERES-maize with 475
particular regard to a changing microclimate within a relay-intercropping system. Field 476
Crops Research 121, 274–285. https://doi.org/10.1016/j.fcr.2010.12.016 477
Knyazikhin, Yu., Kranigk, J., Miessen, G., Panfyorov, O., Vygodskaya, N., Gravenhorst, G., 1996. 478
Modelling three-dimensional distribution of photosynthetically active radiation in sloping 479
coniferous stands. Biomass and Bioenergy, Modelling Short Rotation Forestry Growth 11, 480
189–200. https://doi.org/10.1016/0961-9534(96)00010-4 481
Kromdijk, J., Głowacka, K., Leonelli, L., Gabilly, S.T., Iwai, M., Niyogi, K.K., Long, S.P., 2016. 482
Improving photosynthesis and crop productivity by accelerating recovery from 483
photoprotection. Science 354, 857–861. https://doi.org/10.1126/science.aai8878 484
Külheim, C., Ågren, J., Jansson, S., 2002. Rapid Regulation of Light Harvesting and Plant Fitness 485
in the Field. Science 297, 91–93. https://doi.org/10.1126/science.1072359 486
Lamanda, N., Dauzat, J., Jourdan, C., Martin, P., Malézieux, E., 2008. Using 3D architectural 487
models to assess light availability and root bulkiness in coconut agroforestry systems. 488
Agroforestry Systems 72, 63–74. https://doi.org/10.1007/s10457-007-9068-3
489
Lawson, T., Kramer, D.M., Raines, C.A., 2012. Improving yield by exploiting mechanisms 490
underlying natural variation of photosynthesis. Current Opinion in Biotechnology, Food 491
biotechnology - Plant biotechnology 23, 215–220. 492
https://doi.org/10.1016/j.copbio.2011.12.012
493
Liagre, F., Dupraz, C., Angeniol, C., Canet, A., Ambroise, R., 2009. Agroforestry adoption in 494
28 France: a take off. In: World Congress of Agroforestry (ed) Agroforestry—the future of 495
global land use. World Agroforestry Centre, Nairobi, p 118. 496
Lovell, S.T., Dupraz, C., Gold, M., Jose, S., Revord, R., Stanek, E., Wolz, K.J. 2017. Temperate 497
agroforestry research: considering multifunctional woody polycultures and the design of 498
long-term field trials. Agroforestry Systems 263:1–19. doi: 10.1007/s10457-017-0087-4. 499
Luedeling, E., Sileshi, G., Beedy, T., Dietz, J., 2011. Carbon Sequestration Potential of 500
Agroforestry Systems in Africa, in: Kumar, B.M., Nair, P.K.R. (Eds.), Carbon Sequestration 501
Potential of Agroforestry Systems: Opportunities and Challenges, Advances in 502
Agroforestry. Springer Netherlands, Dordrecht, pp. 61–83. https://doi.org/10.1007/978-94-503
007-1630-8_4 504
Luedeling, E., Smethurst, P.J., Baudron, F., Bayala, J., Huth, N.I., van Noordwijk, M., Ong, C.K., 505
Mulia, R., Lusiana, B., Muthuri, C., Sinclair, F.L., 2016. Field-scale modeling of tree–crop 506
interactions: Challenges and development needs. Agricultural Systems 142, 51–69. 507
https://doi.org/10.1016/j.agsy.2015.11.005 508
Malézieux, E., Crozat, Y., Dupraz, C., Laurans, M., Makowski, D., Ozier-Lafontaine, H., Rapidel, 509
B., de Tourdonnet, S., Valantin-Morison, M., 2009. Mixing Plant Species in Cropping 510
Systems: Concepts, Tools and Models: A Review, in: Lichtfouse, E., Navarrete, M., 511
Debaeke, P., Véronique, S., Alberola, C. (Eds.), Sustainable Agriculture. Springer 512
Netherlands, Dordrecht, pp. 329–353. https://doi.org/10.1007/978-90-481-2666-8_22 513
Mariscal, M.J., Orgaz, F., Villalobos, F.J., 2000. Modelling and measurement of radiation 514
interception by olive canopies. Agricultural and Forest Meteorology 100, 183–197. 515
https://doi.org/10.1016/S0168-1923(99)00137-9 516
Mialet-Serra, I., Dauzat, J., Auclair, D., 2001. Using plant architectural models for estimation of 517
radiation transfer in a coconut-based agroforestry system. Agroforestry Systems 53, 141– 518
149. https://doi.org/10.1023/A:1013320419289
519
Nair, P.K.R., Kumar, B.M., Nair, V.D. 2009. Agroforestry as a strategy for carbon sequestration. 520
Journal of Plant Nutrition and Soil Science 172, 10–23 521
Palma, J., Graves, A.R., Burgess, P.J., van der Werf, W., Herzog, F., 2007. Integrating 522
environmental and economic performance to assess modern silvoarable agroforestry in 523
Europe. Ecological Economics, Sustainability and Cost-Benefit Analysis 63, 759–767. 524
https://doi.org/10.1016/j.ecolecon.2007.01.011 525
Pearcy, R.W., Krall, J.P., Sassenrath-Cole, G.F., 1996. Photosynthesis in Fluctuating Light 526
Environments, in: Baker, N.R. (Ed.), Photosynthesis and the Environment, Advances in 527
Photosynthesis and Respiration. Springer Netherlands, Dordrecht, pp. 321–346. 528
https://doi.org/10.1007/0-306-48135-9_13 529
Pearcy, R.W., Roden, J.S., Gamon, J.A., 1990. Sunfleck dynamics in relation to canopy structure in 530
a soybean (Glycine max (L.) Merr.) canopy. Agricultural and Forest Meteorology 52, 359– 531
372. https://doi.org/10.1016/0168-1923(90)90092-K 532
Perpiñan Lamigueiro, O., 2012. solaR: Solar Radiation and Photovoltaic Systems with R. Journal of 533
Statistical Software 50, 1–32. 534
Poorter, H., Fiorani, F., Pieruschka, R., Wojciechowski, T., Putten, W.H. van der, Kleyer, M., 535
Schurr, U., Postma, J., 2016. Pampered inside, pestered outside? Differences and similarities 536
between plants growing in controlled conditions and in the field. New Phytologist 212, 838– 537
855. https://doi.org/10.1111/nph.14243 538
Rosati, A., Dejong, T.M., 2003. Estimating Photosynthetic Radiation Use Efficiency Using Incident 539
Light and Photosynthesis of Individual Leaves. Annals of Botany 91, 869–877. 540
https://doi.org/10.1093/aob/mcg094 541
Rosati, A., Metcalf, S.G., Lampinen, B.D., 2004. A Simple Method to Estimate Photosynthetic 542
Radiation Use Efficiency of Canopies. Annals of Botany 93, 567–574. 543
https://doi.org/10.1093/aob/mch081 544
Roupsard, O., Dauzat, J., Nouvellon, Y., Deveau, A., Feintrenie, L., Saint-André, L., Mialet-Serra, 545
I., Braconnier, S., Bonnefond, J.-M., Berbigier, P., Epron, D., Jourdan, C., Navarro, M., 546
30 Bouillet, J.-P., 2008. Cross-validating Sun-shade and 3D models of light absorption by a 547
tree-crop canopy. Agricultural and Forest Meteorology 148, 549–564. 548
https://doi.org/10.1016/j.agrformet.2007.11.002 549
Sinclair, T.R., Murphy, C.E., Knoerr, K.R., 1976. Development and Evaluation of Simplified 550
Models for Simulating Canopy Photosynthesis and Transpiration. Journal of Applied 551
Ecology 13, 813–829. https://doi.org/10.2307/2402257 552
Sinoquet, H., Sonohat, G., Phattaralerphong, J., Godin, C., 2005. Foliage randomness and light 553
interception in 3-D digitized trees: an analysis from multiscale discretization of the canopy. 554
Plant, Cell & Environment 28, 1158–1170. https://doi.org/10.1111/j.1365-555
3040.2005.01353.x 556
Spitters, C.J.T., Toussaint, H.A.J.M., Goudriaan, J., 1986. Separating the diffuse and direct 557
component of global radiation and its implications for modeling canopy photosynthesis Part 558
I. Components of incoming radiation. Agricultural and Forest Meteorology 38, 217–229. 559
https://doi.org/10.1016/0168-1923(86)90060-2 560
Sun, Jingsong, Sun, Jindong, Feng, Z., 2015. Modelling photosynthesis in flag leaves of winter 561
wheat (Triticum aestivum) considering the variation in photosynthesis parameters during 562
development. Functional Plant Biology 42, 1036–1044. https://doi.org/10.1071/FP15140 563
Talbot, G., Dupraz, C., 2012. Simple models for light competition within agroforestry 564
discontinuous tree stands: are leaf clumpiness and light interception by woody parts relevant 565
factors? Agroforestry Systems 84, 101–116. https://doi.org/10.1007/s10457-011-9418-z 566
Team, R.C., 2017. R: A language and environment for statistical com-puting. R Foundation for 567
Statistical Computing, Vienna, Austria. 568
Vialet-Chabrand, S., Matthews, J.S.A., Simkin, A.J., Raines, C.A., Lawson, T., 2017. Importance of 569
Fluctuations in Light on Plant Photosynthetic Acclimation. Plant Physiology 173, 2163– 570
2179. https://doi.org/10.1104/pp.16.01767
Walker, A.P., Beckerman, A.P., Gu, L., Kattge, J., Cernusak, L.A., Domingues, T.F., Scales, J.C., 572
Wohlfahrt, G., Wullschleger, S.D., Woodward, F.I. 2014. The relationship of leaf 573
photosynthetic traits–Vcmax and Jmax–to leaf nitrogen, leaf phosphorus, and specific leaf 574
area: a meta‐ analysis and modeling study. Ecology and evolution, 4(16), pp.3218-3235 575
Wang, Y.P., Jarvis, P.G., 1990. Description and validation of an array model — MAESTRO. 576
Agricultural and Forest Meteorology 51, 257–280. https://doi.org/10.1016/0168-577
1923(90)90112-J 578
Way, D.A., Pearcy, R.W., 2012. Sunflecks in trees and forests: from photosynthetic physiology to 579
global change biology. Tree Physiology 32, 1066–1081. 580
https://doi.org/10.1093/treephys/tps064 581
Wolz, K.J., DeLucia, E.H., 2018. Alley cropping: Global patterns of species composition and 582
function. Agriculture, Ecosystems & Environment 252, 61–68. 583
https://doi.org/10.1016/j.agee.2017.10.005
584
Wullschleger, S.D. 1993. Biochemical limitations to carbon assimilation in C3 plants—a 585
retrospective analysis of the A/Ci curves from 109 species. Journal of experimental botany, 586
44(5), pp.907-920 587
Zamora, D.S., Jose, S., Jones, J.W., Cropper, W.P., 2009. Modeling cotton production response to 588
shading in a pecan alleycropping system using CROPGRO. Agroforestry Systems 76, 423– 589
435. https://doi.org/10.1007/s10457-008-9166-x 590
Zhao, W., Qualls, R.J., Berliner, P.R., 2003. Modeling of the short wave radiation distribution in an 591
agroforestry system. Agricultural and Forest Meteorology 118, 185–206. 592
https://doi.org/10.1016/S0168-1923(03)00108-4 593
32 595
Table 1. Tree spacing, row orientation, daily incident PAR in the different measuring days, and 596
calibrated tree porosity for the four chestnut orchards used to measure the transmitted PAR on 24 597
positions under the canopies, during several days per orchard. 598
Orchard
Tree spacing (m) Row
orientation (˚E of N)
Daily incident PAR above orchard canopy (mol m-2)
Calibr.tree canopy porosity Within
rows
Between
rows Ellipsoid Cylinder
Mature A 9.3 8.2 168 36.5, 38.6 0.48 0.38 Mature B 8 8 131 31.6, 23.7, 27.3, 30.8, 30.9, 8.3 0.60 0.51 Young A 4 6.5 0 36.4, 37.2 0.47 0.47 Young B 4 6.5 0 9.3, 14.4, 31.6, 34.0, 34.4 0.54 0.49 599
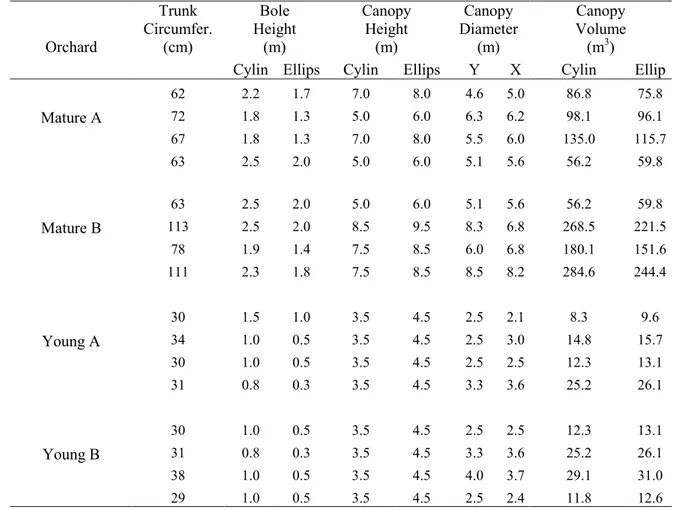
Table S1 Tree parameters for the 16 trees used in each of the four orchards. 600 Orchard Trunk Circumfer. (cm) Bole Height (m) Canopy Height (m) Canopy Diameter (m) Canopy Volume (m3)
Cylin Ellips Cylin Ellips Y X Cylin Ellip
Mature A 62 2.2 1.7 7.0 8.0 4.6 5.0 86.8 75.8 72 1.8 1.3 5.0 6.0 6.3 6.2 98.1 96.1 67 1.8 1.3 7.0 8.0 5.5 6.0 135.0 115.7 63 2.5 2.0 5.0 6.0 5.1 5.6 56.2 59.8 Mature B 63 2.5 2.0 5.0 6.0 5.1 5.6 56.2 59.8 113 2.5 2.0 8.5 9.5 8.3 6.8 268.5 221.5 78 1.9 1.4 7.5 8.5 6.0 6.8 180.1 151.6 111 2.3 1.8 7.5 8.5 8.5 8.2 284.6 244.4 Young A 30 1.5 1.0 3.5 4.5 2.5 2.1 8.3 9.6 34 1.0 0.5 3.5 4.5 2.5 3.0 14.8 15.7 30 1.0 0.5 3.5 4.5 2.5 2.5 12.3 13.1 31 0.8 0.3 3.5 4.5 3.3 3.6 25.2 26.1 Young B 30 1.0 0.5 3.5 4.5 2.5 2.5 12.3 13.1 31 0.8 0.3 3.5 4.5 3.3 3.6 25.2 26.1 38 1.0 0.5 3.5 4.5 4.0 3.7 29.1 31.0 29 1.0 0.5 3.5 4.5 2.5 2.4 11.8 12.6 601