ACCURATE AND FAST 3D INTERACTIVE SEGMENTATION
SYSTEM APPLIED TO MR BRAIN QUANTIFICATION
Alberto Signoroni*, Francesco Carletti†, Riccardo Grazioli*, Roberto Gasparotti†, and Riccardo Leonardi**DEA-University of Brescia, Brescia, Italy - email: [email protected]
†Dept.of Diagnostic Imaging, Univ.of Brescia, Neurorad. Unit, Spedali Civili, Brescia, Italy – email: [email protected] Keywords: interactive segmentation, quantitative brain analysis
Abstract
This work presents an efficient interactive segmentation system for volumetric data-sets based on advanced 3D morphological analyses and an interaction paradigm that allows a good match with user intentions. This system has been designed to produce accurate results under the complete control of the user, to minimize the interaction time and to address a generality of 3D segmentation tasks. The system has been tested and compared with other softwares on normal MR brain structure quantification and on a challenging clinical setting pointed to the detection of the presence of subtle brain atrophy associated to primitive immuno-deficiency (PID).
1 Introduction
Due to the hard separation between high-level human recognition power and machines’ computational power, interactive (user-guided) approaches are adopted in a predominant part of medical image segmentation techniques. Interactive segmentation systems (ISS) have been classified regarding their computational [1,2] rather than interactive part [3]. Different parts are designed (and/or selected) and put together in order to make the overall segmentation technique more or less suited and usable for certain applications [4]. Here we focalise on segmentation of volumetric anatomical data-sets and present the design and realization of a technique which implements a successful combination of visual interaction and non trivial morphological analysis tools. In our view, interactive segmentation of medical data-sets requires used technologies to be well matched with user centred intentional and semantic message exchange. Morphological techniques can be seen as well suited for such a cognitive matching in that they inherently deal with some image attributes that reflect significant image coherency features. Moreover 3D extension of morphological tools does not involve particular complexity issues (contrarily to what usually emerge in extending other kind of segmentation technologies, e.g. deformable models or level set methods). The implemented system presents good accuracy,
repeatability and efficiency capabilities, which are the
evaluation features highlighted for ISSs by Olabarriaga and Smeulders [3]. Furthermore we aim to guarantee an additional feature, namely generality, which has been used as a design criterion and constitutes a strength point of our system. Generality can be defined as the capability to deal with all
problems of a certain, suitably wide, class (characterized by a an a priori knowledge about the segmentation problem nature) despite the inherent degree of unpredictability (due to anatomic and pathological variety) and discrimination difficulties (due to the physical signal and noise limitations on the image information content). Generality is a valuable feature because techniques that are conceived to deal with general tasks are usually well adapted to be specialized for dedicated tasks (specialization can be modelled in terms of additional a-priori knowledge). The opposite is not generally true.
1.1 Interactive segmentation model
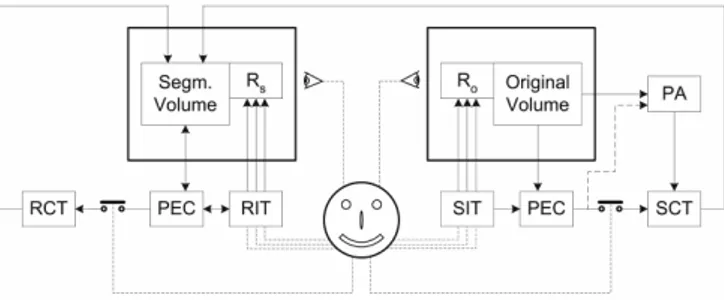
In Fig.1 we present our reference ISS user-centred model. The physician is represented with the smiling face and its actions with dashed lines. Segmentation and refinement interaction tools (SIT and RIT) are conceived as elements of segmentation and refinement toolboxes respectively. SIT and RIT should be designed, presented and selected according to data and working environment requirements and to the user skills. They should be also complete in representing different tasks and robust in providing different ways to communicate the same information. Relevance and adequacy of the ITs stem from the possibility of being translated in a set of quantitative parameters representing what the physician would like to communicate (which could be different from one tool to another). These parameters are estimated and calculated in the PEC blocks and conveyed as inputs to the segmentation and refinement computational tools (SCT, RCT) which should be conceived to be capable to fully exploit such information. A preprocessing analysis, PA computational block also appears into the scheme. This block is separated from the SCT because of its peculiar role into the segmentation pipeline. PA is in general allowed to receive some PEC parameters as well. SIT and RIT govern the data rendering engines (Ro and Rs).
2 Segmentation Interaction Tools
Interactive tools and their usage must be easy and self-explanatory with respect to the task to accomplish and the user culture. Different tools could differ by specific vocation but they should have usage intersections so that the physician could normally obtain desired results by choosing alternative tools. In our solution a set of visual interaction tools Sk∈SIT, k=1,…,4 have been designed. The Sk are presented to the user by an expressive icon. Each SIT is associated to a dedicated PEC translator. Not necessarily the set of computational parameters that can be derived is the same for all Sk, and the
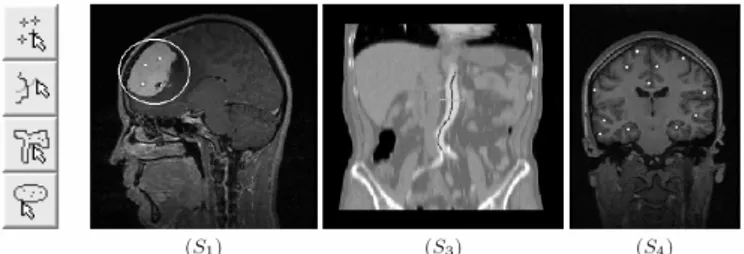
computational part must be aware of this fact. In the proposed ISS, the user selects one (or more) volume slices (along a certain slicing plane) and a SIT among the following ones (see Fig. 2):
- S1 Elementary shape (ellipse/rectangle) with markers: the
physician draws an elliptical (rectangular) shape which encompasses the structure of interest (SoI). Markers are then positioned to further specify the SoI.
- S2 Free-hand closed curve with markers: similar to S1, but it
is expected that the line corresponds to an accurate contouring of the SoI in the selected slice.
- S3 Line with crossing line: a first line is traced on the SoI
and a second one is traced to cross the first one while passing through nearby structures.
- S4 Multiple seeds: a freely chosen number of point markers
are placed on SoI.
SIT vocations are summarized as follows: S1 can be used for
objects of various dimensions that can be easily identified and approximately encompassed by an ellipse or a rectangle (e.g. lesions, tumours), S2 requires more accurate interaction which
is justified when object shape is more involved and/or the object is not so easily detectable (e.g. inner organs), S3 is
mainly indicated for thin structures on image slices (e.g. vessels, grey matter) or to indicate a representative portion of extended structures (e.g. white matter), S4 can be used when
desired objects have nearly uniform intensity values (e.g. bones, CSF) or to indicate several points belonging to an extended and complex structure (e.g. grey matter). From each
Sk interaction the corresponding data portion is collected and a local intensity histogram lH(i) is estimated. Direct lH(i) computation is possible with S2 and S3, while an estimation is
performed with S4 and S1 by using sampled intensity
information and main histogram moment selection (associated to local peaks) respectively. From lH(i), SoI maximum and minimum intensity (Imin, Imax) can be estimated. SoI markers
are directly acquired with S1,S2 and S4 while they can be
derived from the first traced line with S3. Another meaningful
information to be captured from the interaction can be expressed in terms of partitioning strength (PS) and is derived by a localized SoI analysis. The smoother the interesting structure boundaries the weaker (conservative) the
PS should be. PS are directly estimated when S2 and S3 are
selected, this is done with a signal intensity profile analysis across the boundaries of S2 or along the second crossing line
for S3. When using S1or S4 PS estimation is not so direct but it
can be performed as well using suitable heuristics or set to a default value and left to be tuned by the user.
Figure 2 Segmentation Interaction Tools
3 Computational Tools
As already stated, SIT and SCT should be coherent in sharing common segmentation abstractions. Accordingly, non trivial mathematical morphology tools has been designed and implemented in our ISS.
3D connected operators analysis preprocessing It is known
that a good denoising is beneficial because it reduces over-segmentation problems. However, denoising should not alter the information content and in particular the contour definition and other relevant image features. To this ends a 3D morphological filter-by-analysis family of operators, conceived as a volumetric extension of 2D connected operator filtering [5], has been realized [6]. With these operators a simplification of the original volume can be performed by discarding 3D connected components with respect to different distinguishing criterions (e.g. volume, surface, complexity, etc). 3D connected operators denoising is a suitable PA tool in our ISS in that it guarantees good denoising performance and works definitely better compared to similar 2D operators applied on single slices. In fact, while in 2D slices anatomic structures could be confused with noise in their peripheral or highly textured parts, in the 3D case even a thin and intricate structure will survive to the filter by analysis step because it is fully explored in its volumetric extension [5]. On the contrary, noise conserves its granular structure and can be effectively filtered out. In this work only volume based simplification (more suited for denoising purposes) has been considered, i.e. 3D connected components that do not reach a given minimum volume (e.g. 103 voxels) are removed.
Moreover our 3D connected operator filtering works on grey level connected flat components and preserve the continuity of the signal intensity. This makes this processing a good allied of the subsequent gradient-based water flooding analysis. 3D connected operator filtering is a quite computationally expensive task but it can be easily done off-line with respect to the interactive segmentation session.
Fast 3D water flooding (pseudo-watershed) segmentation
Volume segmentation is performed by a fast, interaction steered, and computationally optimized marker based 3D “water flooding” technique. This can be seen as a simplified version of a marker based watershed analysis and share the same water immersion interpretation of the geodesic version of the signal under analysis [7]. For segmentation purposes, a useful signal to work with is the volume gradient. We use the morphological gradient G(v) of the original MR volume
MR(v) (where v = (x, y, z) is the voxels’ coordinate set)
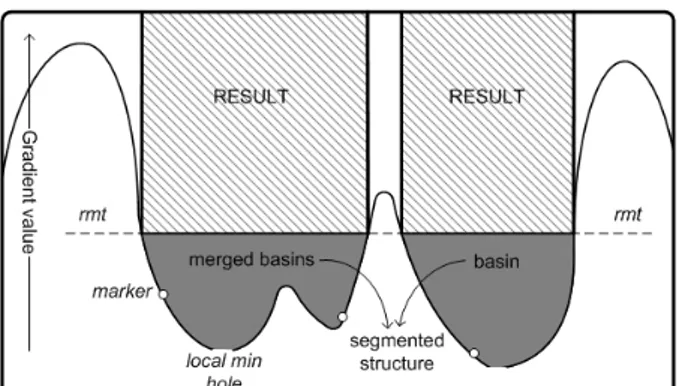
related neighbouring voxels according to a 6-connectivity kernel. Moreover we propose an original way to produce and exploit prior knowledge coming from the user interaction in order to improve the convergence towards the desired result and minimize the computational complexity. Parameters coming from the PEC modules are converted into SoI related bounding thresholds: (Imin, Imax) restricts voxels that are
considered, seed markers determine the catchments basins from which to start the merging, PS is converted in a region
merging threshold (rmt) which regulates the region merging
strength by determining a flooding limit on the gradient, i.e. a level under which different basins are merged. A pictorial view of how the bounded water flooding works is given in Fig. 3 for a one-dimensional case. The described 3D water flooding technique allows quick visual feedbacks (one to few seconds using a normal PC on a 2563 voxels volume). Finally,
note that a set of parameters derived from the interaction is associated to any segmentation result. This ensure a perfect reproducibility of results, i.e. the possibility to automatically repeat the segmentation without having to archive the segmentation results as additional volumetric data-sets.
Figure 3 Marker based water flooding by immersion
Refinement tools Basic RIT and RCT such as local cuts and
local erosions have been implemented. These can be used to exclude, from the segmented volume, regions that have been erroneously included due to pixel intensity contiguity. Also a local and global gradient ascending constrained dilation of the obtained structures can be performed to compensate for eventual border underestimation. RIT derived parameters constitute additional constrains for the bounded water flooding which can be repeated by comprising them.
Despite their simple nature, and thanks to the satisfactory “first shot” performance of the SCT phase, RIT and RCT usually let the user drive the segmented data-set to the desired result with a minimal effort. This was the case of all experimental results in this work. Of course our model could include e.g. more intelligent scissors in order to make the convergence to the desired result faster by shortening the interaction. Such tools are object of current investigations [8].
5 Results on brain quantification and atrophy
Our interest now focuses on a specific clinical application which consists in a quantitative analysis of brain atrophy in a small population of patients affected by a rare disease compared to a population of healthy subjects. A recent studyreported progressive neuro-degeneration in patients affected by primary immunodeficiency disease (PID) [9]. The aetiology of this syndrome is unknown. Neuroimaging findings are represented by brain atrophy with prominent sulci and enlarged ventricles. Since a reliable estimation of atrophy critically depends on the accuracy of the segmentation procedure, the applicability of the presented ISS for atrophy assessment depends on its volume quantification performance. For these reasons in order to evaluate if the proposed ISS is capable to detect brain atrophy, a preliminary system validation has been performed by comparing gray matter (GM), white matter (WM) and cerebrospinal fluid (CSF) parameters with available literature [10–12]. Thirteen patients affected by PID and 9 healthy controls selected from a population of volunteers were considered. Inclusion criteria for control group: (1) normal brain MRI as determined by an experienced neuroradiologist, (2) no history of severe head trauma requiring medical attention. Subjects were matched according to gender and age. A 3D structural MRI scan was acquired for each subject by using a T1-weighted MPRAGE sequence (1mm isotropic voxels). The proposed ISS has been used to segment WM, GM and CSF and to produce volume measurements (see Tab.1). Accurate interactive segmentation of each structure took from 2 (simpler cases) to 10 minutes (more complex cases and structures). A visual example of resulting GM and WM volumes is shown in Fig.4 (GM and WM extracted from the same subject). Our findings in compatible subject classes were compared with those obtained by Ge [10], Chard [11] and Blatter [12] in normal volunteers1 (see Tables 1 and 2). These studies reported normative brain volumetry in healthy segmented subjects. It should be noted that the three studies [10–12] used different techniques and tools: 3DVIEWNIX [13], SPM99 [14], Analyze [15] respectively. The cited segmentation tools are widely used as benchmark in medical computing literature.
Normal brain volume quantification Our findings
concerning WM, GM and CSF volumes in normal subjects are comparable with the available data in literature [10–12] and they are coherent in terms of age and gender differences. As it can be observed, average values are intermediate between other studies while standard deviation values obtained by the proposed method are definitely the lowest. These values obviously depends on the sample, however being our sample less populated with respect to the others we feel qualified to positively interpret the obtained results. Moreover, the analysis on healthy subjects demonstrated that there is a statistically significant difference in TIV between males (1.47 L) and females (1.30 L) (T test p < 0.001), and that both TIV and BPV in healthy females are statistically lower compared to healthy males (TIV 1.30L ± 0.02 vs 1.47L ± 0.02, p < 0.001; BPV 1.13 ± 0.04 vs 1.28 ± 0.04), confirming the anatomic evidence reported by Blatter et al. [12]. Confirmation of available results and a better standard deviation let us conclude that the proposed method is suitable for quantitative brain analysis.
Atrophy assessment for PID disease Accepting the fact that
the small sample size requires cautious interpretation, the proposed ISS detected both presence and degree of regional GM, WM, and CSF changes in patients with PID. We
detected a loss of brain parenchyma in patients affected by PID, which was expressed by a statistically significant reduction of fractional GM volumes (51.9±2.3 vs 55.2±2.3, p=0.008) paralleled by a significant increase in CSF volumes (CSF 0.24±0.09 vs 0.18±0.04 p=0.006), without changes in TIV, thus confirming the observations of Ziegner et al. in their pilot study [9].
5 Conclusions
A new ISS has been presented where user knowledge and a properly designed interaction language are effectively exploited to guide fast and accurate morphological analysis and segmentation tools. The computational pipeline is composed by 3D connected-operators preprocessing, fast 3D water-flooding segmentation and means to quickly refine the results. Accuracy of the proposed ISS has been evaluated in comparison with other technologies and a clinical validation has been performed based on a small population of healthy subjects and patients affected by a rare neurodegenerative disease. Obtained results confirmed technical and clinical expectations and are meaningful indices of good accuracy, repeatability, efficiency and generality properties. In particular, in all considered cases we obtained rapid convergence to the desired result (i.e. without or with only few refinement steps). This demonstrates the good match between the interaction and the computational parts of the system, and distinguishes our user-guided method from many others which also use fast (often localized) operators but require, especially on complex or noisy structures, many refinement loops (usage cycles) to obtain satisfactory results.
References
[1] Bankman, I., ed.: Part II: Segmentation. In: Handbook of Medical Imaging. Academic Press (2000) 67–211
[2] Yoo, T.S., ed.: Part II: Segm. In: Insight into Images. A K Peters (2004) 119–236
[3] Olabarriaga, S.D., Smeulders, A.W.M.: Interaction in the segmentation of medical images. Med Imag Anal 5 (2001) 127–142 [4] Suri, J., Setarehdan, K., Singh, S., eds.: Advanced Algorithmic Approaches to Medical Image Segmentation. Springer (2002) [5] Salembier, P., Serra, J.: Flat zones filtering, connected operators, and filters by reconstruction. IEEE Trans Imag Proc 4(8) (Aug. 1995) 1153–1160
[6] Signoroni, A., Leonardi, R.: Volume Simplification and Segmentation by 3D Connected Operators. In: EUSIPCO 2002, Toulouse, France. (2002) III:489-492,
[7] Vincent, L., Soille, P.: Watersheds in digital spaces: an efficient algorithm based on immersion simulations. IEEE Trans Patt Anal Mach Int 39(12) (1991) 176–201
[8] Signoroni, A., Leonardi, R.: Two-way interactive refinement of segmented medical volumes. In: ICIAP 2007, Italy, (2007) 697-702
[9] Ziegner, U.H., et al.: Progressive neurodegeneration in patients with primary immunodeficiency disease on IVIG treatment. Clin Immunol 102(1) (2002) 19–24
[10] Ge, Y., et al.: Age-related total gray matter and white matter changes in normal adult brain. Part I: volumetric MR imaging analysis. AJNR Am J Neuroradiol 23(8) (2002) 1327–33
[11] Chard, D., et al.: The reproducibility and sensitivity of brain tissue volume measurements derived from an SPM-based segmentation methodology. J Magn Reson. Im. 15(3) (2002) 259–67
[12] Blatter, D.D., et al.: Quantitative volumetric analysis of brain MR: normative database spanning 5 decades of life. AJNR Am J Neuroradiol 16(2) (1995) 241–51
[13] Udupa, J., Oduhner, D., Samaraskera, S.: 3DVIEWNIX: an open, transportable, multidimensional, multimodality, multi-parametric imaging software system. Proc. SPIE 2164 (1994) 58–73 [14] Ashburner, J., Friston, K.J.: Voxel-based morphometry the methods. Neuroimage 11 (2000) 805–21
[15] Robb, R.: A software system for interactive and quantitative analysis for biomedical images. In: 3D imaging in medicine. Springer-Verlag (1990) 333–361
Figure 4 WM and GM results (3D volume rendering of 4 different views for each segmented structure).
Table 1 Brain volumetry obtained from the proposed ISS
Table 2 Proposed ISS † vs 3D-Viewnix (top) SPM99 (mid) Analyze (bottom). Number of subjects belonging to the age-group in brackets.