Antiferromagnetic correlations in Fe–Cu granular alloys:
The role of the surface structure
Xavier Batllea)
Dept. Fı´sica Fonamental, Facultat de Fı´sica, Universitat de Barcelona, Diagonal 647, Barcelona 08028, Catalonia, Spain and National Center for Electron Microscopy, Lawrence Berkeley National
Laboratory, University of California, 1 Cyclotron Road, Berkeley, California 94720
Chuck J. Echer, E. Chris Nelson, and Kannan M. Krishnan
National Center for Electron Microscopy, Lawrence Berkeley National Laboratory, University of California, 1 Cyclotron Road, Berkeley, California 94720
Bart Jan Hattink
Dept. Fı´sica Fonamental, Facultat de Fı´sica, Universitat de Barcelona, Diagonal 647, Barcelona 08028, Catalonia, Spain
共Received 26 July 1999; accepted for publication 14 December 1999兲
Fe precipitates in a Cufcc matrix, prepared using the Bridgeman method and with an average composition of Cu97Fe3, displayed the coexistence of ferromagnetism共FM兲, spin glass-like 共SGL兲 behavior and antiferromagnetic 共AFM兲 correlations. The two former contributions may be attributed, respectively, to the segregation of FM, ␣-Febcc precipitates and to the few Fe spins distributed in the matrix. The annealing procedures increased the FM contribution and, as particle growth and phase segregation took place, the SGL behavior progressively disappeared. Results from high resolution transmission electron microscopy 共HRTEM兲, x-ray photoelectron spectroscopy 共XPS兲, and electron energy-loss spectroscopy 共EELS兲 suggest that the AFM correlations are due to the␣-Fe particles that show a surface layer of a few nanometers in thickness, of either FeO and/or ␥-Fefcc. XPS and EELS measurements confirm the presence of FeO; however, the latter is only tentatively suggested by the HRTEM analysis of the particle/matrix interfaces. © 2000 American Institute of Physics.关S0021-8979共00兲08106-8兴
I. INTRODUCTION
Heterogeneous granular alloys consisting of a distribu-tion of small ferromagnetic共FM兲 precipitates embedded in a nonmagnetic metallic 共NM兲 matrix have been extensively studied over the last few years because they exhibit giant magnetoresistance 共GMR兲.1,2 Typical granular alloys are Co–Ag, Co–Cu, Fe–Cu, CoFe–Ag, NiFe–Ag, and CoFe– Cu; and depending on the relative FM–NM miscibility, as deposited samples共prepared, for instance, by sputtering兲 are usually annealed at temperatures between 450 and 700 °C in order to promote the segregation and growth of the FM par-ticles. The maximum GMR effect observed at low tempera-tures is ⬃30%–40% and this is obtained at ⬃20–25 at. % FM concentration. Spin glass-like 共SGL兲 behavior has also been reported at low FM concentrations,1 and is related to the degree of FM–NM alloying. In general, FM–NM alloys are well known for showing this glassy behavior even at FM concentrations as low as about 0.01 at. %.3 Heterogeneous alloys are also of importance in understanding the basic properties of a distribution of small magnetic particles. These alloys allow us to study the two main features that determine the magnetic properties of fine particle systems, i.e., the crys-tallographic and chemical structure at particle surfaces and
the magnetic correlations. Moreover, GMR in granular alloys is essentially related to the spin-dependent scattering of con-duction electrons at the particle–matrix interfaces and this effect is monitored by the demagnetization mechanism oc-curring at the particle surface.4
In this article we discuss the structural and magnetic properties of Fe precipitates grown in a Cu matrix by anneal-ing a precursor alloy of composition Cu97Fe3 under various conditions. A low Fe content was chosen to obtain a distri-bution of isolated magnetic particles, so as to study the struc-ture of the particle surface and its contribution to the mag-netic properties. Moreover, this is an ideal system by which to evaluate the crystallographic relationships between the magnetic precipitates and the matrix, and the way in which these orientation relationships affect the magnetotransport 共GMR兲 properties of these alloys. This article is thus aimed at correlating the crystal structure with the magnetic proper-ties and at identifying the key structural factors responsible for the coexistence of ferromagnetism, antiferromagnetic 共AFM兲 correlations, and SGL behavior in these low ferro-magnet content Fe–Cu heterogeneous alloys. We note that although coherent␥-Fe precipitates in a Cu matrix are para-magnetic at room temperature and antiferropara-magnetic below ⬃70 K, it is not yet clear how interfacial strains and inter-diffusion affect the AFM correlations when thin ␥-Fe films are grown on Cu5and even how room temperature ferromag-netic ␥-Fe films may be obtained.6
a兲Author to whom correspondence should be addressed: Permanent address:
Dept. Fı´sica Fonamental, Facultat Fı´sica, Universitat Barcelona, Diagonal 647, Barcelona 08028, Catalonia 共Spain兲; Electronic mail: [email protected]
3037
II. EXPERIMENT
Cu–3 at. % Fe alloys were grown using the Bridgeman method and individual pieces were annealed under various conditions: samples A共650 °C, 18 min兲, B 共650 °C, 4 h兲, C 共650 °C, 24 h兲, and D 共700 °C, 70 h兲. X-ray diffraction 共XRD兲 patterns in the/2 geometry and transmission elec-tron microscopy 共TEM兲 in bright 共BF兲 and dark field 共DF兲 modes were used to determine the average crystal structure and particle size of the matrix and precipitates. The local and average compositions were evaluated by x-ray energy-dispersive spectrometry 共XEDS兲 using a 20 nm electron probe in a standard JEOL 200 CX microscope equipped with a scanning TEM共STEM兲 unit. X-ray maps of Cu, Fe, and O were also obtained from XEDS. Selected area electron dif-fraction共SAED兲 and microdiffraction experiments with a 20 nm electron probe were recorded to ascertain the local struc-ture and orientation relationships. High resolution TEM was performed using a Philips CM 200 FEG microscope. This microscope also incorporated an electron probe of⬃1–2 nm and was used to determine the local structure and orientation relationships at the nanometer scale. The particle/matrix in-terfaces were also studied. Energy filtered images were ob-tained by electron energy-loss spectrometry 共EELS兲 in a Philips CM 300 FEG microscope in order to map the Cu, Fe, and O distributions. X-ray photoelectron spectroscopy共XPS兲 using Al and Mg K␣sources made it possible to evaluate the content of both metallic Fe and Fe–O in the samples. Hys-teresis loops, with applied fields up to 12 kOe, were mea-sured at room temperature using a vibrating sample magne-tometer and ac susceptibility共ac magnetic field of 1 Oe兲. The latter was measured as a function of temperature 共4.2–275 K兲, frequency 共11–1111 Hz兲, and dc applied magnetic field. III. RESULTS AND DISCUSSION
XRD and TEM showed that␣-Febccparticles precipitate in the Cufcc matrix7 and grow as the annealing time in-creases. No other phases, such as ␥-Fefcc, Cu–O, or Fe–O, were detected. Average sizes were obtained from the peak broadening of the XRD spectra of the samples, in compari-son to a Cufccstandard, which was used to calibrate both the position and the instrumental width of the diffraction peaks. Crystallographic Cu domains ranged from a few tenths of a micron to a few microns; due to the small Fe concentration, their peak positions were not affected, within the experimen-tal error, by the annealing procedure. The average size of the ␣-Fe precipitates, obtained from the Fe(011)peak, was⬃27, ⬃39, and ⬃58 nm for samples B, C, and D, respectively 共Fig. 1兲. These values are in agreement with the particle sizes observed by DF TEM images, which ranged from 6 to 15 nm in sample A, 15 to 30 nm in sample B, 30 to 60 nm in sample C, and 40 to 70 nm in sample D. The integrated intensity of the Fe(011)peak increased with the annealing time共this effect was particularly noticeable when going from sample B to C兲, suggesting that Fe segregation also occurred. The XRD spec-tra may be fitted within the range 2⫽42°–46°, if we take into account the Cu(111)and Fe(011)peaks. Unfortunately, for this low Fe concentration, XRD cannot detect␥-Fe precipi-tates, especially if they are coherent with the Cu matrix.
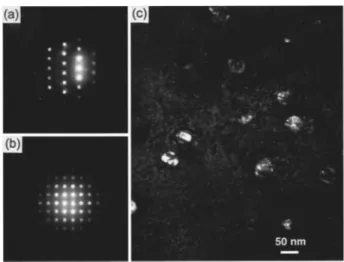
From the integrated intensities of these two peaks, the atomic ␣-Fe concentration was found to be about 4% for sample D. The isolated ␣-Fe precipitates are shown in the DF TEM micrographs关Fig. 2共c兲兴.
The local and average composition of the samples was determined by x-ray energy-dispersive spectrometry共XEDS兲 using a 20 nm electron probe. Both x-ray line profiles and maps共not shown兲 suggest that Fe-rich regions corresponded to the imaged particles, while the average composition ob-tained by scanning the electron probe in a 1⫻1 m was ⬃2.5 at.% Fe for sample B and ⬃5.5 at.% Fe for sample C. Although this difference can be attributed to the experimen-tal error in the measurement, it is in agreement with the increase in Fe segregation with the annealing time detected from XRD, and with both the hysteresis loops 共Fig. 8兲 and temperature dependence of the ac susceptibility共Figs. 6 and 7兲. The local composition was obtained using an ultrathin window detector; when the beam was focused on a thick area
FIG. 1. Detail of the XRD spectra for samples B, C, and D.
FIG. 2. Microdiffraction patterns for sample C, using a 20 nm electron probe:共a兲 关013兴 zone axis for the Cufccmatrix and共b兲 关001兴 zone axis for an
Febccprecipitate. The camera constant was calibrated from the Cu diffraction
pattern and used to index that of the Fe, always resulting in a bcc structure in the case of the latter.共a兲 and 共b兲 do not represent the orientation relation-ships between the precipitates and the matrix, since the diffraction patterns of the matrix and precipitate were obtained in different areas and orienta-tions共tilts兲 of the sample. 共c兲 DF TEM micrograph for sample C, showing isolated␣-Fe particles.
of the matrix, the expected Cu-dominant spectrum was ob-tained and no O contribution was detected 关Fig. 3共a兲兴. In contrast, when the beam was focused on a thin area of the matrix, the expected surface O contamination 共passivation layer兲 was clearly visible 关Fig. 3共b兲兴. Finally, when the beam was focused on top of an imaged precipitate关on an area very near to the previous spectrum and of very similar thickness since the counting rate was roughly the same—Fig. 3共c兲兴, even though the spectrum was dominated by the contribution from Fe, the O contribution was slightly higher 共⬃4% for sample D兲 than before, suggesting that some extra O might
be located in the Fe-rich precipitates, leading to both metallic Fe and an Fe–O-type compound in the precipitates. How-ever, the latter result should be taken as tentative since it might be related to a higher surface roughness around the Fe precipitates. We note that, based on the x-ray maps for Fe and O in very thin areas of the samples, oxygen was uni-formly distributed throughout the sample and it did not cor-relate with the Fe-rich precipitates.
Microdiffraction patterns were recorded with a 20 nm electron probe to ascertain the crystal structure of the Fe precipitates. The Cu matrix was oriented along a given zone axis, from which the camera constant c was determined by applying the expression r(h,k,l)•d(h,k,l)⫽c; where r(h,k,l) is the experimental distance from the transmitted beam to the diffraction spot and d(h,k,l) the ideal fcc Cu(h,k,l) interplanar spacing关Fig. 2共a兲兴. Applying this value of c, indexing of the microdiffraction patterns of the Fe par-ticles always led to a bcc structure关Fig. 2共b兲兴. The bcc struc-ture of the Fe precipitates and the particle/matrix orientation relationships were checked at the nanometer scale using a 2.4 nm electron probe. First, an Fe precipitate was imaged by HRTEM 共Fig. 4兲. Then, the sample was tilted until the microdiffraction pattern indicated that the 关111兴 zone axis for the Cufccmatrix surrounding the Fe precipitate had been reached 关Fig. 5共a兲兴. Finally, whenever the microdiffraction pattern was taken at the center of the Fe precipitate, the 关110兴 zone axis for Febccwas obtained 关Fig. 5共b兲兴, yielding the Kurdjumov–Sachs orientation relationships for fcc and bcc grains8—关111兴fcc Cu兩兩关110兴bcc Fe and (1– 10)fcc Cu兩兩(1 ⫺11)bcc Fe. As usual, the camera constant was calibrated from the Cu diffraction pattern and used to index the Fe pattern. However, a mismatch between the zone axes of the matrix and precipitate, which increased with the annealing temperature, was detected. The mismatch angles were ⬃0°, 1.5°, 3°, and 5.5°, for samples A, B, C, and D, respectively. This may be related to the particle distortion as a function of growth from quasispherical to ellipsoidal-like and observed in HRTEM images 共Fig. 4兲. Small quasispherical bcc par-ticles may be accommodated in a fcc matrix and although
FIG. 3. XEDS spectra for sample D, using a 20 nm electron probe and an ultrathin window detector:共a兲 thick area of the Cu matrix 共360 counts/s兲, 共b兲 thin area共near the hole in the sample兲 of the Cu matrix 共30 counts/s兲, 共c兲 Fe precipitate⬃40 nm in diameter 共30 counts/s兲 in an area close to 共b兲. The total number of counts was 100,000 in all cases. Some surface C contami-nation is present in共b兲 and 共c兲. 共c兲 confirms that the precipitates are Fe rich. Oxygen is mainly located at the sample surface关O peak is present in 共b兲 and
共c兲, but not in 共a兲兴. However, some extra oxygen might be located in the
Fe-rich precipitates. All spectra were performed after cleaning the sample surface by ion milling in LN2.
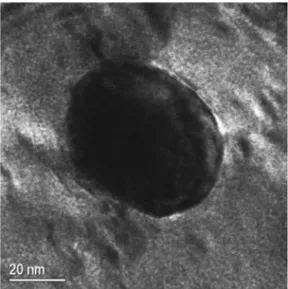
FIG. 4. HRTEM image for sample C, showing the ellipsoidal distortion of some of the␣-Fe particles.
this leads to a large local surface strain 共the cell parameters have to match at the particle/matrix interface兲, the overall surface energy is small. Larger particles cannot accommo-date the local strain at the surface, so they grow ellipsoidal-like, at the expense of an increase in the surface energy. This kind of deformation is common in Fe-Cu alloys.8
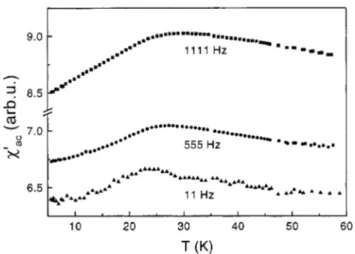
The ac susceptibility measurements with an ac field of 1 Oe and at six frequencies, ranging from 11 to 1.1⫻104 Hz, were carried out between 4.2 and 275 K. Both samples A and B clearly showed a characteristic SGL peak in the in-phase component, ac
⬘
, at low temperature 共Fig. 6兲. No relevant differences were observed in these two samples. The freez-ing temperature depends on the measured frequency and shifted from⬃23 K at 11 Hz to ⬃30 K at 1.1⫻103 Hz, for sample B共Fig. 7兲. This low-temperature peak is also depen-dent on the application of a dc field共parallel to the ac field兲 and it shifted from⬃27 (Hdc⫽ 0兲 to ⬃35 K when Hdc⫽500 Oe for sample B, with a measuring frequency of 111 Hz, as observed in other small particle systems.9Samples C and D did not display this peak; however, ac⬘
increased below about 20 K, suggesting that the SGL behavior, if present, would appear only below 4.2 K. This is in agreement withincreasing Fe segregation with annealing time, since the con-centration of isolated Fe spins diluted in the matrix, which are responsible for this freezing behavior, is drastically re-duced. A residual Fe dilution of ⬃0.3 at. % in sample D might lead to a freezing temperature of about 2 K,3which is in agreement with the expected solubility of Fe in Cu 共0.35 at. % Fe in Cu at 780 °C兲, obtained from the phase diagram.7 Finally, a clear increase inac
⬘
was observed above 80 K for all samples, and this increase was smoothed by the applica-tion of a dc field. These findings suggest the presence of short-range AFM correlations which are broken by a dc field, in agreement with the magnetization curves 共Fig. 8, see be-low兲, although this AFM contribution might be partially hid-den by the increase in the background signal coming from the FM phase共increasing with the dc applied field兲. This FM contribution should give a quasiconstantac⬘
since the initial susceptibility of a distribution of blocked FM particles does not depend on temperature at temperatures well below the mean blocking temperature 共flat zero-field cooling at low temperatures兲. These high-temperature AFM correlations were also observed in a Cu5 nm/Fe0.5 nmmultilayers 共300bi-FIG. 5. Microdiffraction patterns for sample D, using a 2.4 nm electron probe:共b兲 关110兴 zone axis at the center of an Febccprecipitate⬃50 nm in
diameter and 共a兲 关111兴 zone axis for the Cufccmatrix all around the Fe
precipitate.共a兲 and 共b兲 show the Kurdjumov–Sachs orientation relationships for fcc and bcc grains共Ref. 8兲. Patterns 共a兲 and 共b兲 are related through a tilting angle of about 5.5° and this slight mismatch is associated with the anisotropic growth of the particles.
FIG. 6. In-phase component of the ac susceptibility ac⬘: (䊉) sample B
measured at 111 Hz, 共䊏兲 sample B measured at 111 Hz and with a dc applied field of 500 Oe共parallel to the ac field兲, and 共䉱兲 sample D measured at 111 Hz.
FIG. 7. Detail of the in-phase component of the ac susceptibilityac⬘ at low
temperature for sample B at different frequencies.
FIG. 8. Detail of the hysteresis loop at room temperature for samples C and D. Inset. Decreasing branch of the hysteresis loop at room temperature for samples B, C, and D. All curves have been normalized to the volume frac-tion of␣-Fe precipitates obtained for sample D.
layers兲, which suggests that those samples may in fact com-prise Fe clusters precipitated in a Cu matrix.5 The low field susceptibility showed a blocking behavior at low temperature 共very small ␣-Fe precipitates兲, while␥-Fe was only detect-able by conversion electron Mo¨ssbauer spectroscopy.
Hysteresis loops measured at room temperature are plot-ted in Fig. 8. If we assume that the mean blocking tempera-ture
具
TB典
and the energy of anisotropy K•具
V典
,共K being theanisotropy constant, where K␣⫺Fe bulk⫽4.72⫻105 erg/cm3 at room temperature and具V 典 the mean particle volume兲, are related through the expression K•
具
V典
⫽25kB•具
TB典
,10 then most of the␣-Fe particles must be blocked well above room temperature for samples B, C, and D, and we should expect a pure FM hysteresis loop. However, it could be argued that the increase in ac⬘
observed above 80 K 共Fig. 6兲 might be related to the blocking of the smallest particles in samples A and B, rather than to short range AFM correlations. This is not possible for samples C and D, given the particle size distributions observed by TEM. Coercive fields range from 165 to 230 Oe for samples A and D, respectively, which are reasonable values for␣-Fe共Fig. 8兲. All the samples saturated at large fields 共Fig. 8, inset兲 and as the annealing time in-creased, saturation magnetization increased due to the de-crease in both the amount of Fe spins alloyed to the Cu matrix and the relative unimportance of disordered spins at the particle surface共decrease in the surface-to-volume ratio兲, as well as the particle growth 共negligible contribution from small particles that are not blocked at room temperature兲. However, for sample D共largest Fe segregation, largest␣-Fe content兲, we obtained an experimental saturation magnetiza-tion Msexp⫽511 emu/cm3共Fe兲, which is much smaller than the expected bulk value Ms⫽1717 emu/cm3. This means thatonly about 30%共in volume兲 of the Fe content contributed to the saturation magnetization.
Let us assume that we have an inner FM particle core (␣-Fe兲 and an outer shell not contributing to the magnetiza-tion. Then, Msand Ms
exp
are related through the expression Msexp⫽Ms•(1⫺d•
具
S典
/具
V典
), where d is the thickness of thesur-face layer noncontributing to the saturation magnetization and 具S典 the mean particle surface. This expression yields d ⫽ 6 nm for sample D. The surface layer might have either a different crystal structure from that of the particle core, e.g., ␥-Fe 共Ne´el temperature ⬃70 K3,6兲, or a different chemical composition, e.g., FeO 共Ne´el temperature ⬃186 K and ex-trapolated Curie–Weiss temperature⬃570 K兲, and these two possibilities might lead to the short-range AFM correlations observed at room temperature. The former might be caused by the matrix-particle interdiffusion and surface strains, yielding a progressive transformation from a bcc to a fcc structure of the Fe atoms at the particle surface. As d⬃10% of the mean particle size, XRD cannot solve the problem of detecting the ␥-Fe contribution, particularly if these small precipitates are coherent with the Cu matrix. Hence, all hys-teresis loops 共Fig. 8 and inset兲 have been normalized to the volume fraction of␣-Fe precipitates obtained for sample D. It is also worth noting that the hysteresis loops共Fig. 8兲 sug-gest a superimposition of an inner FM-like loop 共showing hysteresis兲 and an outer loop, which shows no hysteresis and a marked decrease in the slope 共quasilinear M versus H
curve兲. The latter contribution might be attributed to the short-range AFM correlations observed in the ac susceptibil-ity, which are broken by the applied field as we approach saturation. This might be the reason why the knee of the loops 共saturation field of about 1500 Oe兲 is reached at fields much higher than the field at which hysteresis disappears 共which is of the order of the anisotropy field of␣-Fe, i.e., a few hundred Oe兲 and the remanence-to-saturation ratio is much smaller than the value expected for a cubic system. In addition, some ␣-Fe precipitates may be multidomain mag-netic particles as the critical size for Fe goes from 15 nm for spherical particles to about 60 nm for ellipsoidal particles with an aspect ratio 10:1.11 This FM–AFM coexistence has also been found in many other granular alloys.12 Moreover, if the surface layer were the cause of the AFM correlations, we note that a two-dimensional Heisenberg system with AFM interactions does not show long-range order and the susceptibility displays a very broad maximum with tempera-ture. Finally, a surface spin-disordered structure might also contribute to the outer loop. That disorder might arise from either a reduced number of Fe neighbors for surface spins 共leading to a frustrated magnetic structure or to superpara-magnetism兲, charge transfer or particle/matrix interdiffusion, among others.
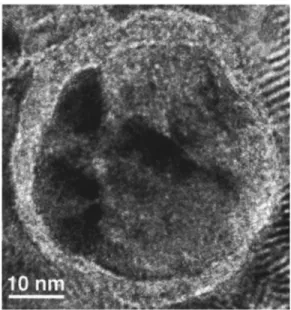
Preliminary HRTEM images of the particle/matrix inter-face suggest that some particles had a surinter-face layer of a few nanometers共Fig. 9兲 with neither the structure of the particle core nor the matrix. The lattice images from the surface layer, calibrated using the fringes from the Cu[110] matrix, might be attributed to ␥-Fe. Also, the presence in the samples of an Fe–O-type compound was studied by XPS and EELS. XPS spectra were taken by using a Mg K␣ source, after cleaning the surface by ion milling. The spectrum for sample D 关Fig. 10共a兲兴 shows the 2p1/2 and 2 p3/2 lines for metallic Cu, the Auger lines for Cu and the 1s line (⬃284 eV兲 for C. The latter suggests some residual surface contami-nation after cleaning. Neither Cu–O nor O lines were
ob-FIG. 9. HRTEM image for an␣-Fe precipitate in sample D, suggesting the existence of a surface layer of a few nanometer in thickness with a structure different from the particle core.
served. A detail of the spectrum in the binding energy range 925–970 eV clearly shows the 2 p1/2and 2 p3/2lines for me-tallic Cu, with binding energies of ⬃953 and ⬃933 eV, re-spectively关Fig. 10共b兲兴. A detail of the spectrum in the range 690–740 eV is shown in Fig. 10共c兲. The main lines in this spectrum, at⬃699 eV and ⬃719 eV, do not correspond to Fe but to Cu, and this arises from a cross-talking effect between the Mg and Al K␣sources; although we are using the Mg K ␣ source, the Al one sits beside it, such that the excitation of the Mg anode leads to a residual excitation of that of Al. The
spectrum for a pure metallic Cu standard 关Fig. 10共d兲兴 using the Mg K␣ source reinforces this experimental artifact—the spectrum for Cu appears not only at the expected energy of ⬃933 (2p1/2) and⬃953 eV (2p3/2) 共not shown兲, but also at ⬃699 and ⬃719 eV, respectively. The difference between these two sets of values (⬃234 eV兲 corresponds to the dif-ference between the in-coming energies of the K␣radiation of the Al and Mg sources. Fortunately, the Fe contribution to the spectrum in Fig. 10共c兲 is clearly shown within the range 705–715 eV. However, it is evident that the expected line at ⬃707 eV (2p3/2) broadens to higher energies, suggesting that not only metallic Fe but a compound of iron and oxygen is present. The best fit of the spectrum is shown in Fig. 10共e兲, with the contribution of FeO (2 p3/2at⬃709 eV兲, leading to an average composition of 98.1 at. % metallic Cu, 1.2 at. % metallic Fe, and 0.7 at. % FeO, for sample D. Finally, the energy filtered maps for Cu, Fe, and O obtained by EELS 共Fig. 11兲 reinforce the suggestion that there is an extra amount of O in the surface layer around the metallic ␣-Fe particles, probably associated with the FeO detected by XPS. In summary, if we assume the ratio of metallic Fe to FeO obtained by XPS to be correct, 63% of the Fe content in the precipitates is metallic and 37% is oxide. However, accord-ing to the hysteresis measurements, only about 30% of the total Fe content contributes to the net magnetization (␣-Fe兲. The expected solubility of Fe in Cu is about 0.35 at. % for sample D 共which results in about 12% in the average com-position Cu97Fe3), as the phase diagram and the ac suscep-tibility both suggest. We may thus estimate that the ␥-Fe phase in sample D is about 21% of the Fe content, that is, 0.6 at. %. Consequently, this is why XRD, TEM, and the other
FIG. 10. XPS data for sample D after cleaning the sample surface by ion milling:共a兲 spectrum in the binding energy range 200–1000 eV, using a Mg
K␣source,共b兲 detail of 共a兲 in the range 925–970 eV, showing the 2p1/2and
2 p3/2contributions from metallic Cu,共c兲 detail of 共a兲 in the range 695–740
eV, showing the contributions from metallic Cu共cross-talking effect due to the indirect excitation of the Al K␣ source which is placed near that of Mg K␣), metallic Fe and an Fe–O-type compound,共d兲 detail of the spec-trum in the same binding energy range as 共c兲 for a metallic Cu standard using a Mg K␣source and showing the cross-talking effect with the Al K␣ source, and共e兲 best fitting of the 2p3/2peaks in共c兲, leading to an average
composition 98.1 at. % metallic Cu–1.2 at. % metallic Fe–0.7 at. % FeO.
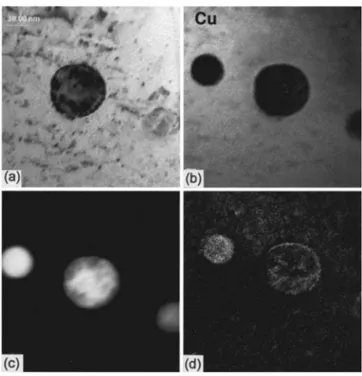
FIG. 11. Energy filtered maps obtained from EELS, for sample D: 共a兲 HRTEM image,共b兲 Cu mapping, 共c兲 Fe mapping, and 共d兲 O mapping. All spectra were performed after cleaning the sample surface by ion milling in LN2.
experimental techniques used in this study cannot clearly ascertain the␥-Fe precipitates, particularly, if these precipi-tates are coherent with the Cu matrix.
ACKNOWLEDGMENTS
X.B. wants to thank the Catalonian government for a grant to visit the Lawrence Berkeley Laboratory共LBL兲 from July 1997 to February 1998 and in January and November 1999, within the framework of the ‘‘Gaspar de Portola`’’ Catalonian Studies Program 共Catalonia-California兲 and the ACI98-14 Joint Action. K.M.K. was also partially supported by this grant during his visit to the University of Barcelona 共UB兲 in June 1998. It is a pleasure to acknowledge J. Bassas 共UB兲 for XRD and Dr. P. Gorostiza 共UB兲 and Dr. L. Calvo 共UB兲 for the XPS measurements. X.B. is indebted to Dr. J. Turner共LBL兲 for image processing and Professor A. Labarta 共UB兲 for many fruitful discussions. Financial support of the Spanish CICYT through the MAT97-0404 project is grate-fully recognized. Work at LBNL was supported by the Di-rector, Office of Energy Research, Office of Basic Energy Sciences, Materials Sciences Division of the U.S. Department of Energy under Contract No. DE-AC03-76SF00098.
1A. Berkowitz, J. R. Mitchell, M. J. Carey, A. P. Young, S. Zhang, F. E.
Spada, F. T. Parker, H. Hutten, and G. Thomas, Phys. Rev. Lett. 68, 3745
共1992兲.
2J. Q. Xiao, J. S. Jiang, and C. L. Chien, Phys. Rev. Lett. 68, 3749共1992兲. 3
See, for example, Magnetic Properties of Metals. d-Elements, Alloys and
Compounds, in Data in Science and Technology, edited by H. P. J. Wijn
and R. Poerschke共Springer, Berlin, 1991兲.
4See, for example, F. Badia, X. Batlle, A. Labarta, M. L. Watson, A. B.
Johnston, and J. N. Chapman, J. Appl. Phys. 82, 677共1997兲.
5See, for example, F. Badia, G. Fratucello, B. Martinez, D. Fiorani, A.
Labarta, and J. Tejada, J. Magn. Magn. Mater. 93, 425共1991兲, and refer-ences therein.
6For extensive data see, Landolt-Boernstein, volume III/19, subvolumes a
and b共unpublished兲.
7O. Kubaschewski et al., Z. Metallkd. 68, 495共1977兲; G. Salje et al., Z.
Metallkd. 69, 197共1978兲.
8See, for example, T. Fujii, Y. Watanabe, T. Enami, A. Sato, and M. Sato,
The Iron and Steel Institute of Japan共ISIJ兲 International 32, 1027 共1992兲; T. Fujii, T. Mori, and M. Kato, Acta Metall. Mater. 40, 3413共1992兲.
9J. L. Dormann, D. Fiorani, and E. Tronc, Adv. Chem. Phys. XCVIII, 283
共1997兲.
10J. I. Guittleman, B. Abeles, and S. Bonzowski, Phys. Rev. B 9, 3891
共1974兲.
11
The Physical Principles of Magnetism, edited by A. H. Morrish共Wiley,
New York, 1965兲.
12
See for example, X. Batlle, V. Franco, A. Labarta, M. L. Watson, and K. O’Grady, Appl. Phys. Lett. 70, 132共1997兲.