Membrane Traf
fic in Pollen Tubes
1[OPEN]
Gleb Grebnev,aMislav Cvitkovic,b,c,2 Carolin Fritz,aGiampiero Cai,d Ana-Suncana Smith ,b,c and Benedikt Kosta,3,4
aCell Biology, Department of Biology, Friedrich-Alexander-University Erlangen Nuremberg, 91058 Erlangen, Germany
bPULS Group, Department of Physics, Friedrich-Alexander-University Erlangen Nuremberg, 91058 Erlangen, Germany
cGroup for Computational Life Sciences, Division of Physical Chemistry, RuCer Boˇskovi´c Institute, 10000 Zagreb, Croatia
dDepartment of Life Sciences, University of Siena, 53100 Siena, Italy
ORCID IDs: 0000-0001-9377-9153 (G.G.); 0000-0001-6148-8263 (M.C.); 0000-0001-7514-5747 (C.F.); 0000-0002-4511-3557 (G.C.); 0000-0002-0835-0086 (A.-S.S.); 0000-0003-2249-2555 (B.K.)
Pollen tube tip growth depends on balancing secretion of cell wall material with endocytic recycling of excess material incorporated into the plasma membrane (PM). The classical model of tip growth, which predicts bulk secretion, occurs apically, and is compensated by subapical endocytosis, has been challenged in recent years. Many signaling proteins and lipids with important functions in the regulation of membrane traffic underlying tip growth associate with distinct regions of the pollen tube PM, and understanding the mechanisms responsible for the targeting of these regulatory factors to specific PM domains requires quantitative information concerning the sites of bulk secretion and endocytosis. Here, we quantitatively characterized the spatial organization of membrane traffic during tip growth by analyzing steady-state distributions and dynamics of FM4-64-labeled lipids and YFP-tagged transmembrane (TM) proteins in tobacco (Nicotiana tabacum) pollen tubes growing normally or treated with Brefeldin A to block secretion. We established that (1) secretion delivers TM proteins and recycled membrane lipids to the same apical PM domain, and (2) FM4-64-labeled lipids, but not the analyzed TM proteins, undergo endocytic recycling within a clearly defined subapical region. We mathematically modeled the steady-state PM distributions of all analyzed markers to better understand differences between them and to support the experimental data. Finally, we mapped subapical F-actin fringe and trans-Golgi network positioning relative to sites of bulk secretion and endocytosis to further characterize functions of these structures in apical membrane traffic. Our results support and further define the classical model of apical membrane traffic at the tip of elongating pollen tubes.
Pollen tube tip growth is essential for plant repro-duction and is widely employed as a model to investi-gate directional cell expansion in plants, which plays a central role in single-cell as well as organ morphogen-esis. Pollen tubes expand very rapidly at rates of several micrometer per minute strictly in one direction based on massive local secretion of cell wall material at the tip (Hepler et al., 2001; Kost, 2008; Yalovsky et al., 2008). The pollen tube cytoplasm displays extreme polariza-tion: poorly characterized cellular and molecular mechanisms are responsible for the massive accumu-lation of vesicles containing cell wall material within an inverted cone-shaped apical region (apical region of vesicle accumulation [ARVA]), behind which all other cell organelles are located (Lancelle and Hepler, 1992; Derksen et al., 1995; Hepler et al., 2001; Cheung and Wu, 2007). These organelles include a detached trans-Golgi network (TGN) compartment, which, depending on interactions with a subapical cortical F-actin fringe, is stably positioned directly behind the ARVA and may generate the secretory vesicles observed within this region (Stephan et al., 2014). The F-actin fringe is
essential for tip growth (Bou Daher and Geitmann, 2011; Dong et al., 2012; Rounds et al., 2014; Stephan et al., 2014), possibly because of additional direct functions in the transport of secretory vesicles (Cárdenas et al., 2008; Bou Daher and Geitmann, 2011; Dong et al., 2012; Rounds et al., 2014) or in local endocytic membrane in-ternalization (Samaj et al., 2006; Galletta and Cooper, 2009; Moscatelli et al., 2012; Meunier and Gutiérrez, 2016; Li et al., 2018). Most other cytoplasmic organelles are rapidly transported along longitudinally oriented F-actin cables back and forth between the two ends of elongating pollen tubes (“cytoplasmic streaming”; Hepler et al., 2001; Cheung and Wu, 2007; Cai et al., 2015).
Cell wall biogenesis at the tip of growing pollen tubes requires secretion at an eight to 10 times higher rate than required for plasma membrane (PM) extension (Picton and Steer, 1983; Derksen et al., 1995; Bove et al., 2008; Ketelaar et al., 2008). Assuming that secretory vesicles completely fuse with the PM rather than de-livering their cargo based on temporary“kiss-and-run” fusion, this implies that secretion results in massive
incorporation of excess material into the PM, which needs to be endocytically recycled.“Kiss-and-run” fu-sion was proposed to occur in neuronal synapses de-cades ago but has remained controversial, as this process is difficult to experimentally investigate and unequivocally demonstrate (He and Wu, 2007; Alabi and Tsien, 2013). In fact, no experimental evidence for “kiss-and-run” fusion in growing pollen tubes has been reported to date. By contrast, data obtained based on evanescent wave (total internal reflection fluorescence) microscopy strongly support complete fusion of FM4-64 labeled secretory vesicles with the PM of Picea meyeri pollen tubes (Wang et al., 2006).
The classical model of pollen tube tip growth (Steer, 1989; Derksen et al., 1995; Kost, 2008) is supported by compelling albeit largely circumstantial evidence and has been challenged in recent years (Grebnev et al., 2017). It predicts that massive secretion required for cell wall biogenesis occurs apically and is compensated by subapical endocytic recycling of excess PM material. In addition to delivering material needed for cell wall construction, massive apical secretion is also proposed to be essential for the coordination of signaling pro-cesses regulating tip growth (Luo et al., 2017; Li et al., 2018). As the pollen tube cell wall exclusively expands within the apical dome, it needs to display plasticity within this region paired with sufficient stiffness to prevent cell bursting caused by turgor pressure that drives cell elongation (Bosch et al., 2005; Bosch and Hepler, 2005; Zerzour et al., 2009). Specifically, at the apex, the pollen tube cell wall is primarily composed of methyl-esterified pectins (Bosch et al., 2005), which are synthesized in the Golgi and delivered to the cell
surface by secretion (Hepler et al., 2013; Mollet et al., 2013). Extracellular pectin methylesterases (PMEs) as well as inhibitors of these enzymes (PMEIs) are also secreted into the cell wall (Hepler et al., 2013; Mollet et al., 2013). Specific PMEI accumulation at the apex (Röckel et al., 2008) appears to contribute to the re-striction of PME-mediated pectin de-esterification, which enhances cell wall stiffness, to lateral regions of the cell wall (Hepler et al., 2013; Mollet et al., 2013).
Fluorescence recovery after photobleaching (FRAP) analysis established that after photobleaching, fluores-cence emitted by a secreted PME-GFP fusion protein first recovers within the pollen tube cell wall at the ex-treme apex before it spreads to more lateral regions (Wang et al., 2013). This observation is supported by in vivo analyses of the delivery offluorescent proteins fused to the receptor-like kinase POLLEN RECEPTOR-LIKE KINASE1 (AtPRK1), a transmembrane (TM) protein with an extracellular ligand binding domain, through the secretory endomembrane system to the PM at the pollen tube tip (Lee et al., 2008; Luo et al., 2016). After photobleaching or photoactivation, PM-associated fluorescence emitted by AtPRK1 fusion proteins also first appears at the extreme apex, indi-cating that not only the delivery of extracellular pro-teins to the cell wall but also the transport of TM proteins to the PM may be mediated by apical secretion. However, PMEs and AtPRK1 both contain extracellular domains that may interact with cell wall components specifically at the apex. Therefore, these proteins may be subapically secreted and subsequently recruited to the pollen tube apex by specific interactions with cell wall components (McKenna et al., 2009).
Coated pits, sites of clathrin-mediated endocytosis, are enriched within the subapical PM offixed or living pollen tubes, as demonstrated by numerous studies based on transmission electron microscopy (TEM; Derksen et al., 1995), immunofluorescence, and fluo-rescent protein tagging (Blackbourn and Jackson, 1996; Zhao et al., 2010; Feng et al., 2016; Sekereˇs et al., 2017; Li et al., 2018; Muro et al., 2018; Kaneda et al., 2019). Consistent with these observations, endocytosed ex-ternally appliedfluorescent lipid dyes (FM4-64; Parton et al., 2001) or positively charged nanogold parti-cles (Moscatelli et al., 2007) werefirst detected within cytoplasmic vesicles specifically beneath the subapi-cal PM using fluorescence microscopy or TEM, re-spectively. At a later stage, both markers are not only observed within endocytic compartments (late endo-somes, vacuoles), but also within Golgi stacks and/or apical vesicles. These observations suggest that bulk endocytosis occurs subapically, and that material in-ternalized through this process is partially recycled to the secretory endomembrane system. However, mas-sive endocytosis may also occur at the pollen tube apex based on (1) TEM analysis of the endocytic uptake of nanoparticles carrying a negative rather than a positive (see above) charge (Moscatelli et al., 2007), (2) time-lapse fluorescence imaging of FM4-64 internalization into pollen tubes preloaded with FM1-43 (Zonia and
1This work was supported by the German Research Foundation
within the framework of the Research Training Group 1962 (pro-jects nos. RTG 1962 7 to G.G. and B.K. and RGT 1962 10 to M.C. and A.-S.S.), the European Research Council StG MembranesAct (grant no. 2013–33728 to M.C. and A.-S.S.), and German Research Foundation Major Equipment Grants (grant nos. INST90/1074– 1FUGG [for SP8 DIVE-FALCON microscope] and INST90/1025– 1FUGG [for plant growth chamber facility for tobacco] to B.K.).
2
Present address: Department of Physics, University of Split, 21000 Split, Croatia
3
Author for contact: [email protected].
4
Senior author.
The author responsible for distribution of materials integral to the findings presented in this article in accordance with the policy de-scribed in the Instructions for Authors (www.plantphysiol.org) is: Benedikt Kost ([email protected]).
G.G. acquired most of the experimental data and contributed to the design of the experiments, to the analysis and interpretation of ex-perimental data, as well as to the writing of the manuscript; C.F. contributed all long-term time lapse imaging data; M.C. and A.-S.S. developed, analyzed, and interpreted the mathematical model and contributed to the writing of the manuscript; G.C. participated in the characterization of F-actin and TGN functions in membrane traffic; B.K. conceived and administered the study, was responsible for data analysis/interpretation, and wrote thefinal version of the manuscript.
[OPEN]Articles can be viewed without a subscription.
www.plantphysiol.org/cgi/doi/10.1104/pp.20.00380
Munnik, 2008), and (3) the investigation of mobility patterns of cytoplasmic components within the apical ARVA using differential interference contrast light microscopy or FRAP analysis after FM1-43 staining (Bove et al., 2008).
Many signaling proteins and lipids with important functions in the control of membrane traffic during tip growth are specifically associated with strikingly dis-tinct apical or lateral PM domains not only in pollen tubes, but also in other tip-growing plant cells. These proteins and lipids include (1) RHO-OF-PLANTS (ROP) GTPases (Lin et al., 1996; Sun et al., 2015), (2) upstream regulators of ROP activity (ROP-GAPs [GTPase-activating proteins; Klahre and Kost, 2006] and ROP-GEFs [guanine nucleotide exchange factors; Gu et al., 2006; Le Bail et al., 2019]), (3) different sig-naling lipids (phosphatidylinositide 4,5-bisphosphate [Kost et al., 1999], diacyl glycerol [Helling et al., 2006], and phosphatidic acid [Potocký et al., 2014]), as well as (4) lipid modifying enzymes (phospholipase C [Dowd et al., 2006; Helling et al., 2006] and PIP5Ks [phospha-tidylinositide 4-phosphate 5-kinases; Sousa et al., 2008; Stenzel et al., 2012]). The targeting of these signaling proteins and lipids to specific PM domains in tip-growing cells appears to be essential for the regula-tion of local secreregula-tion and endocytosis but clearly also depends on these membrane transport pro-cesses. A thorough understanding of the mecha-nisms, which target these factors to distinct PM domains and therefore play an essential role in the control of tip growth, clearly requires quantitative characterization of the spatial organization of apical membrane traffic.
A key aim of the study presented here was to quan-titatively determine sites of bulk secretion and endo-cytic membrane recycling required for apical cell wall biogenesis at the tip of growing tobacco (Nicotiana tabacum) pollen tubes. To this end, the lipid dye FM4-64 as well as different enhanced yellowfluorescent protein (eYFP)-tagged TM proteins, including proteins unlikely to interact with the cell wall, were employed as in vivo markers. Using fluorescence microscopy, steady-state distributions and dynamic behavior of these markers were characterized in normally growing and/or in Brefeldin A (BFA)-treated tobacco pollen tubes. In ad-dition, to achieve a better understanding of remarkable differences in the observed steady-state distribution patterns of some of the analyzed markers, these pat-terns were mathematically modeled based on experi-mental data obtained. Finally, using eYFP-based markers, subapical F-actin fringe and TGN position-ing was quantitatively mapped to further character-ize functions of these structures in apical vesicle accumulation and membrane traffic. Together, ex-perimental and theoretical data generated (1) quan-titatively define sites of bulk secretion and endocytosis within apical and subapical PM regions at the tip of tobacco pollen tubes, respectively; (2) establish the ex-act subapical positions of the cortical F-ex-actin fringe and of a detached TGN compartment relative to these sites;
(3) demonstrate that within the identified subapical region of bulk endocytosis, constitutive recycling of membrane lipids occurs, which generally excludes TM proteins and appears to depend on the subapi-cal TGN compartment but not on the F-actin fringe; and (4) suggest particularly slow diffusion of TM proteins and lipids with the apical region of bulk secretion, a finding that warrants further investigation.
RESULTS
Different TM Proteins Serving as In Vivo Markers for Membrane Traffic Display Distinct Steady-State Distribution Patterns in Tobacco Pollen Tubes
Three different TM proteins, which are transported through the secretory endomembrane system to the PM (endoplasmic reticulum [ER]. Golgi . TGN . secre-tory vesicles), were fused to an eYFP and used as markers to investigate membrane traffic at the tip of tobacco pollen tubes. To enable the discovery of general principles underlying this process in addition to marker-specific targeting mechanisms, the following TM proteins with highly diverse characteristics were selected: NtINT4, AtRCI2a, and AtPRK1. INOSITOL TRANSPORTER4 (NtINT4) is an endogenous tobacco pollen tube inositol transporter closely related to AtINT4 (Schneider et al., 2006), is composed of 582 amino acids and contains 12 TM domains (Fig. 1A). By contrast, RARE COLD-INDUCIBLE PROTEIN2A (AtRCI2a) is a small 54-amino acid Arabidopsis (Ara-bidopsis thaliana) protein containing only two TM do-mains that are connected via a very short (6 amino acid) linker and are positioned between even shorter N- and C-terminal extensions (5 and 2 amino acids, respec-tively; Fig. 1A). Although AtRCI2a functions are poorly understood to date (Capel et al., 1997; Medina et al., 2001), this protein is commonly used as a noninvasive PM marker in plants (Cutler et al., 2000; Serna, 2005; Thompson and Wolniak, 2008). Finally, AtPRK1 is a 662 amino acid Arabidopsis pollen tube receptor-like ki-nase (RLK) that contains a single central TM domain, which separates an N-terminal extracellular Leu-rich repeat (LRR) ligand-binding domain from an intracel-lular protein kinase domain (Fig. 1A). The closely re-lated RLK AtPRK2 (96% sequence identity at the amino acid level) plays an important role in the control of ROP signaling in pollen tubes (Zhang and McCormick, 2007; Chang et al., 2013; Zhao et al., 2013; Miyawaki and Yang, 2014). Fluorescent AtPRK1 fusion proteins have previously been employed to investigate apical mem-brane dynamics in tobacco (Lee et al., 2008) and Ara-bidopsis (Luo et al., 2016) pollen tubes. To generate fluorescent markers for membrane traffic, eYFP was attached to a predicted cytoplasmic terminus of each of the three selected proteins (NtINT4 and AtPRK1, C terminus; AtRCI2a, N terminus; Thompson and Wolniak, 2008), of which only AtPRK1 contains an N-terminal ER-import signal peptide (SP; Fig. 1A).
Steady-state distribution patterns of NtINT4::eYFP, eYFP::AtRCI2a, and AtPRK1::eYFP transiently or sta-bly expressed under the control of the LAT52 promoter (Twell et al., 1990) in cultured tobacco pollen tubes were imaged using confocal microscopy (Fig. 1B). Only im-ages of normally growing pollen tubes that after con-focal imaging continued to elongate at a rate of at least 3mm min21(Supplemental Fig. S1A; Klahre and Kost, 2006; Sun et al., 2015; Montes-Rodriguez and Kost, 2017) are shown (Fig. 1B, left) and were statistically analyzed to generate line plots displaying average in-tensities of PM-associated eYFPfluorescence at differ-ent meridional distances (measured along the curved pollen tube PM) from the apex (Fig. 1B, right).
As expected, all three TM protein markers primar-ily labeled the PM as well as the inverted cone-shaped cytoplasmic ARVA (Lancelle and Hepler, 1992; Derksen et al., 1995; Bove et al., 2008). However, interestingly, the three markers displayed clearly dis-tinct distribution patterns within the PM (Fig. 1B, right), as well as equally clear differences in the relative in-tensity of PM versus apical vesicle labeling (Fig. 1B, left). Whereas NtINT4::eYFP labeled all regions of the PM as well as apical vesicles essentially evenly, eYF-P::AtRCI2a accumulated to highest levels in a lateral PM domain (Stephan et al., 2014), and AtPRK1::eYFP was strongly enriched in the PM within the apical dome as previously described (Lee et al., 2008). Interestingly, Figure 1. Distribution patterns of TM proteins and
FM4-64 serving as markers for membrane traffic in normally growing tobacco pollen tubes. A, Do-main structure of the indicated TM protein markers. Protein and domain sizes are drawn to scale. PKD, Protein kinase domain. B, Left, medial confocal optical sections through representative pollen tubes transiently (NtINT4::eYFP, AtPR-K1::eYFP or AtPRK1DSP-LRR::eYFP) or stably (eYFP::AtRCI2a) expressing the indicated TM protein marker. Growth rates of the individual pollen tubes shown (after confocal imaging): 6.8 mm min21(NtINT4::eYFP), 3.6mm min21
(eYF-P::AtRCI2a), 3.8mm min21(AtPRK1::eYFP), or 4.8 mm min21 (AtPRK1DSP-LRR::eYFP). Right, line
plots displaying the intensity of PM-associated eYFP fluorescence at different meridional dis-tances from the apex (x 5 0 mm) in analyzed pollen tubes (n5 17 [NtINT4::eYFP, three inde-pendent experiments], 29 [eYFP::AtRCI2a, five independent experiments], 31 [AtPRK1::eYFP, five independent experiments], or 37 [AtPRK1DSP-LRR::eYFP, five independent experiments]). C, Left, medial confocal optical sections through different representative pollen tubes labeled with the fluorescent lipophilic dye FM4-64 (applied at 50mM in 200mL PTNT) for the indicated time period (initial stage, 0–5 min; redistribution stage, 6–40 min; steady-state stage, 41–60 min). Growth rates of the individual pollen tubes shown (after confocal imaging): 3.4mm min21(0–5 min), 4.8
mm min21(6–40 min), or 3.8mm min21(41–60
min). Right, line plots displaying the intensity of PM-associated FM4-64 fluorescence at different meridional distances from the apex (x5 0 mm) in all analyzed pollen tubes (n5 6 [0–5 min], 68 [6–40 min], or 41 [41–60 min]; four independent experiments). Light blue lines, Average intensity; dark blue lines,SD; all other lines, individual line
plots. Scale bar5 10 mm.
the apical PM domain most strongly labeled by AtPR-K1::eYFP extended to a subapical region spanning a meridional distance of about 3 to 5mm from the extreme apex (x5 0 mm), within which the level of PM associa-tion of all other markers also appears to markedly change or to display noticeable discontinuity (Fig. 1B).
Differences in the dynamic behavior of each of the three analyzed TM protein makers, which may be caused in part by differential interactions with un-equally distributed membrane or cell wall components (Martinière et al., 2012; Trimble and Grinstein, 2015), presumably contribute to the distinct distribution pat-terns displayed by these makers. In fact, a truncated AtPRK1DSP-LRR::eYFP fusion protein, which was missing the entire N terminus of AtPRK1 (amino acids 1–229) including the SP and the extracellular LRR ligand-binding domain (Fig. 1A), displayed an essen-tially even distribution in the PM and in apical vesicles similar to NtINT4::eYFP (Fig. 1B). This strongly sug-gests that specific interactions of the LRR domain with the apical cell wall, which by contrast to all other re-gions of the pollen tube cell wall is mostly composed of esterified pectin (Geitmann and Parre, 2004; Bosch et al., 2005; Parre and Geitmann, 2005; Röckel et al., 2008; Chebli et al., 2012), may be responsible for the observed specific accumulation of full-length AtPR-K1::eYFP within the PM at the apex. In the absence of the N-terminal SP of full-length AtPRK1 (Fig. 1A), the TM domain of AtPRK1DSP-LRR::eYFP appears to me-diate ER recruitment and subsequent membrane in-sertion of this truncated fusion protein (Shao and Hegde, 2011; Kim and Hwang, 2013).
In addition to differential interactions with mem-brane or cell wall components, differences in the rates of (1) intramembrane diffusion, which depends on protein size, density and number of TM domains (Saffman et al., 1975; Kusumi et al., 1993; Frick et al., 2007; Goose and Sansom, 2013; Weiß et al., 2013), (2) exocy-tosis, (3) endocytic uptake, and/or (4) degradation may also contribute to the distinct distribution patterns displayed by the three analyzed markers. These possi-bilities were further explored by additional experi-ments and theoretical modeling as described below.
FRAP Analyses of the Dynamic Behavior of TM Protein Markers for Membrane Traffic Demonstrate
Apical Secretion
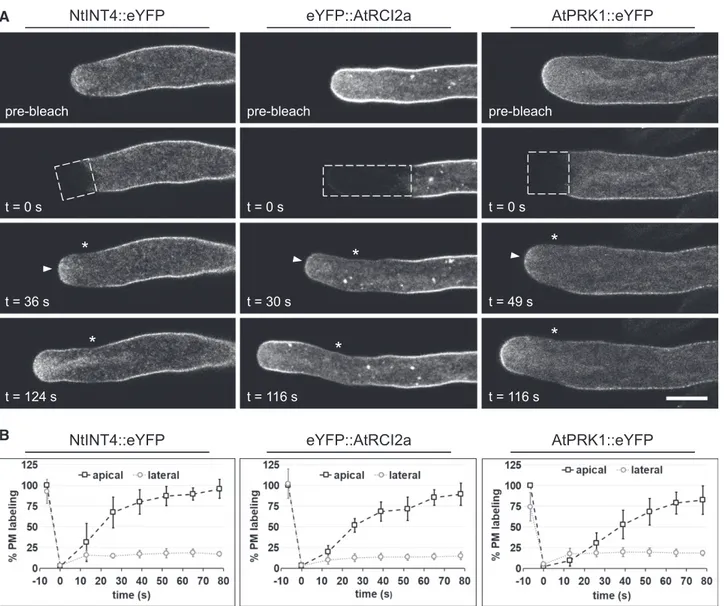
To identify major sites of secretion, at which TM proteins are incorporated into the PM, FRAP analysis was employed to investigate the dynamic behavior of NtINT4::eYFP, eYFP::AtRCI2a, and AtPRK1::eYFP at the tip of growing pollen tubes. After complete photo-bleaching of eYFPfluorescence at the tip of transiently or stably transformed pollen tubes expressing each of these markers,fluorescence recovery was observed by time-lapse confocal imaging of individual pollen tubes (Fig. 2). PM labeling by all three markersfirst recovered in the same region within the apical dome 30 to 49 s
after photobleaching (Fig. 2, A, third row arrowheads, and B), before the typical steady-state distributions of each of the markers were largely re-established after about 120 s (Fig. 2, fourth row). Interestingly, the apical PM region, in which labeling by all markers first re-covered, appears to largely overlap with the membrane domain displaying highest levels of steady-state AtPRK1::eYFP labeling (0 to ;3 mm meridional dis-tance from the extreme apex; Fig. 1B). Larger sets of confocal time-lapse images showing fluorescence re-covery in each of the pollen tubes displayed in Figure 2 at higher time resolution are provided as supplemental data (Supplemental Figs. S2–S4). All analyzed pollen tubes grew normally at rates of at least 3 mm min21 during postbleach time-lapse imaging (t 5 0 to 116–124 s; Supplemental Fig. S5).
Interestingly, substantial fluorescence recovery was not observed within lateral regions of the PM (more than about 3mm meridional distance from the extreme apex), which were photobleached together with the apical dome (Fig. 2, A, third and fourth row asterisks, and B). To investigate this more thoroughly, large re-gions of NtINT4::eYFP-, eYFP::AtRCI2a-, or AtPR-K1::eYFP-expressing pollen tubes positioned just behind the apical dome were completely photobleached. In these experiments, even after an extended postbleach period of 360 s, very little recovery of PM-associated fluorescence was observed within the bleached regions (Supplemental Fig. S6, A, third row asterisks, and B) although all analyzed pollen tubes grew normally at rates of at least 3mm/min during postbleach time-lapse imaging (t5 0 to 360 s; Supplemental Fig. S7). Further-more, in control experiments NtINT4::eYFP-, eYF-P::AtRCI2a- or AtPRK1::eYFP-expressing pollen tubes were preincubated with BFA, a drug that disrupts membrane traffic and blocks tip growth (Supplemental Fig. S8), before they were completely photobleached at the tip. These experiments showed that BFA treatment effectively prevented recovery of apical PM labeling by each of these markers (Supplemental Fig. S9) in all ana-lyzed pollen tubes. Together, these observations dem-onstrate that after photobleaching, rapid and effective recovery of PM labeling by fluorescent TM protein markers is confined to a small region within the apical dome and depends on active membrane traffic.
In summary, the results presented in this section es-tablish that three different TM proteins serving as markers for membrane traffic are specifically delivered to the same small PM domain within the apical dome of normally growing pollen tubes, strongly suggesting that this PM domain represents a major site of secretion.
Analysis of the Establishment of Steady-State PM Labeling by FM4-64, a Fluorescent Lipid Marker for Membrane Traffic, Supports Apical Secretion
As described in the literature, the fluorescent lipo-philic dye FM4-64 becomes redfluorescent upon incor-poration into the pollen tube PM and is subsequently
endocytosed (Parton et al., 2001, 2003; Bolte et al., 2004; van Gisbergen et al., 2008). Consistent with the require-ment of pollen tube tip growth for massive membrane recycling (see “Introduction”), a large proportion of the endocytosed FM4-64-labeled PM material is rapidly recycled back to the secretory endomembrane system,
whereas only a small proportion of this material enters the endocytic endomembrane system and eventually (about 24 h after dye application) detectably labels endosomal and vacuolar compartments (Parton et al., 2001).
Confocal time course imaging was performed to carefully investigate changes in FM4-64 labeling patterns
Figure 2. FRAP time-lapse analysis of TM protein marker dynamics at the tip of normally growing tobacco pollen tubes. A, Medial confocal optical sections through representative pollen tubes transiently (NtINT4::eYFP or AtPRK1::eYFP) or stably (eYFP::AtR-CI2a) expressing the indicated TM protein marker, which were recorded before (row 1, prebleach) or after complete photo-bleaching of eYFP fluorescence within the dashed box indicated in row 2. t, Time elapsed after photophoto-bleaching; arrowheads, apical PM domain within which fluorescence recovery was first observed; *, bleached lateral PM domain showing no fluores-cence recovery. Scale bar5 10 mm. During postbleach time-lapse imaging (t 5 0 to 116–124 s), the growth rate of the individual pollen tubes shown was 4.2mm min21(NtINT4::eYFP), 8.7mm min21(eYFP::AtRCI2a), and 5.1mm min21(AtPRK1::eYFP). In total, seven (NtINT4::eYFP, two independent experiments), 10 (eYFP::AtRCI2a, two independent experiments), or 12 (AtPR-K1::eYFP, three independent experiments) TM protein-marker-expressing pollen tubes were analyzed. Each TM protein marker displayed essentially the same fluorescence recovery pattern and kinetics in all analyzed pollen tubes. B, Quantification of PM labeling by the indicated TM protein marker in the bleached region either at the extreme apex (0mm meridional distance from the extreme apex; arrowheads in A; open squares) or in the center of a lateral domain (more than 3mm meridional distance from the extreme apex; asterisks in A; open circles) immediately before (t5 26.5 s) and after (t 5 0 s) photobleaching, as well as after different recovery periods (13, 26, 39, 52, 65, and 78 s). The indicated average levels of PM labeling were computed from data obtained from all analyzed pollen tubes (A) after normalization based on prebleach levels of PM labeling at the extreme apex, which were set to 100%.
during thefirst 60 min after dye application to cultured tobacco pollen tubes (Fig. 1C). Immediately after ap-plication (0–5 min), FM4-64 exclusively and evenly la-beled the PM (Fig. 1C, first row). Subsequently, dye redistribution was observed as a consequence of membrane traffic, which resulted about 40 min after dye application in the establishment of a steady-state labeling pattern that remained stable for the rest of the observation period (41–60 min). At this steady-state stage, FM4-64 specifically and evenly labeled not only the PM but also apical vesicles (Fig. 1C, third row). These observations are consistent with data reported in the literature (Parton et al., 2001). However, particu-larly informative was the imaging of pollen tubes 6 to 40 min after FM4-64 application, during which dye redistribution resulting from endocytic uptake and recycling to the secretory endomembrane system was observed. At this dye redistribution stage, which was not carefully investigated in previous studies, FM4-64 most strongly labeled a small PM domain within the apical dome (Fig. 1C, second row). Interestingly, this domain appeared to largely overlap with the apical membrane region, which displays steady-state AtPRK1::eYFP accumulation at highest levels (0 to;3 mm meridional distance from the extreme apex; Fig. 1B), and in which labeling by all TM protein markers first recovered in FRAP time-lapse experi-ments (Fig. 2). Figure 1C shows images of normally growing pollen tubes (Fig. 1C, left) that after confocal imaging continued to elongate at a rate of at least 3mm min21(Supplemental Fig. S1B), along with line plots displaying average intensities of PM-associated eYFP fluorescence in such pollen tubes at different meridional distances from the apex (Fig. 1C, right). A larger set of time course images showing changing FM4-64 labeling patterns during thefirst 60 min after dye application at higher time resolution is provided as supplemental data (Supplemental Fig. S10). Es-sentially, the same changes in the FM4-64 labeling pattern during this time period were also observed by time lapse imaging of individual pollen tubes (Supplemental Fig. S11A).
Results discussed in the previous paragraph establish that in normally elongating pollen tubes, the steady-state distributions of externally applied FM4-64 (Fig. 1C, third row; Supplemental Fig. S11A, right) and of endogenously produced TM protein markers (Fig. 1B), in particular of NtINT4::eYFP and AtPRK1DSP-LRR::eYFP, were remarkably similar. This underscores the usefulness of FM4-64 and of the analyzed TM protein markers as excellent tools to investigate major routes of apical traf-ficking of PM-associated lipids and proteins, respectively, during pollen tube tip growth. Furthermore, the prefer-ential accumulation of FM4-64 in a small PM region within the apical dome at the dye redistribution stage (6–40 min after application; Fig. 1C, center row; Supplemental Fig. S11A, center) strongly suggests that PM-associated FM4-64 is actively transported from sites of endocytic internalization to the apical major site of se-cretion, which was identified based on FRAP analyses of
the dynamic behavior of TM protein markers (Fig. 2) and also displayed highest levels of steady-state AtPR-K1::eYFP accumulation (Fig. 1B). Continued endocytic FM4-64 internalization and recycling during the dye re-distribution stage appears to cause increasing dye satu-ration of apical vesicles, eventually resulting in even labeling of these vesicles and of the PM at the steady-state stage. Based on this interpretation, changes in FM4-64 labeling patterns observed during thefirst 60 min after dye application further support the identification of a small PM region within the apical dome as a major site of secretion and indicate that membrane traffic results in the massive delivery not only of proteins but also of recycled lipid components of the PM to this site.
Analysis of BFA-Induced Loss of FM4-64 PM Labeling Demonstrates Subapical Endocytosis of PM Lipids
As discussed perviously, BFA blocks pollen tube tip growth (Supplemental Fig. S8) by disrupting mem-brane traffic. More specifically, in plants, a key effect of BFA treatment is the inhibition of the formation of exocytic vesicles at the TGN (Geldner et al., 2001; Nebenführ et al., 2002), which in these organisms is not only a key component of the secretory endomembrane system, but also serves as an early and recycling en-dosome (Dettmer et al., 2006; Lam et al., 2007; Reyes et al., 2011; Contento and Bassham, 2012; Paez Valencia et al., 2016). By contrast, endocytic uptake of PM ma-terial continues in the presence of BFA (Baluska et al., 2002; Emans et al., 2002; Wang et al., 2005). Conse-quently, in different types of plant cells (Geldner et al., 2001; Parton et al., 2001, 2003), including tobacco pollen tubes (Helling et al., 2006; Röckel et al., 2008; Stephan et al., 2014), BFA blocks the recycling of endocytosed material back to the PM and causes this material to be trapped within the TGN. BFA effects on growing pollen tubes have been reported to take about 20 min to fully develop (Parton et al., 2001, 2003; Rounds et al., 2014). This drug generally induces aberrant TGN elements to fuse to so-called BFA compartments (Lippincott-Schwartz et al., 1991; Nebenführ et al., 2002; Tse et al., 2006), which in pollen tubes typically form a single subapical structure that becomes detectable only after prolonged ($30–60 min) incubation (Parton et al., 2001, 2003; Helling et al., 2006; Stephan et al., 2014).
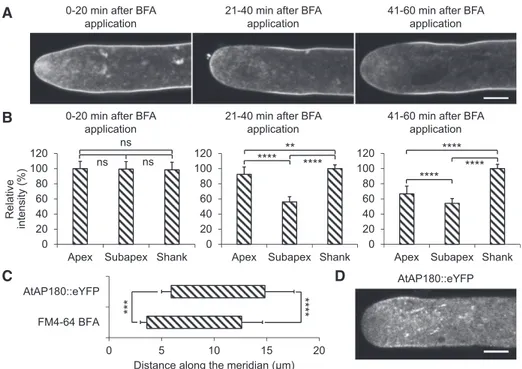
Based on the known BFA effects summarized in the previous paragraph, we hypothesized that BFA treat-ment of pollen tubes displaying FM4-64 labeling (Fig. 1C) should result in a reduction of PM labeling selectively at major sites of endocytic uptake of mem-brane material. In fact, this was observed by confocal time course imaging of FM4-64fluorescence displayed by cultured tobacco pollen tubes, which had been grown for 30 min in the presence of FM4-64 (dye re-distribution stage; Fig. 1C, second row), before the dye was washed out from the culture medium and BFA was added (Fig. 3, A and B). Whereas the PM remained essentially evenly labeled for thefirst 20 min after BFA
application, during the following 20 min, PM-associated FM4-64fluorescence selectively decreased slightly within the apical dome and massively within a sharply defined subapical region. Interestingly, 41 to 60 min after BFA application, FM4-64 labeling of the PM within the apical dome further decreased to almost the same level as ob-served within this subapical region (Fig. 3, A and B). A BFA compartment was often not clearly discernible in the analyzed pollen tubes, as strong FM4-64 labeling of this compartment typically only starts to develop after 30 to 60 min in the presence of BFA (Parton et al., 2001,
2003). Figure 3A shows representative images of dif-ferent FM4-64-labeled pollen tubes recorded during the indicated time periods after BFA application. A larger set of time course images showing changes in FM4-64 distribution in BFA-treated pollen tubes at higher time resolution is provided as supplemental data (Supplemental Fig. S12). Essentially the same changes in FM4-64 labeling patterns within the first 60 min after BFA application were also observed by time-lapse imaging of individual pollen tubes (Supplemental Fig. S11B,first row). Figure 3B shows
Figure 3. Time course analysis of BFA-induced loss of FM4-64 PM labeling and investigation of AtAP180::eYFP distribution in tobacco pollen tubes. A, Medial confocal optical sections through different representative pollen tubes, which were grown in the presence of FM4-64 (applied at 50mMin 200mL PTNT) for 30 min, before the dye was washed out from the culture medium and
BFA was applied for the indicated time period (70mMin 200mL PTNT). Scale bar 5 5 mm. As a result of the BFA treatment, tip
growth of all analyzed pollen tubes was completely inhibited (Supplemental Fig. S8). All pollen tubes analyzed during each time period after BFA application (n5 10 [0–20 min], 22 [21–40 min], and 35 [41–60 min]; three independent experiments) displayed very similar FM4-64 labeling patterns. B, Quantitative analysis of the average relative intensity of PM-associated FM4-64 fluo-rescence in all pollen tubes analyzed as described in A within the apical dome (Apex, meridional distance from the apex, 0–3.6 mm), within a subapical region displaying massive loss of FM4-64 PM labeling in the presence of BFA (Subapex, meridional distance from the apex, 3.6–12.6mm), and in the shank (Shank, meridional distance from the apex, 12.6–32.6 mm). The borders between these three PM regions were determined as described in C. The intensity of PM-associated FM4-64 fluorescence was normalized in each analyzed pollen tube based on the highest measured value (0–32.6mm meridional distance from the apex), which was set to 100%. The statistical significance of differences in the average intensity of PM-associated FM4-64 fluorescence between the three different PM regions during each time period after BFA application was assessed using ANOVA (Tukey’s test, one way; **P# 0.01 and ****P # 0.0001; ns, not significantly different [P . 0.05]). Error bars 5SD. C, Quantitative analysis of the exact length and position of the subapical PM domains, which displayed massive loss of FM4-64 PM labeling 21 to 40 min after BFA application (A) or were associated with an AtAP180::eYFP fusion protein serving as a marker for sites of clathrin-mediated endocytosis (D). The average meridional distances from the extreme apex (x5 0) of both ends of these domains in all analyzed pollen tubes (n5 22 [FM4-64 BFA] or 22 [AtAP180::eYFP]) are indicated. Exact extensions of domains shown: 5.9 6 0.91 to 14.8 6 2.8 mm (AtAP180::eYFP); 3.6 6 0.61 to 12.6 6 2.0 mm (FM4-64 BFA). The statistical significance of differences between the average meridional distances of both the proximal and the distal ends of the FM4-64 BFA and AtAP180::eYFP domains was assessed using a Student’s t test (two-tailed, type II; ***P# 0.001 and ****P # 0.0001). Error bars 5SD. D, Medial confocal optical
section through a representative normally growing pollen tube transiently expressing an AtAP180::eYFP fusion protein that serves as a marker for sites of clathrin-mediated endocytosis. In total, 25 essentially normally growing pollen tubes were analyzed in two independent experiments, which displayed very similar AtAP180::eYFP distribution patterns. Growth rate of the pollen tube shown (after confocal imaging): 4.8mm min21. Scale bar5 5 mm.
the results of a quantitative and statistical analysis of changes in the intensity of PM-associated FM4-64 fluorescence in all pollen tubes analyzed by time course imaging in the apical dome, the subapical re-gion and the shank. Furthermore, the exact average length and position of the subapical region displaying massive loss of PM-associated fluorescence 21 to 40 min after BFA application was determined in these pollen tubes (Fig. 3C; FM4-64 BFA).
In summary, data presented in Figure 3, A, B, and C, as well as in Supplemental Figure S11B, identify a subapical region of the tobacco pollen tube PM as a major site of endocytic uptake of FM4-64-labeled lipid material. This region extends between proximal and distal ends positioned at an average meridional dis-tance of 3.6 and 12.6mm, respectively, from the extreme apex (x5 0 mm). Ongoing endocytic uptake massively reduces FM4-64 labeling of the PM within this region 21 to 40 min after BFA treatment, apparently because this drug blocks recycling of internalized dye via the se-cretory endomembrane system back to the apical PM. The delayed massive reduction of PM labeling also within the apical dome 41 to 60 min after BFA treatment appears to be caused by FM4-64 diffusion from this PM domain to the subapical major site of endocytosis fol-lowed by dye internalization at this site. By contrast, a reduction of FM4-64 labeling of the PM in the shank was not detected within 60 min after BFA application, presumably because the dye pool in this region of the PM was much larger.
The PM Association Pattern of AtAP180::eYFP, a Marker for Clathrin-Mediated Endocytosis at the PM, Supports Subapical Endocytosis
AtAP180 is a component of the clathrin machinery (Barth and Holstein, 2004), which is required for the formation of endocytic vesicles at the PM during clathrin-mediated endocytosis, the most prominent form of endocytosis in plants (Dhonukshe et al., 2007; Pérez-Gómez and Moore, 2007; Fan et al., 2015). Fluo-rescent AtAP180 fusion proteins have been employed to identify endocytic PM domains in different types of cells, including tobacco pollen tubes (Stavrou and O’Halloran, 2006; Zhao et al., 2010; Kaneda et al., 2019). Consistent with previously reported observa-tions (Zhao et al., 2010; Kaneda et al., 2019), confocal imaging of essentially normally growing tobacco pollen tubes transiently expressing an AtAP180::eYFP fusion protein established that this fusion protein accumulated at the PM specifically in a subapical region (Fig. 3D), which largely overlapped with the major domain of endocytic uptake of membrane lipids that was identi-fied based on BFA treatment after FM4-64 labeling (Fig. 3, A, B, and C; Supplemental Fig. S11B). Figure 3D shows a representative image of an AtAP180::eYFP-expressing pollen tube. All analyzed pollen tubes con-tinued to grow at a normal rate of at least 3mm min21 -after confocal imaging, although they displayed a slight
but statistically significant reduction in average growth rate as compared to control pollen tubes expressing free eYFP (Supplemental Fig. S13). The exact average length and position of the subapical PM domain at which AtAP180::eYFP accumulated is indicated in Figure 3C. As shown in this figure, the subapical PM domains identified based on AtAP180::eYFP imaging and on the analysis of loss of FM4-64 PM labeling after BFA treat-ment shared an identical length (;9 mm) and were largely overlapping. However, the AtAP180::eYFP-la-beled domain was positioned 2.3 mm more distally (further away from the apex). AtAP180::eYFP was im-aged in normally elongating pollen tubes, whereas analysis of loss of FM4-64 PM labeling was performed after BFA treatment, which effectively blocks pollen tube tip growth. This may be responsible for the 2.3-mm shift between the two domains, as PM domains at the pollen tube tip typically shift toward the apex upon inhibition of pollen tube growth (Helling et al., 2006; Zhao et al., 2010; Potocký et al., 2014). Unfortunately, this hypothe-sis could not be experimentally verified, as for unknown reasons AtAP180::eYFP did not detectably accumulate at the PM of pollen tubes treated with BFA to block FM4-64 recycling or with other drugs that inhibit pollen tube tip growth.
In any case, data resulting from confocal AtA-P180::eYFP imaging provide compelling support for the presence of an about 9-mm-long major domain of endocytic uptake of lipid material within the subapical PM of tobacco pollen tubes, which was identified based on the analysis of loss of FM4-64 PM labeling after BFA treatment. Furthermore, the observed intracellular distribution of AtAP180::eYFP (1) indicates that in normally growing pollen tubes the proximal end of the identified subapical endocytic domain is positioned at a meridional distance of about 5.9mm from the extreme apex and (2) strongly suggests that clathrin-mediated endocytosis occurs within this domain.
Unlike FM4-64-Labeled Lipid Material, TM Protein Markers for Membrane Traffic Are Not
Subapically Endocytosed
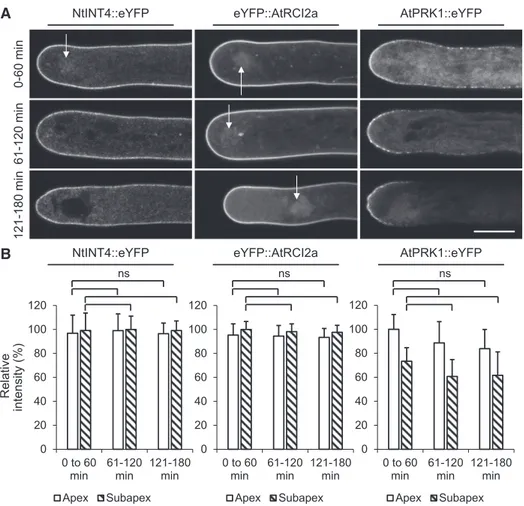
Tobacco pollen tubes expressing NtINT4::eYFP, eYFP::AtRCI2a, or AtPRK1::eYFP were treated with BFA to test whether in the presence of this drug, similar to FM4-64 PM labeling (Fig. 3; Supplemental Fig. S11B, first row), PM labeling by these TM protein markers also massively decreases within the apical dome and the identified subapical endocytic domain 20 to 60 min after drug application. This would indicate that not only FM4-64-labeled lipid material but also TM marker proteins are endocytically internalized within this subapical domain. To our surprise, although a large number of pollen tubes expressing each of the three TM protein markers were observed by confocal time course imaging 0 to 180 min after BFA application, a reduction of PM-associated eYFP fluorescence within the apical dome or the subapical endocytic domain was never
observed (Fig. 4). In Figure 4A, representative images of different pollen tubes expressing each of the three TM marker proteins are presented, which were recorded by time course imaging during the indicated time periods after BFA application. Essentially stable labeling of the apical and subapical PM by each of the TM protein markers within thefirst 60 min after BFA application was also observed by time lapse imaging of individual pollen tubes (Supplemental Fig. S11B, rows 2–4). Quantitative analysis (Fig. 4B) of all NtINT4::eYFP- or eYFP::AtRCI2a-expressing pollen tubes investigated by
time course imaging established that the relative in-tensity of PM labeling by these TM protein markers within the apical dome and the subapical endocytic region (normalized based on maximal intensity mea-sured within both these two membrane domains in each analyzed pollen tube) remained close to 100% in the presence of BFA even after prolonged incubation. By contrast to NtINT4::eYFP and eYFP::AtRCI2a, AtPRK1::eYFP specifically accumulated to highest levels in the PM within the apical dome of untreated, normally growing tobacco pollen tubes (Fig. 1B).
Figure 4. Time-course analysis of PM labeling by TM protein markers in tobacco pollen tubes after BFA application. A, Medial confocal optical sections through different representative pollen tubes transiently (AtPRK1::eYFP) or stably (NtINT4::eYFP; eYFP::AtRCI2a) expressing the indicated TM protein marker recorded after treatment with BFA (applied at 70mMin 200mL PTNT)
for the indicated time period. Arrows, BFA compartment. Scale bar5 10 mm. As a result of the BFA treatment, tip growth of all analyzed pollen tubes was completely inhibited (Supplemental Fig. S8). During each time period after BFA application, all imaged pollen tubes expressing the same TM protein marker displayed highly similar PM labeling patterns (NtINT4::eYFP [three independent experiments], n5 78 [0–60 min], 61 [61–120 min], or 37 [121–180]; eYFP::AtRCI2a [five independent experi-ments], n5 85 [0–60 min], 82 [61–120 min], or 97 [121–180 min]; AtPRK1::eYFP [three independent experiments], n 5 46 [0–60 min], 37 [61–120 min], or 31 [121–180 min]). B, Quantitative analysis of the average relative intensity of PM-associated TM protein marker fluorescence in all pollen tubes analyzed as described in A within the apical dome (Apex, meridional distance from the apex, 0–3.6mm) and within the subapical endocytic region, which was identified based on BFA treatment of FM4-64-labeled pollen tubes as described in Figure 3 (Subapex, meridional distance from the apex, 3.6–12.6mm). The intensity of PM-associated marker fluorescence was normalized in each analyzed pollen tube based on the maximal intensity measured with these two membrane domains (0–12.6mm meridional distance from the apex), which was set to 100%. For each TM protein marker, the statistical significance of differences in the average intensity of PM-associated marker fluorescence during different time periods after BFA application was assessed separately within the apical dome and the subapical endocytic region using ANOVA (Dunnett’s test, one-way). ns, Not significantly different (P. 0.05). Error bars 5SD.
Consequently, the relative intensity of AtPRK1::eYFP PM labeling observed by time course imaging was lower within the subapical endocytic region than within the apical dome also in the presence of BFA (Fig. 4). However, the relative intensity of AtPR-K1::eYFP PM labeling did not detectably change during BFA treatment in either of these two regions (Fig. 4B).
The PM distribution displayed by each of the ana-lyzed TM protein makers during normal tip growth (Fig. 1) substantially changed after BFA-induced inhi-bition of this process (Fig. 4; Supplemental Fig. S11B). In the presence of this drug, NtINT4::eYFP and eYF-P::AtRCI2a displayed an essentially even distribution within the PM, whereas AtPRK1::eYFP labeling of this structure increasingly assumed a dotted appearance and eventually completely disappeared in the shank. High turnover of this TM protein marker predomi-nantly in the shank, which remained uncompensated because secretion was blocked, possibly contributed to this behavior. In any case, data shown in Figure 4 and in Supplemental Figure S11 demonstrate that by con-trast to FM4-64-labeled lipid material, none of the an-alyzed TM protein markers was detectably internalized within the subapical endocytic PM region after BFA application.
Although in some pollen tubes imaged (as described in the previous paragraph) a typical subapical BFA compartment was visible after prolonged BFA incuba-tion, invariably this compartment was only dimly la-beled as compared to the PM (Fig. 4A; Supplemental Fig. S11B, arrows). Consistent with the persistence of TM protein marker labeling of the subapical endo-cytic PM domain in the presence of BFA (Fig. 4; Supplemental Fig. S11B), this observation suggests that TM protein markers are not endocytosed and cannot be delivered to the BFA compartment via this route. The weak labeling of the BFA compartment in some ana-lyzed pollen tubes presumably is a consequence of re-distribution of TM protein markers proteins already present within the secretory endomembrane system at the time of BFA application. As BFA blocks not only the formation of secretory vesicles at the TGN, but also ER to Golgi transport (Jiang and Rogers, 1998; Nebenführ et al., 2002), newly synthesized TM protein markers were unable to reach the BFA compartment in these experiments.
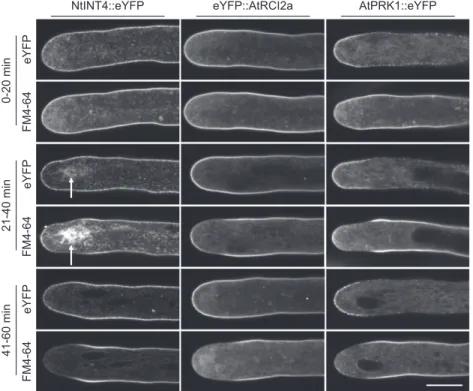
To confirm the data presented in Figure 4 and Supplemental Figure S11B, NtINT4::eYFP-, eYF-P::AtRCI2a-, or AtPRK1::eYFP-expressing pollen tubes were colabeled for 30 min with FM4-64 and treated with BFA after the dye was washed out from the culture medium. Two-channel confocal time course imaging was employed to simultaneously observe the intracel-lular distribution of the TM protein markers (eYFP, greenfluorescence) and of FM4-64 (red fluorescence) at different time points for 60 min after BFA application (Fig. 5). Consistent with observations described above (Fig. 3; Supplemental Fig. S11B), BFA induced a mas-sive decrease of FM4-64 labeling of the PM early (21–40 min after application) within the subapical
endocytic domain and later (41–60 min after applica-tion) also within the apical dome (Fig. 5, FM4-64). By contrast, no concomitant loss of PM labeling by any of the analyzed TM protein markers was detected in either of these two PM regions (Fig. 5, eYFP). Interestingly, a BFA compartment was occasionally visible in individ-ual analyzed pollen tubes, which, relative to the PM, was labeled strongly by FM4-64 but only weakly by the expressed TM protein marker (Fig. 5, arrows). As dis-cussed in the previous paragraph, this observation supports transport of FM4-64 but not of TM protein markers to the BFA compartment via endocytosis.
Together, data presented in Figures 4 and 5 and Supplemental Figure S11B establish that all analyzed TM protein markers are excluded from the massive internalization of FM4-64-labeled material observed within the subapical endocytic PM domain, which therefore appears to be specifically required for the recycling of excess lipid material delivered to the apical PM via secretion in tobacco pollen tubes.
The Subapical Endocytic PM Domain Partially Overlaps with a Detached TGN Compartment But Not with the F-actin Fringe
A subapically positioned VHAa1-positive (Dettmer et al., 2006) TGN compartment is postulated to act as a central sorting organelle with key functions in mem-brane traffic and in the recycling of PM material at the tip of growing tobacco pollen tubes (Stephan et al., 2014). This organelle is proposed to process mem-brane material delivered by endocytic vesicles to its distal surface and to recycle this material to secretory vesicles that are generated on its proximal surface (Stephan et al., 2014). Maintenance of the subapical position of this TGN compartment within the pollen tube cytoplasm depends on the F-actin fringe (Stephan et al., 2014), a cortical ring-like F-actin structure located close to the pollen tube apex (Kost et al., 1998; Chen et al., 2002; Lovy-Wheeler et al., 2005; Wilsen et al., 2006; Cheung et al., 2008; Vidali et al., 2009). An intact F-actin fringe appears to be essential for pollen tube tip growth (Bou Daher and Geitmann, 2011; Dong et al., 2012; Rounds et al., 2014; Stephan et al., 2014), possibly because of functions of this structure not only in TGN positioning but also directly in apical secretion (Cárdenas et al., 2008; Bou Daher and Geitmann, 2011; Dong et al., 2012; Rounds et al., 2014) and/or subapical endocytic membrane internalization (Samaj et al., 2006; Galletta and Cooper, 2009; Moscatelli et al., 2012; Meunier and Gutiérrez, 2016; Li et al., 2018).
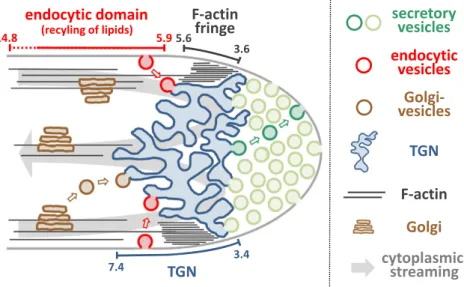
To enhance our understanding of roles of the sub-apical TGN compartment and of the F-actin fringe in the endocytic uptake of FM4-64-labeled lipid material (Figs. 3 and 5; Supplemental Fig. S11B), the exact po-sitions of these two structures in normally growing tobacco pollen tubes were mapped (Fig. 6) relative to each other and to the location of the subapical endocytic PM domain as determined based on AtAP180::eYFP
labeling (Fig. 3, C and D). The two F-actin markers eYFP::MTn (mouse talin; Kost et al., 1998) and life-act::eYFP (Riedl et al., 2008; Vidali et al., 2009) both enable visualization of the F-actin fringe in tobacco pollen tubes displaying normal tip growth (Montes-Rodriguez and Kost, 2017). To noninvasively label the subapical VHAa1-positive TGN in such pollen tubes, eYFP fused to the ROP effector NtRISAP (eYFP::N-tRISAP) can be employed (Stephan et al., 2014). To-bacco pollen tubes transiently expressing lifeact::eYFP, eYFP::MTn, or eYFP::NtRISAP at low levels under the control of the LAT52 promoter were imaged using confocal microscopy. Representative images of pollen tubes expressing each of these eYFP fusion proteins and growing essentially normally at a rate of at least 3mm min21 after confocal imaging (Supplemental Fig. S14) are shown in Figure 6A. Figure 6B presents the results of a quantitative and statistical analysis of the positions of the subapical TGN compartment and of the F-actin fringe in all imaged pollen tubes. The average meridional
distance from the extreme apex (x 5 0) of the most proximal and the most distal contact point of each of these two cytoplasmic structures with the PM is indicated in thisfigure. To facilitate direct comparison, the same figure also shows the position of the AtAP180::eYFP-labeled subapical endocytic PM domain in normally growing tobacco pollen tubes, which was determined as described above (Fig. 3, C and D). Together, data presented in Fig-ure 6 allow the following interesting conclusions: (1) in-dependently of the F-actin marker used, no overlap was observed between the F-actin fringe and the subapical endocytic PM domain, strongly suggesting that the F-actin fringe is not directly required for membrane in-ternalization within this domain; (2) the F-actin fringe completely overlaps with the proximal half of the subapical TGN compartment, consistent with the reported essential function of the F-actin fringe in the cytoplasmic positioning of this compartment (Stephan et al., 2014); and (3) the distal half of the subapical TGN compartment overlaps with a short (;1.5 mm) subdomain
Figure 5. Simultaneous time course analysis of FM4-64 and TM protein marker PM labeling in BFA-treated tobacco pollen tubes. Medial confocal optical sections through different representative pollen tubes transiently (AtPRK1::eYFP) or stably (NtINT4::eYFP, eYFP::AtRCI2a) expressing the indicated TM protein marker, which had been grown in the presence of FM4-64 (applied at 50mM
in 200mL PTNT) for 30 min before the dye was washed out from the culture medium and BFA was applied for the indicated time period (70mMin 200mL PTNT). eYFP fusion proteins serving as TM protein markers (green fluorescence, eYFP) and FM4-64 (red fluorescence, FM4-64) were simultaneously imaged in separate channels. As a result of the BFA treatment, tip growth of all analyzed pollen tubes was completely inhibited (Supplemental Fig. S8). During each of the indicated time periods, all imaged pollen tubes displayed essentially the same patterns of FM4-64 and of TM marker protein specific eYFP labeling of the PM (NtINT4::eYFP [two independent experiments], n5 11 [0–20 min], 22 [21–40 min], or 19 [41–60 min]; eYFP::AtRCI2a [two independent experiments], n5 10 [0–20 min], 22 [21–40 min], or 22 [41–60 min]; AtPRK1::eYFP [four independent experi-ments], n5 10 [0–20 min], 16 [21–40 min], or 23 [41–60 min]). The BFA compartment visible in the NtINT4::eYFP-expressing pollen tube shown (21–40 min after BFA application) was clearly more strongly labeled by FM4-64 than by NtINT4::eYFP (ratio between the average fluorescence intensities displayed by the BFA compartment and by the apical PM, 1.39 [FM4-64] and 0.65 [NtINT4::eYFP]). Arrow, BFA compartment. Scale bar5 10 mm.
at the proximal end of the subapical endocytic PM region, a spatial arrangement that is fully consistent with the proposed delivery of internalized membrane material by endocytic vesicles to the distal surface of this compartment.
BFA treatment not only blocks secretion but also rapidly disrupts the subapical F-actin fringe at the pollen tube tip (Rounds et al., 2014). To further inves-tigate a possible role of the F-actin fringe in membrane internalization within the subapical endocytic PM re-gion, pollen tubes transiently expressing eYFP::MTn or lifeact::eYFP were colabeled for 30 min with FM4-64 before the dye was washed out from the culture me-dium and BFA was applied. Two-channel confocal time course imaging was performed to simultaneously vi-sualize F-actin organization (eYFP; greenfluorescence) and FM4-64 labeling (redfluorescence) at different time points during the first 60 min after BFA application (Fig. 7). BFA treatment (1) stopped pollen tube growth (Supplemental Fig. S8), (2) rapidly (0–20 min after drug application) disrupted the subapical F-actin fringe (Fig. 7, eYFP), and (3) as previously demonstrated (Figs. 3 and 5; Supplemental Fig. S11B,first row), induced a massive decrease of FM4-64 labeling of the PM first (21–40 min after drug application) within the subapical endocytic domain and later (41–60 min after drug
application) also within the apical dome (Fig. 7, FM4-64). The same observations were also made by time lapse imaging of lifeact::eYFP-expressing and FM4-64-labeled individual pollen tubes after the application of BFA either alone or in combination with the actin dis-rupting drug Latrunculin B (LatB; Supplemental Fig. S15). Combined application of BFA and LatB not only caused rapid disruption of the F-actin fringe but also strongly affected longitudinally oriented F-actinfibers. Together, these findings demonstrate that internaliza-tion of FM4-64-labeled lipid material within the sub-apical endocytic PM domain can occur in the absence of an intact F-actin fringe.
Data presented in this section firmly establish that, consistent with the observed lack of overlap between the F-actin fringe and the subapical endocytic PM do-main (Fig. 6), drug-induced F-actin fringe disruption does not affect the internalization of lipid material within this membrane domain (Fig. 7). The F-actin fringe therefore clearly has no direct function in this process. However, previously reported (Stephan et al., 2014) key functions of the F-actin fringe in the posi-tioning of a subapical TGN compartment, as well as of this TGN compartment in the recycling of endocytosed PM material, are supported by the quantitative struc-tural data shown in Figure 6. Consequently, the F-actin Figure 6. Positional mapping of a detached TGN compartment and of the F-actin fringe relative to each other and to the subapical
endocytic PM domain in tobacco pollen tubes. A, Medial confocal optical sections through representative essentially normally growing pollen tubes transiently expressing the TGN marker eYFP::NtRISAP (n5 13, four independent experiments) or one of the F-actin markers Lifeact::eYFP (n5 17, three independent experiments) or eYFP::MTn (n 5 19, three independent experiments). All pollen tubes expressing the same marker displayed highly similar eYFP labeling patterns. Growth rate of the pollen tubes shown (after confocal imaging), 3.6mm min21(eYFP::NtRISAP), 5.4mm min21(Lifeact::eYFP), and 4.8mm min21(eYFP::MTn).
Scale bar,5 10 mm. B, Quantitative analysis of the meridional distance from the extreme apex (x 5 0 mm) of the most proximal and the most distal contact points of the NtRISAP-associated TGN compartment or of the F-actin fringe, with the PM in all pollen tubes analyzed as described in A. For direct comparison, the position of the AtAP180::eYFP-labeled subapical endocytic PM domain, which was determined in normally growing pollen tubes as described above (Fig. 3, C and D), is also indicated. Exact extensions of domains shown are as follows: 3.46 0.21 to 7.4 6 0.26 mm (TGN; eYFP::NtRISAP), 3.6 6 0.23 to 5.5 6 0.25 mm (F-actin fringe; lifeact::eYFP), 3.56 0.20 to 5.6 6 0.20 mm (F-actin fringe; eYFP::MTn), and 5.9 6 0.91 to 14.8 6 2.8 mm (subapical endocytic domain; AtAP180::eYFP). The statistical significance of differences between the average meridional dis-tances of proximal and distal ends (a, a9, b, b9, c, d, e, and f) of different PM domains were analyzed as indicated using ANOVA (Tukey’s test, one-way). Note that the distal end of the F-actin fringe (irrespective of the marker used) and the proximal end of the subapical endocytic domain are statistically significantly different (bc, b9c). *P # 0.05; **P # 0.01; ***P # 0.001; and ****P # 0.0001; ns, not significantly different (P. 0.05). Error bars 5SD.
fringe may be essential for pollen tube tip growth be-cause it is required for apical membrane recycling based on its function in maintaining the positioning of the subapical TGN compartment.
Mathematical Modeling of Steady-State Marker Distribution within the PM
To enhance our understanding of the distinct steady-state distribution patterns within the pollen tube PM, which are displayed by different markers for mem-brane traffic (Fig. 1, B and C), these distribution patterns were mathematically modeled based on a number of assumptions, which are discussed below and are largely derived from experimental data reported here. Some of these assumptions may be considered model-ing output, as they have emerged from the process of fitting the model to experimental data.
The model divides the PM into the following four regions, which are positioned at the indicated meridi-onal distances from the extreme apex: apical dome (0–3.5 mm), F-actin fringe region (3.5–5.5 mm), subapical region (5.5–15 mm), and shank (.15 mm). The posi-tioning of these regions emerged from modelfitting and is in close agreement with experimental data (Fig. 6). Four processes are modeled, which together determine marker dynamics and steady-state distribution within the PM. The extreme pollen tube apex is defined as a
reference point with afixed position. Consequently, all markers of membrane traffic within each of the four PM regions are subject to a constant retrogradeflux at the rate of pollen tube tip growth (process 1), which has been experimentally determined as discussed above (Supplemental Fig. S1). The density of individual markers can locally increase (source) or decrease (sink) within the PM as a result of cytoplasmic vesicle traffic (process 2). A source may result either from secretion or from local increase in TM protein marker density caused by selective endocytosis of lipid material. By contrast, a sink corresponds to endocytic internaliza-tion. In addition, diffusion within the PM (process 3) is expected to occur with marker- and region-specific co-efficients. Finally, fitting to experimental plots of marker distribution within the PM in the shank re-quired the model to account for marker degradation, which in the case of FM4-64 is overcompensated by ongoing PM staining by residual dye present in culture medium (process 4).
To compute distribution profiles of all analyzed markers within the PM, model equations were adjusted to account for different sets of the four processes in-troduced in the previous paragraph occurring in each of the four different regions of the pollen tube PM (Ta-ble 1). The F-actin fringe region, in which, apart from retrogradeflux, only diffusion is assumed to occur, is modeled such that it links the solutions of the equations describing marker distribution within the apical and Figure 7. Simultaneous time course analysis of
FM4-64 PM labeling and of noninvasively visu-alized F-actin structures in BFA-treated tobacco pollen tubes. Medial confocal optical sections through different representative pollen tubes transiently expressing the indicated noninvasive F-actin markers (Lifeact::eYFP or eYFP::MTn), which had been grown in the presence of FM4-64 (applied at 50mM in 200mL PTNT) for 30 min before the dye was washed out from the culture medium and BFA was applied for the indicated time period (70mMin 200mL PTNT). Lifeact::eYFP
or eYFP::MTn fusion proteins (green fluorescence, eYFP) and FM4-64 (red fluorescence, FM4-64) were simultaneously imaged in separate channels. As a result of the BFA treatment, tip growth of all analyzed pollen tubes was completely inhibited (Supplemental Fig. S8). During each of the indi-cated time periods, all imaged pollen tubes dis-played essentially the same FM4-64 PM labeling patterns (FM4-64) and very similar F-actin struc-tures (eYFP) labeled by one of the two noninvasive markers (Lifeact::eYFP [three independent exper-iments], n5 13 [0–20 min], 14 [21–40 min], or 13 [41–60 min]; eYFP::MTn [four independent ex-periments], n5 16 [0–20 min], 24 [21–40 min], or 14 [41–60 min]). Scale bar5 10 mm.
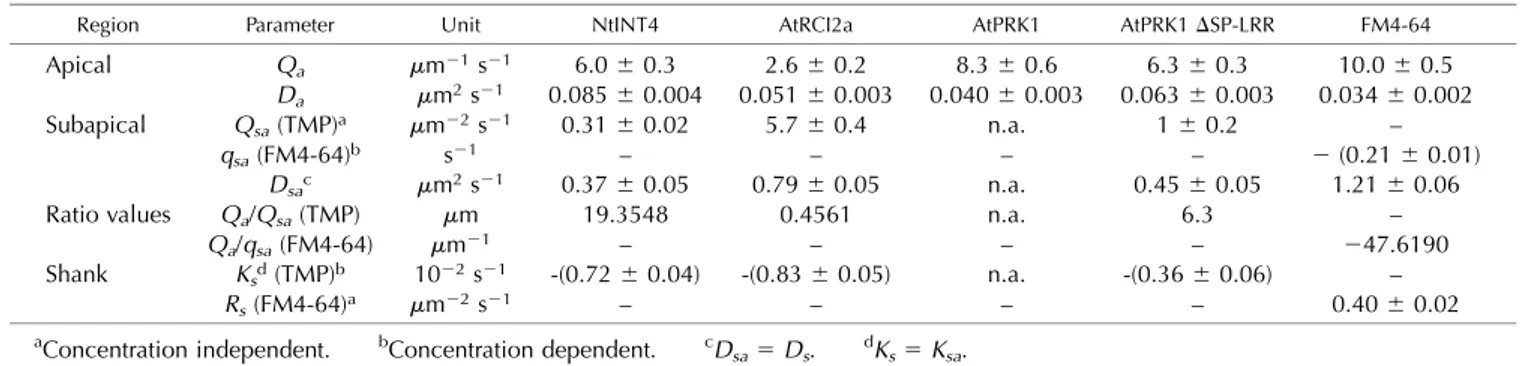
the subapical regions. Hence, within the F-actin fringe region, the diffusion coefficient of each marker un-dergoes transition between the apical and subapical values. No source or sink is assumed to be present in the shank region. Furthermore, the diffusion coefficients of all markers in the subapical region and in the shank are assumed equal. Marker degradation is also defined to occur at equal rates in the subapical region and in the shank but has been assigned the value zero in the apical region, in which degradation presumably is irrelevant compared to changes in marker density resulting from vesicle traffic. In addition, the model implicates that ongoing PM staining by residual FM4-64 is over-compensating degradation of this lipid dye in all PM regions and substantially contributes to its distribution profile only in the shank. The rates or coefficients of all processes other than retrogradeflux (Q, source; q, sink; D, diffusion; K, marker protein degradation; R, staining by residual FM4-64) are variables that can be read out after modelfitting (Table 2).
Tofit the model to experimental line plots displaying average intensity of PM-associated markerfluorescence (Fig. 1, B and C), these line plots needed to be normal-ized based on the values at the extreme apex, which were set to the intensity level“1” (Fig. 8, light blue line). Consequently, the Q, q, D, K, and R values read out for the different markers after model fitting (Table 2) are based on relative levels of PM-associated marker fluo-rescence but not on absolute marker density. For all analyzed markers, an excellentfit of the model (Fig. 8, brown line) to the experimental data were obtained, after the following marker-specific adjustments were made: (1) Because fitting the model to the AtPR-K1::eYFP line plot indicated a much stronger source of this marker within the apical dome (Qa) than in the subapical region (Qsa), Qsacould not be accurately de-termined and was defined to be zero (Qsa 5 0) for practical purposes. Hence, for AtPRK1::eYFP, only Qa and Da within the apical dome could be read out as independent values after model fitting (Table 2). (2) Furthermore, as the experimental NtINT4::eYFP dis-tribution plot displays a distinct kink at the border be-tween the apical dome and the F-actin fringe region (Figs. 1B and 8), the requirement for smoothness in the marker distributions at this border was removed from the model. (3) Finally, selective endocytosis of lipid
material within the subapical endocytic domain locally increases TM protein marker density with a rate that is independent of this density, whereas the rate of FM4-64 internalization resulting from the same process obvi-ously increases with higher dye concentrations within the PM. To model FM4-64 distribution within the sub-apical PM, the term qsac(x,t) was therefore employed instead of the constant Qsathat was used for TM protein modeling. By contrast, TM protein degradation occurs at a concentration-dependent rate, whereas the rate of ongoing PM staining by residual FM4-64 present in the culture medium is not affected by the dye concentration within the PM. Therefore, the term Kscðx; tÞ (equal to Ksa cðx; tÞ) was used to describe TM protein degradation, whereas the concentration-independent constant Rs was employed to represent membrane labeling by re-sidual FM4-64.
The possibility to obtain an excellentfit of the model to the experimental data (Fig. 8), along with the signs of the Qa, Qsa, and qsa values read out for all analyzed markers (Table 2), are consistent with and further support the following key experimentalfindings: (1) all markers of membrane traffic are incorporated into the PM as a consequence of secretion occurring within the apical dome (positive Qa values), and (2) FM4-64-la-beled PM material is endocytically recycled within the subapical region (negative qsa value), whereas TM protein markers are not (positive Qsavalues). Further-more, interactions of the extracellular LRR domain of AtPRK1 with the cell wall, which were proposed to contribute to the experimentally detected accumulation of this protein to highest levels within the apical dome (Fig. 1B), are supported by the observation that AtPRK1 displays the lowest Davalue (0.0406 0.003 mm2s21) of all TM protein markers tested, including a truncated form of this protein missing the extra cellular LRR do-main (0.0636 0.003 mm2s21; Table 2).
In addition, model output summarized in Table 2 allows a number of further interesting conclusions, which remain to be experimentally verified. It is not possible to directly compare absolute Qa, Qsa, or qsa values between markers, as experimental line plots were normalized for model fitting and because the correlation between marker fluorescence and density within the PM has not been quantified. Distinct Qsa values were therefore read out for different TM protein Table 1. Processes assumed by the model to substantially contribute to marker distribution profiles within the
indi-cated regions of the pollen tube PM (marked by “1”)
Region Retrograde Flux Source/Sink Diffusion
Marker Protein Degradation (K) Staining by Residual FM4-64 (R) (v0) (Q, q) (D) (K) (R) Apical (a) 1 1 1 — — F-actin fringe 1 — 1 — — Subapical (sa) 1 1 1 1 — Shank (s) 1 — 1 1 1
markers, although local enrichment of all these markers resulting from selective endocytosis of lipid material within the subapical region is expected to occur at the same rate. However, the Qa/Qsaor Qa/qsaratio, as well as D, K, and R values are not affected by data normal-ization and can be directly compared between markers. The particularly low Qa/Qsa ratio obtained for eYF-P::AtRCI2a (0.4561 mm; Table 2) indicates that this
protein is apically secreted at a low rate as compared to the rate of the accumulation of this protein within the subapical region, which is caused by selective endocy-tosis of lipid material. Together with relatively fast degradation in the shank (Ks5 20.83 6 0.05 1022s21; Table 2), this may explain the massive eYFP::AtRCI2a accumulation that is experimentally observed within the lateral PM. Furthermore, as discussed above, model Table 2. Readout after model fitting to experimental data
TMP, Transmembrane proteins. n.a., Not available.
Region Parameter Unit NtINT4 AtRCI2a AtPRK1 AtPRK1DSP-LRR FM4-64
Apical Qa mm21s21 6.06 0.3 2.66 0.2 8.36 0.6 6.36 0.3 10.06 0.5
Da mm2s21 0.0856 0.004 0.0516 0.003 0.0406 0.003 0.0636 0.003 0.0346 0.002
Subapical Qsa(TMP)a mm22s21 0.316 0.02 5.76 0.4 n.a. 16 0.2 –
qsa(FM4-64)b s21 – – – – 2 (0.21 6 0.01)
Dsac mm2s21 0.376 0.05 0.796 0.05 n.a. 0.456 0.05 1.216 0.06
Ratio values Qa/Qsa(TMP) mm 19.3548 0.4561 n.a. 6.3 –
Qa/qsa(FM4-64) mm21 – – – – 247.6190
Shank Ksd(TMP)b 1022s21 -(0.726 0.04) -(0.836 0.05) n.a. -(0.366 0.06) –
Rs(FM4-64)a mm22s21 – – – – 0.406 0.02
aConcentration independent. bConcentration dependent. cD
sa5 Ds. dKs5 Ksa.
Figure 8. Fitting of a mathematical model of steady-state marker distribu-tions within the pollen tube PM to ex-perimental data. The exex-perimental line plots depicted in light blue represent the steady-state distribution of the in-dicated markers for membrane traffic within the PM and show the average intensity of PM-associated marker flu-orescence at different meridional dis-tances from the extreme pollen tube apex. The same line plots are also presented in Figure 1, B and C, but are displayed here after normalization based on the values at the extreme apex (x5 1). The brown lines repre-sent output of a mathematical model of steady-state marker distribution de-scribed in detail in the text, after model fitting to the experimental line plots. The excellent fit obtained for all markers strongly supports model relevance. Table 2 summarizes model readout obtained after fitting, which provides information concerning the rate and spatial organization of cellular pro-cesses (including secretion, endocy-tosis, diffusion, and degeneration), which determine marker dynamics and steady-state distribution.