https://www.scirp.org/journal/am ISSN Online: 2152-7393
ISSN Print: 2152-7385
DOI: 10.4236/am.2020.1110062 Oct. 14, 2020 951 Applied Mathematics
The Mean Deviation from the Median of the
Dagum Distribution
Marin Claudia1 , Domenico Leogrande2, Fabio Manca1
1Department of Education, Psychology, Communication, University of Bari “Aldo Moro”, Bari, Italy 2Department of Economics, Management and Business Law, University of Bari “Aldo Moro”, Bari, Italy
Abstract
The Dagum model is particularly suitable for the analysis of the distributions of economic quantities, such as income, assets and consumption. The purpose of this note is to derive the expression of the mean deviation from the median of the Dagum distribution to study the behavior of the scale and shape parameters in terms of absolute variability and in terms of relative variability.
Keywords
Mean Deviation from the Median, Dagum Distribution, Scale and Shape Parameters
1. Introduction
Camilo Dagum in 1977 introduced a new distribution model particularly suited to describe the personal distribution of income. This model, in fact, thanks to the presence of a greater number of parameters (4 in the more general version) than other models, proves to be particularly flexible and adaptable to describe even deeply dissimilar income distributions (Dagum, 1977) [1]. For this model Dagum had obtained the main characteristic values (mean, mode, median, va-riance, moments, Lorenz curve and concentration ratio). The Dagum distribu-tion has been studied by several authors that have proposed several variadistribu-tions to increase the flexibility of the Dagum distribution in modeling lifetime data. Some recent modifications concern log-Dagum distribution (Domma and Perri, 2009) [2], Mc-Dagum distribution (Oluyede and Rajasoorya, 2013) [3], be-ta-Dagum distribution (Domma and Condino, 2013) [4], gamma-Dagum dis-tribution (Oluyede et al., 2014) [5], weighted Dagum distribution (Oluyede and Ye, 2014) [6], exponentiated Kumaraswamy-Dagum distribution (Huang and
How to cite this paper: Claudia, M., Leogrande, D. and Manca, F. (2020) The Mean Deviation from the Median of the Dagum Distribution. Applied Mathematics, 11, 951-956.
https://doi.org/10.4236/am.2020.1110062
Received: September 9, 2020 Accepted: October 11, 2020 Published: October 14, 2020 Copyright © 2020 by author(s) and Scientific Research Publishing Inc. This work is licensed under the Creative Commons Attribution International License (CC BY 4.0).
http://creativecommons.org/licenses/by/4.0/ Open Access
DOI:10.4236/am.2020.1110062 952 Applied Mathematics
Oloyede, 2014) [7], transmuted Dagum distribution (Elbatal and Aryal, 2015)
[8], extended Dagum distribution (Silva et al., 2015) [9] and Dagum-Poisson distribution (Oluyede et al., 2016) [10], exponentiated generalized exponential Dagum distribution (Nasiru et al., 2019) [11], moreover, regarding properties and methods of estimation of the parameters of the Dagum distribution. Dom-ma et al. (2011a [12], 2011b [13]) determined the observed information matrix in right censored samples and debated aspects of the maximum likelihood esti-mation for censored data. In the 2013 Shahzad and Asghar [14] obtained the L-moments and TL-moments in closed form to estimate the parameters of the Dagum distribution. Al-Zahrani (2016) [15] proposed a reliability test plan un-der the assumption that the life of a product follows a Dagum distribution. Dey et al. (2017) [16] studied the properties and different methods of estimating the parameters of the Dagum distribution.
2. Dagum Distribution
Girone and Viola (2009) [17] and Girone (2010) [18] obtained the expression of the mean difference and the mean deviation. It is very important to underline that the mean deviation from the median is invariant with respect to translations and it is homogeneous to the variable. Therefore, without losing generality, we can consider the density function with only one shape parameters
( )
( 1)(
)
( 1)1 , 0 ,
f x =βδx− +δ +x−δ −β+ < < ∞x
and the distribution function
( )
(
1)
.F x = +x−δ −β
The mean value and the median of this distribution are:
(
1 ,1 1)
, B µ β= β+ δ − δ(
)
1 1 2 1 . Me= β − − δ3. The Mean Deviation from the Median
The formula of the mean deviation from the median is:
( )
d .Me
S =
∫
−∞∞ x−Me f x xA formula that avoids the absolute value and that splits the calculation into two parts is:
(
) ( )
d(
) ( )
d ;Me
Me Me
S =
∫
−∞ Me−x f x x+∫
∞ x−Me f x xthe above formula represents the first attempt in simplifying the calculations. After simple steps, the formula becomes
( )
d( )
d( )
d( )
d , Me Me Me Me Me S Me f x x xf x x ∞ xf x x Me ∞ f x x −∞ −∞ =∫
−∫
+∫
−∫
for-DOI:10.4236/am.2020.1110062 953 Applied Mathematics mula
( )
d Me( )
d , Me Me S ∞ xf x x xf x x −∞ =∫
−∫
formula that can be simplified taking into account that
( )
d Me( )
d( )
d , Mexf x x xf x x xf x x µ ∞ ∞ −∞ −∞ − = =∫
∫
∫
and that allows to obtain
( )
2 Me d .
Me
S = −µ
∫
−∞xf x xThen we have to calculate the only integral present in the formula of the mean deviation from the median considering that, in our case, the Dagum density function starts from 0. With the aid of the Mathematica software we obtain a very heavy expression of the integral that, however, after a few steps can be sim-plified into the following formula:
( )
(
)
(
)
(
)
1 1 2 1 1 0 1 1 ,1 ,1 ,1 1 , 2 1 d 1 2 1 Me F xf x x β β δ β βδ β δ β β β δ βδ − + + + + + + − − = + −∫
and then the formula of the mean deviation from the median in the Dagum model results:
(
)
(
)
( )(
)
1 1 2 1 1 1 1 ,1 ,1 ,1 1 , 2 1 1 2 1 1 ,1 1 2 F Me S B β β δ β βδ β δ β β β δ βδ β β δ δ − + + + + + + − − + − = + − −an expression that cannot be simplified but that, for some values of β and δ, gives more compact results.
4. Expressions of the Mean Deviation from the Median for
Some Values of δ and β
In this paragraph the expressions of the mean deviation from the median are given for some values of δ and β.
For δ = and 2 β =1 SMe = , 1
for δ = and 2 β =2 1 5 3 3arccot 1 2
2 2 4
Me
S = + + π− − + ,
for δ = and 3 β =1 1 2 log 2 3
Me
S = − ,
for δ = and 4 β =1 1
(
4 2 log 2 2 2 log 2 2)
4Me
S = + − − + .
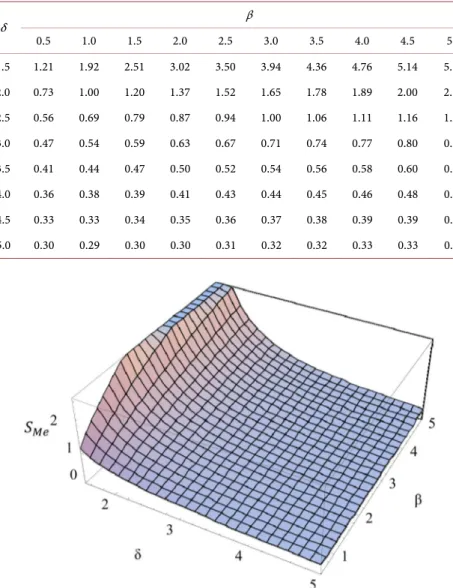
Table 1 shows the mean deviation from the median values for some values of δ and β. The same and other values are shown in Figure 1.
The values shown in Table 1 represent the single values assumed by the mean deviation from the median, obtained by crossing some values assumed by the δ parameter and the β parameter.
With δ is equal to 1.5, the mean deviation from the median is 1.21 when β is 0.5 and, as β increases until it reaches 5.0, the mean deviation from the median
DOI:10.4236/am.2020.1110062 954 Applied Mathematics Table 1. Values of the mean deviation from the median for some values of δ and β.
δ β 0.5 1.0 1.5 2.0 2.5 3.0 3.5 4.0 4.5 5.0 1.5 1.21 1.92 2.51 3.02 3.50 3.94 4.36 4.76 5.14 5.51 2.0 0.73 1.00 1.20 1.37 1.52 1.65 1.78 1.89 2.00 2.11 2.5 0.56 0.69 0.79 0.87 0.94 1.00 1.06 1.11 1.16 1.21 3.0 0.47 0.54 0.59 0.63 0.67 0.71 0.74 0.77 0.80 0.82 3.5 0.41 0.44 0.47 0.50 0.52 0.54 0.56 0.58 0.60 0.61 4.0 0.36 0.38 0.39 0.41 0.43 0.44 0.45 0.46 0.48 0.49 4.5 0.33 0.33 0.34 0.35 0.36 0.37 0.38 0.39 0.39 0.40 5.0 0.30 0.29 0.30 0.30 0.31 0.32 0.32 0.33 0.33 0.34
Figure 1. Graphical representation of the mean deviation from the median.
increases until 5.51. With δ is equal to 2.0, the mean deviation from the median is 0.73 when β is 0.5 and, as β increases until it reaches 5.0, the mean deviation from the median increases until 2.11. With δ is equal to 2.5, the mean deviation from the median is 0.56 when β is 0.5 and, as β increases until it reaches 5.0, the mean deviation from the median increases until 1.21. With δ is equal to 3.0, the mean deviation from the median is 0.47 when β is 0.5 and, as β increases until it reaches 5.0, the mean deviation from the median increases until 0.82. With δ is equal to 3.5, the mean deviation from the median is 0.41 when β is 0.5 and, as β increases until it reaches 5.0, the mean deviation from the median increases until 0.61. With δ is equal to 4.0, the mean deviation from the median is 0.36 when β is 0.5 and, as β increases until it reaches 5.0, the mean deviation from the median increases until 0.49. With δ is equal to 4.5, the mean deviation from the median is 0.33 when β is 0.5 and, as β increases until it reaches 5.0, the mean deviation from the median increases until 0.40. Finally with δ is equal to 5.0, the mean
DOI:10.4236/am.2020.1110062 955 Applied Mathematics
deviation from the median is 0.30 when β is 0.5 and, as β increases until it reaches 5.0, the mean deviation from the median increases until 0.34.
So we can state that the mean deviation from the median decreases as δ in-creases, but increases as β increases.
The values shown in Table 1 are displayed in Figure 1. And this graph allows us to have a visual perception of the trend of the mean deviation from the me-dian at the values of δ and β.
As it can be seen, the mean deviation from the median seems to increase as β increases and decrease as δ increases; moreover, it increases as the scale parame-ter λ increases.
5. Conclusion
In this paper an explicit and compact expression of the mean deviation from the median for the distribution of Dagum was obtained. This expression allows us to examine, with great evidence, the behavior of the scale and shape parameters in terms of absolute variability and in terms of relative variability.
Conflicts of Interest
The authors declare no conflicts of interest regarding the publication of this paper.
References
[1] Dagum, C. (1977) A New Model of Personal Income Distribution: Specification and Estimation. Economie Appliquée, 30, 413-436.
[2] Domma, F. and Perri, P.F. (2009) Some Developments on the Log-Dagum Distribu-tion. Statistical Methods and Applications, 18, 205-209.
https://doi.org/10.1007/s10260-007-0091-3
[3] Oluyede, B.O. and Rajasooriya, S. (2013) The Mc-Dagum Distribution and Its Sta-tistical Properties with Applications. Asian Journal of Mathematics and Applica-tions, 2013, ama0085.
[4] Domma, F. and Condino, F. (2013) The Beta-Dagum Distribution: Definition and Properties. Communication in Statistics—Theory and Methods, 42, 4070-4090.
https://doi.org/10.1080/03610926.2011.647219
[5] Oluyede, B.O., Huang, S. and Pararai, M. (2014) A New Generalized Dagum Dis-tribution with Applications to Income and Lifetime Data. Journal of Statistical and Econometric Methods, 3, 125-151.
[6] Oluyede, B.O. and Ye, Y. (2014) Weighted Dagum and Related Distributions. Afrika Matematika, 25, 1125-1141.https://doi.org/10.1007/s13370-013-0176-0
[7] Huang, S. and Oluyede, B.O. (2014) Exponentiated Kumaraswamy-Dagum Distri-bution with Applications to Income and Lifetime Data. Journal of Statistical Distri-bution and Application, 1, 1-20.https://doi.org/10.1186/2195-5832-1-8
[8] Elbatal, I. and Aryal, G. (2015) Transmuted Dagum Distribution with Applications.
Chilean Journal of Statistics, 6, 31-45.
[9] Silva, A., da Silva, L.C.M. and Cordeiro, G.M. (2015) The Extended Dagum Distri-bution: Properties and Application. Journal of Data Science, 13, 53-72.
DOI:10.4236/am.2020.1110062 956 Applied Mathematics
[10] Oluyede, B.O., Motsewabagale, G., Huang, S., Warahena-Liyanage, G. and Pararai, M. (2016) The Dagum-Poisson Distribution: Model, Properties and Application.
Electronic Journal of Applied Statistical Analysis, 9, 169-197.
[11] Nasiru, S., Mwita, P.N. and Ngesa, O. (2019) Exponentiated Generalized Exponen-tial Dagum Distribution. Journal of King Saud University—Science, 31, 362-371.
https://doi.org/10.1016/j.jksus.2017.09.009
[12] Domma, F., Giordano, S. and Zenga, M. (2011) The Fisher Information Matrix in Right Censored Samples from the Dagum Distribution. Working Paper No. 8, De-partment of Economics and Statistics, University of Calabria, Calabria.
[13] Domma, F., Giordano, S. and Zenga, M. (2011) Maximum Likelihood Estimation in Dagum Distribution with Censored Samples. Journal of Applied Statistics, 38, 2971-2985.https://doi.org/10.1080/02664763.2011.578613
[14] Shahzad, M.N. and Ashgar, Z. (2013) Comparing TL-Moments, L-Moments and Conventional Moments of Dagum Distribution by Simulated Data. Revista Colom-biana de Estadìstica, 36, 79-93.
[15] Al-Zahrani, B. (2016) Reliability Test Plan Based on Dagum Distribution. Interna-tional Journal of Advanced Statistics and Probability, 4, 75-78.
https://doi.org/10.14419/ijasp.v4i1.6165
[16] Dey, S., Al-Zahrani, B. and Basloom, S. (2017) Dagum Distribution: Properties and Different Methods of Estimation. International Journal of Advanced Statistics and Probability, 6, 74-92.https://doi.org/10.5539/ijsp.v6n2p74
[17] Girone, G. and Viola, D. (2009) La differenza media della distribuzione di Dagum. Annali del Dipartimento di Scienze statistiche dell’Università di Bari, Vol. VIII. [18] Girone, G. (2010) Lo scarto semplice medio della distribuzione di Dagum, in Studi