Workload measurement for molecular
genetics laboratory: A survey study
Enrico Tagliafico1,2*, Isabella Bernardis1,2, Marina Grasso3, Maria Rosaria D’Apice4,
Cristina Lapucci5, Annalisa Botta6, Daniela Francesca Giachino7,8, Maria Marinelli9, Paola Primignani10, Silvia Russo11, Ilaria Sani12, Manuela Seia13, Sergio Fini14,
Paola Rimessi14, Elena Tenedini1,2, Anna Ravani14, Maurizio Genuardi15,
Alessandra FerliniID14*, on behalf of the Molecular Genetics Working Group of the Italian
Society of Human Genetics, SIGU¶
1 Center for Genome Research, University of Modena and Reggio Emilia, Modena, Italy, 2 Department of Medical and Surgical Sciences, University of Modena ad Reggio Emilia, Modena, Italy, 3 Laboratory of Human Genetics, Galliera Hospital, Genoa, Italy, 4 Medical Genetics Laboratory, Tor Vergata Hospital, Rome, Italy, 5 Medical Genetics and Molecular Biology Unit, Synlab Italy, Brescia, Italy, 6 Dept. Biomedicine and Prevention, Medical Genetics Section, Tor Vergata University of Rome, Rome, Italy, 7 Medical Genetics, University of Torino, Dept. Clinical &Biological Sciences, Torino, Italy, 8 Medical Genetics, San Luigi University Hospital, Orbassano, Italy, 9 Genetics Laboratory Unit, Department of Obstetrics and Pediatrics, AUSL-IRCCS of Reggio Emilia, Reggio Emilia, Italy, 10 Department of Laboratory Medicine, Medical Genetics, Niguarda Ca’ Granda Hospital, Milan, Italy, 11 Cytogenetics and Molecular Genetics Laboratory, Istituto Auxologico Italiano, I.R.C.C.S., Milan, Italy, 12 Genetica Medica—AOU "A. Meyer" di Firenze, Florence, Italy, 13 Medical Genetics Laboratory; Fondazione IRCCS Ca’ Granda Ospedale Maggiore Policlinico, Milan, Italy, 14 Unit of Medical Genetics Unit, Department of Medical Sciences, University of Ferrara, Ferrara, Italy, 15 Istituto di Medicina Genomica, UniversitàCattolica Del Sacro Cuore, Fondazione Policlinico Universitario A. Gemelli, Rome, Italy
¶ The complete membership of the Molecular Genetics Working Group of the Italian Society of Human Genetics, SIGU can be found in the Acknowledgments section.
*[email protected](AF);[email protected](ET)
Abstract
Genetic testing availability in the health care system is rapidly increasing, along with the dif-fusion of next-generation sequencing (NGS) into diagnostics. These issues make impera-tive the knowledge-drive optimization of testing in the clinical setting. Time estimations of wet laboratory procedure in Italian molecular laboratories offering genetic diagnosis were evaluated to provide data suitable to adjust efficiency and optimize health policies and costs. A survey was undertaken by the Italian Society of Human Genetics (SIGU). Forty-two laboratories participated. For most molecular techniques, the most time-consuming steps are those requiring an intensive manual intervention or in which the human bias can affect the global process time-performances. For NGS, for which the study surveyed also the inter-pretation time, the latter represented the step that requiring longer times. We report the first survey describing the hands-on times requested for different molecular diagnostics proce-dures, including NGS. The analysis of this survey suggests the need of some improvements to optimize some analytical processes, such as the implementation of laboratory information management systems to minimize manual procedures in pre-analytical steps which may affect accuracy that represents the major challenge to be faced in the future setting of molecular genetics laboratory.
a1111111111 a1111111111 a1111111111 a1111111111 a1111111111 OPEN ACCESS
Citation: Tagliafico E, Bernardis I, Grasso M,
D’Apice MR, Lapucci C, Botta A, et al. (2018) Workload measurement for molecular genetics laboratory: A survey study. PLoS ONE 13(11): e0206855.https://doi.org/10.1371/journal. pone.0206855
Editor: Alvaro Galli, CNR, ITALY Received: May 11, 2018 Accepted: October 19, 2018 Published: November 27, 2018
Copyright:© 2018 Tagliafico et al. This is an open access article distributed under the terms of the
Creative Commons Attribution License, which permits unrestricted use, distribution, and reproduction in any medium, provided the original author and source are credited.
Data Availability Statement: All relevant data are
within the paper and its Supporting Information files.
Funding: Funding was provided by Programma di
ricerca Regione-Università "Next-generation sequencing and gene therapy to diagnose and cure rare diseases in Regione Emilia Romagna (RARER)" - Area1, Strategic Programmes (grant number E35E09000880002) to AF. Synlab Italy provided support in the form of salaries for author CL, but did not have any additional role in the study design, data collection and analysis, decision to
Introduction
New technologies in genomics are changing clinical practice, increasing the volume of genetic testing and, consequently, healthcare spending. Besides, the evolution of knowledge in geno-mics and in medical genetics has also elicited the need for accurate estimation of the cost impact of genetic testing on healthcare system in relation to clinical utility. In fact, with the rapid diffusion of next-generation DNA sequencing technologies into diagnostics, and the dra-matic drop down of the cost of sequencing, genomics has started to pervade health care in the area of traditional genetic diseases as well as across the entire medical field, from preconcep-tion to aging.
Therefore, detailed knowledge of genetic testing costs, are mandatory to design efficient and optimized health policies in the near future.
Estimates of laboratory workload have been reported for some laboratory specialties, including microbiology [1], pathology and laboratory medicine [2]. Several documents on both clinical and laboratory workloads are present on the web (https://www.cap-acp.org/ wkload.php).
In the medical genetics field, estimates have been undertaken for genetic counselling activi-ties and cytogenetic diagnosis [3]. A time analysis of clinical workload linked to molecular genetic testing has been performed more than 20 years ago [4]. Sixteen Canadian genetic ser-vices were surveyed, and the following median times were calculated: 60 minutes for standard counselling, 15 minutes for follow up face to face consultation (case review), 10 minutes for a phone discussion, and 15 minutes each for letter, intermediate report and specimen set up. Molecular test interpretation was 10 minutes. Times were highly variable, depending on dis-ease inheritance and on the number of clinical actions required.
More recently, Heald et al.[5] proposed that workload might be better articulated depend-ing on the type of clinical service offered. They therefore calculated workload for general coun-selling, as well as for counselling related to cancer, cardiovascular, and prenatal genetic activities. They also concluded that non-clinical activities should be transferred to supporting staff (hospital technicians, nurses). Great variety in time measurements was observed for mini-mum total time spent, first or second counseling sessions, and general versus specific
counselling.
Obviously, workload measurements are helpful if not necessary for predicting clinical resources, hospital staffing and personnel enrollment.
Molecular laboratory workload was briefly considered by Susan Steinhouse (https://ukgtn. nhs.uk/fileadmin/_migrated/tt_news/news_files/RCPath_article_MolUs.pdf), who described and commented on the UK National External Quality Assessment Service (NEQAS) for Molecular Genetics activities. Participating laboratories were asked to assign workload to the EQA cases. The output of this study showed significant differences across laboratories. “Work-load units”, equating to one minute of laboratory work, were used for the measurements. This approach might be rather complex when many techniques (DNA extraction, PCR, sequencing, MLPA, genotyping, also counting the number of amplicons) are monitored.
The Italian Society of Human Genetics (SIGU) has a robust experience in collecting data and activities of the Italian Medical Genetic Services in order to describe the Medical Genetics national scenario. The last survey of medical genetic services in Italy was reported by Giardino et al. providing an overview of the activities over a 4-year period [6].
We surveyed the time workload related to the laboratory techniques routinely used for molecular testing including next generation sequencing (NGS). In particular, this is the first study providing this type of information for NGS procedures. The purpose was to provide time estimates of wet laboratory procedures in Italian molecular laboratories offering genetic
Laboratory hands-on-time in molecular diagnostics
publish, or preparation of the manuscript. The specific role of this author is articulated in the ‘author contributions’ section.
Competing interests: We have the following
interests. Cristina Lapucci is employed by Synlab Italy. There are no patents, products in
development or marketed products to declare. This does not alter our adherence to all the PLOS ONE policies on sharing data and materials, as detailed online in the guide for authors.
diagnosis. Here we show the results, interpretation and considerations derived from this sur-vey, highlighting the importance, specificity and peculiarity of diagnostic-oriented molecular laboratory activity and underlying how to improve genetic testing productivity, in line with the current requirements of public health.
Materials and methods
A survey was launched by the Molecular Genetics Working Group via the Italian Society of Human Genetics (SIGU). The survey was addressed to all members affiliated with SIGU society. No specific criteria were applied for laboratory selection. Two different questionnaires were pre-pared: Survey A, containing 55 questions, was designed to gather information about workloads and hands-on times for standard basic molecular techniques, while survey B, including 41 ques-tions, was focused on Next-Generation Sequencing (NGS). A total of 42 laboratories partici-pated in survey A, while survey B was restricted to 18 laboratories performing NGS analyses. Data collected included number and type of processed analyses with average hands-on times for different ranges of sample size workloads. Workload was examined for all molecular genetics procedures performed nationwide to diagnose genetic diseases. The following tech-niques were surveyed considering the hands-on-time for the manual procedures, even if requested by automated protocols: Nucleic Acid Extraction, PCR, Reverse dot blot, Multiplex Ligation-dependent Probe Amplification (MLPA), Sanger sequencing, NGS sequencing (gene panels and exomes). For these techniques hands-on-time for each step of the analysis protocol were considered and evaluated.
Data from responding laboratories were collected and analyzed using R statistical package (matrixStats, doBy, ggplot2). For each question, the analyses were performed only if responses were available from a minimum of two laboratories. Time-sample calculations were per-formed considering different ranges of sample size workflows, and an average sample size workflow was estimated. Extreme outlier time values (lower/upper quartile±3�IQ; IQ: inter-quartile range) were discarded from statistical analysis.
This study did not require any ethical approval, since no human subjects or human biologi-cal material were used, and only the techniques and laboratory methods were analyzed. Conse-quently no informed consent from patients was taken within the study. All original material is supplied and can be downloaded as supplementary files: Survey modules: SURVEY A module English (S1 Survey), SURVEY A module original language (S2 Survey), SURVEY B module original language (S3 Survey) along with a translated copy of guidelines to complete survey (S1 File), and Survey raw data: SURVEY A Raw Data (S4 Survey), SURVEY B module and Raw Data English (S5 Survey)
Results
The number of laboratories that returned questionnaires for Survey A and Survey B are 39 and 18, respectively. Among the laboratories that answered Survey A, 67% (n = 26) reported using NGS, 57.6% of which (n = 15) filled-out also Survey B. Three laboratories returned Survey B only. Overall, response was obtained from 42 different laboratories (24 Survey A, 15 Survey A and B, 3 Survey B). Considering the geographic distribution of responding laboratories, North and Central Italy are the most represented regions, with a north-to-south decreasing gradient already observed in previous studies [6]: 57.1% and 28.6% of laboratories are located in the Northern and Central regions, respectively, compared to 14.3% in the Southern regions. Of the 42 responding laboratories, 31% are affiliated with university hospitals, 31% with public (16.7%) or private (14.3%) research hospitals, 14.3% with public hospitals and 11.9% with uni-versities. Private laboratories accounted for the remaining 7.1%.
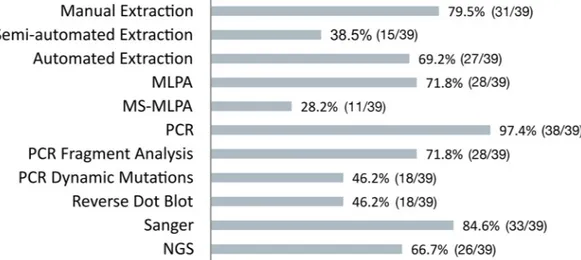
All responding laboratories reported information for each molecular activity.Fig 1shows the fractions of labs performing each activity.
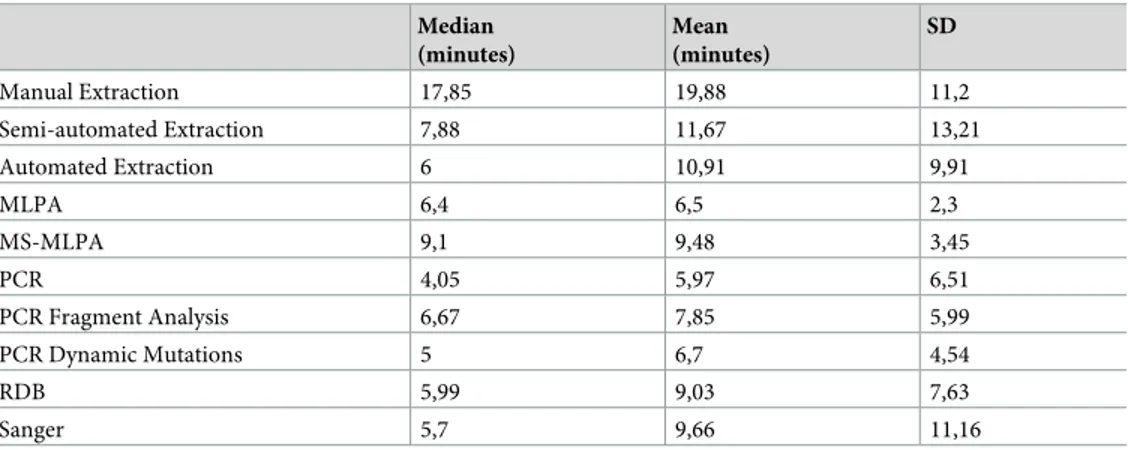
The summary of results of the data analysis of hands on times for the different molecular techniques considering an average workload are shown inFig 2and inTable 1. Sample DNA extraction analyses showed the greatest hands-on times, with also the greatest variation across laboratories for manual extraction (range 3–55 minutes/sample), suggesting, when compared with semi-automated and automated extraction (range 4–27 and 2–35 respectively) that these Fig 1. Fractions of labs performing each molecular procedure. Number (out of total) and percentage of labs performing
each analytical procedure and who have completed the corresponding questionnaire sheets.
https://doi.org/10.1371/journal.pone.0206855.g001
Fig 2. Hands-on times for each molecular procedure. Hands-on times for the molecular techniques surveyed. An average sample workload is considered. In box plots,
center lines show the medians; box limits indicate the 25th and 75th percentiles as determined by R software; whiskers extend 1.5 times the interquartile range from the 25th and 75th percentiles, outliers are represented by dots. With regard to DNA extraction, "manual" refers to a basic technique that does not use kits and/or automation (e.g. Phenol-Chloroform); "semi-automated" refers to protocols in which commercial DNA extraction kits are used with simplified workflows, but no pipetting automation equipment is used; "automated" refers to a fully automated protocols implemented on liquid handlers platforms (e.g. Promega Maxwell, Qiagen QIASymphony etc.).
https://doi.org/10.1371/journal.pone.0206855.g002
analyses are heavily operator- and method-dependent (differences in extraction methods have not been taken into account for hands-on times measurements).
As expected, for all procedures hands-on times per sample decreased with increasing sam-ple size (S1 Fig) [7].
Interestingly, when analytical steps were considered, for the large majority of molecular techniques, the most time-consuming steps are those that require an intensive manual inter-vention or in which the human bias can affect the yield in terms of time such as the pre-analyt-ical phase, the preparation of daily worksheets and the reaction setup of the analytpre-analyt-ical session (Fig 3).
With regard to NGS, the responding laboratories reported workloads ranging between 20 and 300 samples/month (mean 90.05, median 55, SD 89.10). 66.6% of laboratories use an Illu-mina platform (IlluIllu-mina Inc., San Diego, CA, USA (41%of them have both MiSeq and Next-Seq/HiSeq) while 33.3% an Ion Torrent platform (Thermo Fisher Scientific Inc. Waltham, MA USA); 11% of laboratories use both Illumina and Ion Torrent platforms.
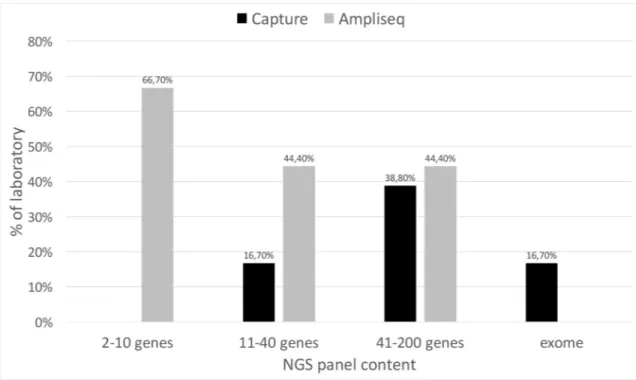
Fig 4shows the distribution of amplicon-based and capture-based strategies for target enrichment according to gene panel size. Overall, the amplicon-based technology is preferred to capture, mainly for small gene panels. Automated workflows were used by only one labora-tory and 1/3 of the laboratories for capture-based target and amplicon-based target enrich-ment, respectively (data not shown).
The results of the data analysis of hands-on times for NGS are reported inFig 5. Panel A and B show the hands-on times for amplicon- and capture-based technologies, respectively.
As expected, the most time-consuming step in the NGS analysis workflow is test interpreta-tion. The time increases with the number of genes tested with an average of 1.6 hours
requested for analyzing panels of 2–10 genes, 1.9 hours for 11–40 genes, 2.8 hours for 41–200 genes, and 6 hours for exomes (Fig 5C).
With regard to NGS data analysis pipelines, for small gene panels, the majority of laborato-ries use the software provided by the NGS platform, or in-house pipelines, whereas 30% use commercial software; for large panels and exomes, the implementation of in-house pipelines becomes predominant (80–100%). For data interpretation, in-house pipelines are the most used for intermediate gene panels (70–80%), whereas the use of commercial software increases with panel size (up to 50%), reflecting the need of additional tools for the interpretation of more complex and bigger amounts of data.
Table 1. Hands-on times for each molecular procedure. Hands-on times for the different molecular techniques
con-sidering an average. Median (minutes) Mean (minutes) SD Manual Extraction 17,85 19,88 11,2 Semi-automated Extraction 7,88 11,67 13,21 Automated Extraction 6 10,91 9,91 MLPA 6,4 6,5 2,3 MS-MLPA 9,1 9,48 3,45 PCR 4,05 5,97 6,51 PCR Fragment Analysis 6,67 7,85 5,99 PCR Dynamic Mutations 5 6,7 4,54 RDB 5,99 9,03 7,63 Sanger 5,7 9,66 11,16
Hands-on times for the molecular techniques surveyed. Median, Mean and Standard deviation are reported.
Discussion
Molecular genetic diagnostic testing has become increasingly sophisticated during the last few years, mainly due to the breakthrough of genome and exome sequencing technologies. These play an increasingly important role in for highly penetrant diseases and cancer, allowing faster and more precise diagnosis, carrier testing of inherited disorders, family planning, and choice and monitoring of personalized therapies. Therefore, molecular genetic testing and clinical genomics represents one of the most powerful instruments in the personalized medicine era [8]. At the same time, molecular genetic laboratories must ensure high quality performances Fig 3. Hands-on times for each step of molecular procedure. Hands-on times for the different analytical steps of the molecular techniques surveyed. An average
sample workload is considered. In box plots, center lines show the medians; box limits indicate the 25th and 75th percentiles as determined by R software; whiskers extend 1.5 times the interquartile range from the 25th and 75th percentiles, outliers are represented by dots.
https://doi.org/10.1371/journal.pone.0206855.g003
taking into account health-care provider requirements and patient management, numbers and types of biological samples, key challenges for each genetic/genomic technology, reporting turnaround times, optimization of working conditions for laboratory, and post-testing patient caring medical teams.
Management-engineering methods have been successfully applied to healthcare domains, such as clinical chemistry laboratories or clinical units/departments, using process design models to impact on those contexts. So far, these approaches have not been systematically applied to molecular genetics or clinical genomics laboratories. Therefore, there is a need to understand the peculiarities of the molecular genetics laboratories and the kind of tools and best practices that could be applied to improve this setting.
In order to fill in these gaps, we have undertaken the first survey describing the times requested for different molecular diagnostics procedures. The results obtained provide the grounds for an in-depth analysis of the operational workflows of molecular genetics laboratories.
Molecular genetics diagnostic testing is the translational output of research procedures and, even if it has become increasingly sophisticated, it has not yet reached the process optimization standards that are specific of high throughput laboratories, such as clinical chemistry laborato-ries. This survey allows some considerations that might be useful to optimize some analytical processes.
Our data strongly suggest that, for the large majority of molecular techniques, the highly time-demanding operations are those that require greater manual intervention or in which the human bias can affect the global process time-performances such as pre-analytical steps, and setup of the analytical sessions. For all laboratory procedures, the pre-analytical phase is cur-rently considered as the weakest part of the testing process because of its effect on the global quality of the final results.
Fig 4. NGS strategies for target enrichment. Percentage of laboratory adopting the different strategies for target enrichment
according to gene panel size.
Moreover, the analysis of the times used in basic procedures (i.e. nucleic acid extraction and quality control along with sample acceptance and codification) suggests that their centrali-zation, along with automation in shared work-units could help to implement efficiency and reduce personnel costs for these processes. In addition, these could be shared between labora-tories working on nucleic acids, including microbiology/virology and pathology labs.
Laboratory automation is also relevant for its impact on the global quality of results, as it drastically reduces errors. In our study, we investigated the use of automated procedures for both standard molecular biology techniques and NGS. Automated DNA extraction was used by 69% of the laboratories. Conversely, in NGS procedures only one laboratory applied an automated workflow for capture-based target enrichment, just 1/3 of laboratories use automa-tion for amplicon-based target enrichment and just 3 laboratories use automated liquid han-dling workstations for standard molecular biology procedures. We found that automated DNA extraction requires much shorter times, as expected. A similar tendency can be observed Fig 5. Hands-on times for NGS strategies. Hands-on times for NGS strategies. Panel A and B: amplicon- (A) and capture- (B) based technologies, considering library
preparation, run set-up and raw data processing. Panel C: data interpretation. In box plots, center lines show the medians; box limits indicate the 25th and 75th percentiles as determined by R software; whiskers extend 1.5 times the interquartile range from the 25th and 75th percentiles, outliers are represented by dots.
https://doi.org/10.1371/journal.pone.0206855.g005
for standard molecular biology procedures and for NGS library preparation, although the number of responding laboratories is too low to draw definite conclusions. These data support again the need to centralize these procedures in order to optimize scale economy and operator related timing.
However, in order to globally improve laboratory automation and management, more efforts should be undertaken also by tech companies to adapt molecular genetics/genomics equipment to management engineering standards that are appropriate to other types of labs. Most of the instrumentation (especially those for NGS) cannot be interfaced with laboratory management systems (LIMS), thus still precluding the implementation of a complete automa-tion process.
A result that deserves a possible further analysis comes from the percentages of use of each single molecular method. Virtually all laboratories perform, as expected, basic techniques. Interestingly, Sanger sequencing is performed by the 84.6% of responding laboratories (Fig 1) This shows on one hand that despite the fact that NGS is gaining ever-wider spaces in molecu-lar diagnostics, Sanger sequencing still remains a key technology in molecumolecu-lar testing. Many are the reasons why this occurs. Indeed, some clinically well-defined conditions still require the targeted analysis (single gene diagnosis) of very limited portion of DNA sequence (i.e hemoglobinopathies/thalassemias or connexin-26-related hearing loss characterization) These are frequent Mendelian diseases due to mutations in small genes easily diagnosed by direct sequencing. In addition, Sanger is still appropriate for mutation screening in families where the genetic defect is known. Noteworthy, almost all guidelines for clinical NGS still require the Sanger validation of pathological variants.
Finally, prenatal diagnosis of Mendelian conditions is largely based on Sanger sequencing since causative mutations are already known but also when an urgent, not postponed, prenatal testing is needed (late pregnancy testing). As soon as noninvasive prenatal testing (NIPT) will be completely set up also for known Mendelian diseases, the usage of Sanger methods will be probably, at least for prenatal testing, reduced. It should be however underlined that the 15.6% of responding laboratories in our survey do not perform Sanger sequencing.
As far as the NGS is concerned, the survey shows that small gene panels are the main NGS approach for the investigation of genetic diseases. Recent analyses show an advantage in cost and in diagnostic power of whole genome sequencing (WGS) [9]and/or whole exome sequencing (WES) [10]compared to targeted sequencing using small gene panels. Despite the low number of responding laboratories, our results on WES analyses show that, as expected, working times are considerably higher compared to panel testing, mainly, though not only, due to longer times required for variant interpretation.
Indeed, our data show that, for all NGS strategies, the most time-consuming step in the NGS analysis workflow is variant interpretation. The costs of sequencing are decreasing very rapidly, faster than Moore’s law (Wetterstrand K. DNA sequencing costs: data from the NHGRI large-scale genome sequencing program.http://www.genome.gov/sequencingcosts/). Conversely, manpower costs of downstream result analysis and interpretation requiring spe-cialist knowledge is definitely increasing and represents a major challenge for the future of clinical genomics.
Although standards and guidelines for genetic test interpretation have been published in 2015[11], among the more than 7 million variants identified by the Exome Aggregation Con-sortium (ExAC)[12], less than 300,000 unique interpreted variants have been submitted to ClinVar by more than 630 laboratories, and one-third of these were classified by submitters as variants of uncertain significance. Some very interesting approaches have been proposed to support collaborative databases that systematically share genotype-phenotype correlations and variant interpretation data [13–18].
In this regard, the European Union funded the RD-Connect project (www.rd-connect.eu). This project is devoted to rare disease data collection and sharing including the NGS data in a unique large repository where data submission and storage may facilitate genome/exome com-parison for diagnostic settings and test interpretation. Similarly, NIH in USA has launched a large collaborative action on rare diseases (RaDaR) with very similar purpose (https://ncats. nih.gov/radar)Finally, we found that there is wide variation in workloads (samples per month) for NGS analyses, with many laboratories processing low numbers of samples. This is in accor-dance with the very high number of genetic services and laboratories in some countries, including Italy, that also have an unequal distribution, with respect to the population size, as described for Italy by Giardino et al.(6) Although this might be understandable in view of the cultural and scientific background, some very rare diseases do need, it may have a negative impact on the optimization of analytical processes and costs. The European Union has recently approved the European Reference Networks (ERNs) for rare diseases (https://ec.europa.eu/ health/ern_en). These ERNs now already established for 24 rare disease Networks and have the mission to harmonize the diagnosis and care of rare disorders, including genetic testing, across Europe. Wide discussion is ongoing within the ERNs about the possibility to optimize the molecular diagnosis of rare diseases in Reference centers that have a higher sample flow, together with excellent cultural knowledge about the rare disease(s). This is believed to opti-mize both analytical processes and their costs as well as a homogenous diagnostic offer for Rare Patients across Europe. The ERN participating centers (or Health Care Providers or HCPs), selected among various Excellence institutions in EU countries, are now entitled to design the best network profile in order to provide a comprehensive, equal and update stan-dard of care and diagnosis, and new personalized therapies to all patients and families with rare genetic diseases. Nevertheless, this task is based on both Europe and Member States coop-eration, but it also involves the entire Rare Disease community worldwide. Indeed, a stimulat-ing challenge for the future of medical genetics.
In conclusion, we report as first a detailed workload calculation for the molecular genetics diagnosis activities via a survey in Italian laboratories. These estimations may serve to better evaluate the personnel effort need to optimize the molecular workflow, moving, when possible, toward high automation. These values may also have a significant impact in setting up person-nel recruitment strategies by Hospitals. Costs represent a crucial issue to be faced in the Health care and are of outmost importance today, when the new NGS strategies have an increasing role and a consequent economic impact in the medical field.
Supporting information
S1 Fig. Hands-on times for standard PCR and the Sanger sequencing for increasing sample volumes. In box plots, center lines show the medians; box limits indicate the 25th and 75th
percentiles as determined by R software; whiskers extend 1.5 times the interquartile range from the 25th and 75th percentiles, outliers are represented by dots.
(TIF)
S1 Survey A. Module English.
(DOCX)
S2 Survey A. Module original.
(DOCX)
S3 Survey A. Original language.
(XLSX)
S4 Survey A. Raw Data.
(DOCX)
S5 Survey A. Module and raw data English.
(XLSX)
S1 File. Translated copy of guidelines to complete survey.
(DOCX)
Acknowledgments
We would like to thank the Italian Society of Human Genetics (SIGU); Enrico Tagliafico and Alessandra Ferlini are the Molecular Genetics Group present and former (respectively) coordinators.
We also thank the laboratory technicians for the collaboration given in this survey. The SIGU Molecular Genetic Working group is acknowledged as indicated in the Author-ship (§ on behalf of the Molecular Genetics Working Group of the Italian Society of Human Genetics, SIGU): the full membership list is: Amati F.16, Ariani F.17, Botta A.6, Bozzao C.18, Brancati F.19, Bruttini M.17, Calı` F.20, Caligo MA.21, Coviello D.3, D’apice MR.4, De Luca A.22, Fallerini C.17, Ferlini A.14, Giachino DF.7,8, Giovannucci Uzielli ML.23, Grasso M.3, Gualandi F.14, Guercini N.24, Lapucci C.5, Lepri F.25, Mancini B.24, Marinelli M.9, Melis M.26, Merla G.22, Mesoraca A.27, Miorin M.28, Murgia A.29, Neri M.14, Primignani P.10, Ravani A.14, Renieri A.17, Russo S.11, Sabbadini G.30, Sani I.12, Seia M.13, Stuppia L.31, Tagliafico E.1,2, Tom-masi S.32, Zuccarello D.33Genuardi M.15is the current President of SIGU.
1 Center for Genome Research, University of Modena and Reggio Emilia, Italy
2 Department of Medical and Surgical Sciences, University of Modena ad Reggio Emilia, Italy 3 Laboratory of Human Genetics, Galliera Hospital, Genoa, Italy
4. Medical Genetics Laboratory, Tor Vergata Hospital, Rome, Italy
5. Medical Genetics and Molecular Biology Unit, Synlab Italy, Brescia, Italy
6. Dept. Biomedicine and Prevention, Medical Genetics Section, Tor Vergata University of Rome, Italy
7. Medical Genetics, University of Torino, Dept. Clinical &Biological Sciences, Torino, Italy 8. Medical Genetics, San Luigi University Hospital, Orbassano, Italy.
9. Genetics Laboratory Unit, Department of Obstetrics and Pediatrics, AUSL-IRCCS of Reggio Emilia, Italy
10. Department of Laboratory Medicine, Medical Genetics, Niguarda Ca’ Granda Hospital, Milan, Italy.
11. Cytogenetics and Molecular Genetics Laboratory, Istituto Auxologico Italiano, I.R.C.C. S., Milano, Italy
12. Genetica Medica—AOU "A. Meyer" di Firenze, Italy
13. Medical Genetics Laboratory; Fondazione IRCCS Ca’ Granda Ospedale Maggiore Poli-clinico, Milan, Italy
14. Unit of Medical Genetics Unit, Department of Medical Sciences, University of Ferrara, Ferrara, Italy
15. Istituto di Medicina Genomica, Università Cattolica Del Sacro Cuore, Fondazione Poli-clinico Universitario A. Gemelli, Rome, Italy
16. Department of Biomedicine and Prevention, University of Rome Tor Vergata, Italy 17. Medical Genetics, University of Siena, Siena, Italy
18. Department of Clinical and Molecular Medicine, University Sapienza of Rome, 00185 Rome, Italy.
19. Department of Medical, Oral, and Biotechnological Sciences, University of G. d’Annun-zio Chieti and Pescara, Chieti, Italy
20. IRCCS Associazione Oasi Maria SS Institute for Research on Mental Retardation and Brain Aging, Troina, Italy
21. UO Medical Genetics, Department of Laboratory Medicine, University Hospital of Pisa, Pisa 56100, Italy
22. Molecular Genetics Unit, Casa Sollievo della Sofferenza Hospital, IRCCS, 71013 San Giovanni Rotondo, Italy
23. Genetics and Molecular Medicine, Dipartimento di Scieze della Salute, University of Florence, Florence 50132, Italy
24. Genetics and Molecular Biology—Transfusion Medicine, S. Bortolo Hospital, Vicenza, Italy
25. Medical Genetics Unit, Medical Genetics Laboratory, Pediatric Cardiology, Bambino Gesu` Pediatric Hospital, IRCCS, Rome, Italy
26. Università degli Studi di Cagliari, Cagliari, Italy
27. Department of Human Genetics, Altamedica Fetal-Maternal Medical Centre, 00198 Rome, Italy
28. Cytogenetics and Molecular Biology Unit, Santa Maria degli Angeli Hospital Porde-none, PordePorde-none, Italy
29. Laboratory of Molecular Genetics of Neurodevelopment, Department of Women’s and Children’s Health, University of Padova, Italy; Neuroscience Department, University of Padova, Italy
30. Sezione di Citogenetica e Genetica Molecolare, Istituto di Diagnostica Clinica Proda, Roma, Italy
31. Dipartimento di Scienze Psicologiche, della Salute e del Territorio Università “G. d’Annunzio” Chieti-Pescara, Italy
32. Molecular Genetic Laboratory, IRCCS Istituto Tumori "Giovanni Paolo II", 70124 Bari, Italy
33. Clinical Genetics Unit, Department of Women’s and Children’s Health, University of Padova, Padova, Italy
Author Contributions
Conceptualization: Alessandra Ferlini.
Data curation: Isabella Bernardis, Marina Grasso, Maria Rosaria D’Apice, Cristina Lapucci,
Annalisa Botta, Daniela Francesca Giachino, Maria Marinelli, Paola Primignani, Silvia Russo, Ilaria Sani, Manuela Seia, Sergio Fini, Paola Rimessi, Elena Tenedini, Anna Ravani.
Validation: Isabella Bernardis, Marina Grasso, Maria Rosaria D’Apice, Cristina Lapucci,
Annalisa Botta, Daniela Francesca Giachino, Maria Marinelli, Paola Primignani, Silvia Russo, Ilaria Sani, Manuela Seia, Sergio Fini, Paola Rimessi, Elena Tenedini, Anna Ravani.
Writing – original draft: Enrico Tagliafico, Maurizio Genuardi, Alessandra Ferlini.
References
1. Cartwright RY, Davies JR, Dulake C, Hart RJ, Morris CA, Wilkinson PJ. A study of workload units in five microbiology laboratories. J Clin Pathol. 1985; 38(2):208–14. PMID:3968219
2. Trotter MJ, Larsen ET, Tait N, Wright JR Jr. Time study of clinical and nonclinical workload in pathology and laboratory medicine. Am J Clin Pathol. 2009; 131(6):759–67.https://doi.org/10.1309/
AJCP8SKO6BUJQXHDPMID:19461078
3. McPherson E, Zaleski C, Benishek K, McCarty CA, Giampietro PF, Reynolds K, et al. Clinical genetics provider real-time workflow study. Genetics in medicine: official journal of the American College of Medi-cal Genetics. 2008; 10(9):699–706.
4. Surh LC, Wright PG, Cappelli M, Kasaboski A, Hastings VA, Hunter AG. Delivery of molecular genetic services within a health care system: time analysis of the clinical workload. The Molecular Genetic Study Group. Am J Hum Genet. 1995; 56(3):760–8. PMID:7887432
5. Heald B, Marquard J, Funchain P. Strategies for clinical implementation of screening for hereditary can-cer syndromes. Semin Oncol. 2016; 43(5):609–14.https://doi.org/10.1053/j.seminoncol.2016.08.008
PMID:27899194
6. Giardino D, Mingarelli R, Lauretti T, Amoroso A, Larizza L, Dallapiccola B. Survey of medical genetic services in Italy: year 2011. BMC Health Serv Res. 2016; 16:96. https://doi.org/10.1186/s12913-016-1340-7PMID:26988239
7. Bullman S, Lucey B, Sleator RD. Molecular diagnostics: the changing culture of medical microbiology. Bioeng Bugs. 2012; 3(1):1–7.https://doi.org/10.4161/bbug.3.1.19011PMID:22179143
8. Senft D, Leiserson MDM, Ruppin E, Ronai ZA. Precision Oncology: The Road Ahead. Trends Mol Med. 2017.
9. Lionel AC, Costain G, Monfared N, Walker S, Reuter MS, Hosseini SM, et al. Improved diagnostic yield compared with targeted gene sequencing panels suggests a role for whole-genome sequencing as a first-tier genetic test. Genetics in medicine: official journal of the American College of Medical Genetics. 2017.
10. Bourchany A, Thauvin-Robinet C, Lehalle D, Bruel AL, Masurel-Paulet A, Jean N, et al. Reducing diag-nostic turnaround times of exome sequencing for families requiring timely diagnoses. Eur J Med Genet. 2017; 60(11):595–604.https://doi.org/10.1016/j.ejmg.2017.08.011PMID:28807864
11. Richards S, Aziz N, Bale S, Bick D, Das S, Gastier-Foster J, et al. Standards and guidelines for the inter-pretation of sequence variants: a joint consensus recommendation of the American College of Medical Genetics and Genomics and the Association for Molecular Pathology. Genetics in medicine: official journal of the American College of Medical Genetics. 2015; 17(5):405–24.
12. Lek M, Karczewski KJ, Minikel EV, Samocha KE, Banks E, Fennell T, et al. Analysis of protein-coding genetic variation in 60,706 humans. Nature. 2016; 536(7616):285–91.https://doi.org/10.1038/ nature19057PMID:27535533
13. Boycott KM, Rath A, Chong JX, Hartley T, Alkuraya FS, Baynam G, et al. International Cooperation to Enable the Diagnosis of All Rare Genetic Diseases. Am J Hum Genet. 2017; 100(5):695–705.https:// doi.org/10.1016/j.ajhg.2017.04.003PMID:28475856
14. Harrison SM, Dolinsky JS, Knight Johnson AE, Pesaran T, Azzariti DR, Bale S, et al. Clinical laborato-ries collaborate to resolve differences in variant interpretations submitted to ClinVar. Genetics in medi-cine: official journal of the American College of Medical Genetics. 2017.
15. Rehm HL. Evolving health care through personal genomics. Nat Rev Genet. 2017; 18(4):259–67.
https://doi.org/10.1038/nrg.2016.162PMID:28138143
16. Strande NT, Riggs ER, Buchanan AH, Ceyhan-Birsoy O, DiStefano M, Dwight SS, et al. Evaluating the Clinical Validity of Gene-Disease Associations: An Evidence-Based Framework Developed by the Clini-cal Genome Resource. Am J Hum Genet. 2017; 100(6):895–906.https://doi.org/10.1016/j.ajhg.2017. 04.015PMID:28552198
17. Harrison SM, Dolinsky JS, Knight Johnson AE, Pesaran T, Azzariti DR, Bale S, et al. Clinical laborato-ries collaborate to resolve differences in variant interpretations submitted to ClinVar. Genetics in medi-cine: official journal of the American College of Medical Genetics. 2017; 19(10):1096–104.
18. Patel RY, Shah N, Jackson AR, Ghosh R, Pawliczek P, Paithankar S, et al. ClinGen Pathogenicity Cal-culator: a configurable system for assessing pathogenicity of genetic variants. Genome Med. 2017; 9 (1):3.https://doi.org/10.1186/s13073-016-0391-zPMID:28081714