COMPARISON OF SELECTED PHYSICAL PARAMETERS OF RAPESEED CULTIVARS Artur Przywara1, Milan Koszel1, Francesco Santoro2, Alexandros Sotirios Anifantis2
1
University of Life Sciences in Lublin, Poland; 2University of Bari Aldo Moro, Italy [email protected], [email protected], [email protected],
Abstract. Rapeseed is an important alternate oilseed crop in central Europe, Poland. Technical progression in
sustainable agriculture requires the need for further research in more and newer analytical methods to reduce the time of analysis and to minimize the costs routine of tests for the highest accuracy of the results. This possibility is provided by infrared (IR) and near infrared (NIR) spectroscopy. The paper presents various methods of measuring the basic quality parameters (moisture, damage and contamination of raw material) of winter rapeseed for cultivars: Abacus, Bellevue, and Adriana + Catana (concoction). Statistically significant differences resulting from various measurement systems between the results obtained by the means of sieve methods and infrared (IR) have been observed. A three-dimensional way of measuring the seed shape used in the three-dimensional particle size analyser (AWK 3D) suggests that it is more accurate than the measurement applying the two-dimensional method used in the shaker with a set of sieves. All tested cultivars were characterized by optimum moisture contents ranging within 6.0-7.4 %. The greatest differences have been found for the results in the case of the resistance method of moisture, which was damaging for seeds. The largest number of contaminants and damaged seeds has been noted in Bellevue and Adriana + Catana cultivars, which amounted to 7.45 % and 5.33 % respectively. The highest percentage share of rapeseeds for all cultivars has been observed on a sieve with 2 mm of mesh that had collected the largest quantity of Bellevue seeds (94.71 %). The mean 95.24 % of the tested rapeseeds had a spherical shape and 4.76 % have been recognized as contaminations or damaged seeds.
Keywords: rapeseed cultivar, damage of seeds, contamination of seeds. Introduction
Rapeseed is one of the world’s major sources of edible vegetable oil. Cultivars of winter rapeseed are grown mainly in Central and Western Europe, where winters are mild, but also in Asia, Canada, India and China or in the USA [1], whereas in Mediterranean countries, such as Italy, there is much more involved the use of almonds and olives [2-4]. Winter rapeseed cultivars usually provide a higher yield than the spring ones. The average yield of seeds depends on the type of cultivars (hybrid or cross-bred lines), environmental conditions and the agronomic practices. However, the crop yields can vary in different countries in respect of the global trends [5]. High fat content good-quality of proteins makes this plant a valuable resource for food and oil industry [1; 5]. Assessment of raw materials is a very important step in quality control. This identification should certify that the raw material complies with a spectrum of quality parameters that allow its use for further storage and processing [6]. The most suitable rapeseed moisture without water and fat content varies between 5 to 7 %. High fat content, particularly in wet and damaged seeds, is readily degraded by enzymes and oxygen from the air. Following such process, free fatty acids are formed and acidity of seeds increases. It contributes to accumulation of ortho-phosphoric and phytic acids, free amino acids, and reactive substances that are toxic and structurally and functionally deform the cells [7]. Storage of damaged seeds reduces the efficiency of the extraction process. Moreover, it significantly worsens the quality of oil obtained measured with the values of acidic and peroxide numbers.
In the process of extracting rapeseed oil the seeds undergo a series of unit operations. Knowledge of the physical parameters and dependence on the cultivar of rapeseed is essential to facilitate and improve the design of the equipment for harvesting, processing and storage of the seeds. Various types of cleaning, grading, separation, oil extraction equipment are designed based on the physical properties of seeds [8; 9]. In the research [10; 11] some physical properties of rape have been detected at determined moisture content. Therefore, there is a need to measure rapeseeds and variability of these properties with different cultivars.
Moreover, the use of near infrared spectroscopy in the identity analysis reduces the analysis time and is widely applied among others in the quantity of determined constituents identification, falsification detection, the botanical origin determination or the quality changes in the process of heating and storage control, e.g., by measuring the moisture, fat and protein contents of raw materials [12]. The aim of the study was the comparison of the characteristic parameters of rapeseed such as:
external dimensions, contaminants and injuries, moisture using the IR and NIR spectroscopy methods with the values of these characteristics obtained by traditional methods.
Materials and methods
Three different species of winter rapeseed, namely Abacus, Bellevue, Adriana + Catana (concoction) grown in Poland, were used for all the experiments in this study. The rapeseed cultivars were obtained from the 2014 to 2015 growing season at the individual farms located in the villages of Lublin voivodship. The seeds were cleaned in an air screen cleaner, where all foreign matter such as dust, dirt, stones and chaff seed were removed, renewable energy can be used to supply energy during this phase [13].
The obtained samples of the research material were stored in laboratory conditions, hermetically sealed in plastic bags in order to compensate the seed moisture at a constant ambient temperature of 20°C. Moisture analysis for comparative purposes was carried out applying common methods that use the moisture analyzer (manufacturer: Radwag, model: Max 50/1/WH) and resistance grain moisture meter with sample fragmentation (manufacturer: Dramański, model: Grain Master GMS). The third measurement of water content in the examined samples was performed using the Omega G analyzer (manufacturer: Briuns Instrument) using near infrared radiation NIR [14].
Analysis of the seed size, the quantity of contaminants, and seed injuries was carried out in accordance with PN-R-66160 (1991) by distinguishing between useful (injury, mouldy) and useless (organic impurities, stem fragments, etc.) as well as was based on a random sample of 1000 seeds, for which measurements were made in triplicate for each of the three samples. Sieve analysis used a shaker (manufacturer: Multiserw-Morek, model: LPzE-2e) and a set of sieves with mesh diameters: 3.00, 2.00, 1.00, 0.50, and 0.315 mm. A particle size analyzer was used (manufacturer: KAMIKA, model: AWK 3D) equipped with an electronic measuring unit with two independent lanes measuring the particle size distribution. The tests were performed in triplicate and then arithmetic means were calculated. The statistical analysis was carried out using Statistica 10 software using the T-Student test and calculating standard deviations.
Results and discussion
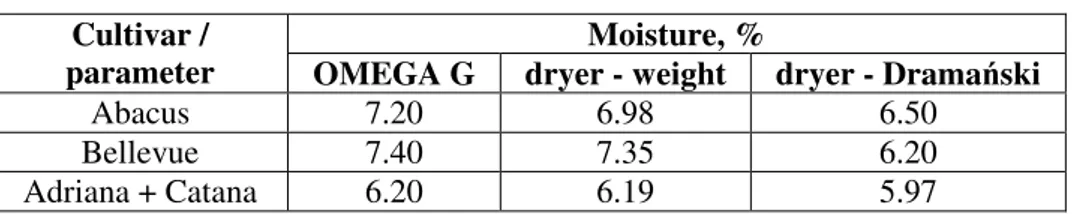
To determine the percentage concentration of water three types of analyzers were used, which are described in Materials and methods. Tab. 1 shows the results of the rapeseed sample moisture measurement, which revealed the water content at the level between 6 % and 6.5 % for the moisture meter Dramiński, between 6.2 % and 7.3 % for the moisture analyzer and 6.2 % to 7.4 % for Omega G. All tested seeds were characterized by optimal moisture acceptable for Fat Processing Plant in a range of 6-9 %. Statistical analysis of the moisture results for the analyzed rape seed samples showed no statistically significant differences between the used methods of the moisture content measurements.
Table 1 Results of moisture content in rapeseed for three cultivars
Moisture, % Cultivar /
parameter OMEGA G dryer - weight dryer - Dramański
Abacus 7.20 6.98 6.50
Bellevue 7.40 7.35 6.20
Adriana + Catana 6.20 6.19 5.97
To indicate the range of changes in the physical parameters, which are especially important in further processing, which determine the quality of seeds and their technological value, it is necessary to define the selected size group of the seeds and geometrical shapes of the resource. The results of the sieve analysis are shown in Tab. 2-3. The sieve analysis separated five seed fractions with different sizes. In the case of the sieve with a mesh size 0.315 mm, there were no rape seeds, but impurities in a form of fine particles after harvesting. On the sieve of 0.5 mm mesh in addition to the contaminants single seeds were isolated. The highest percentage of seeds of all cultivars tested was observed on the sieve with the mesh size of 2 mm, which retained the largest amount of Bellevue cultivar (94.71 %). The Abacus and Adriana + Catana cultivar results were comparable (approximately 75 %). During the
tests carried out using the AWK 3D analyzer no rapeseeds were found on the sieve with the diameter less than 0,315 mm for all three cultivars. In the case of the sieve with 0.5 mm mesh, also contamination or single seeds were not found. The largest share in the samples of all cultivars was made up by the seeds larger than 1 mm (13.68 % to 55.55 %) and larger than 2 mm (49.06 % to 85.95 %). The share of other fractions was negligible. The statistical analysis aimed at comparing the two methods showed statistically significant differences between both methods for all three rapeseed cultivars in the groups of sieves having 2 mm and 1 mm mesh (Tab. 2). Values in the cultivars Bellevue and Adriana + Catana were not considered due to the absence of seeds on the 0.315 mm sieve.
Table 2 Statistical analysis of rape seed distribution on sieves (a – AWK 3D, b - LPzE-2e)
Statistical parameter Sieve
Mean Variation Observations PPC Mean
difference df t Stat Abacus 0.315a 0.040 7.230 3 -0.84856 0 2 -0.65085 0.315b 0.123 0.045 3 - - - -1a 22.785 4.295 3 -0.99705 0 2 -8.44171 1b 49.236 11.279 3 - - - -2a 77.158 4.293 3 -0.99989 0 2 8.342866 2b 50.630 11.802 3 - - - -Bellevue 1a 50.058 85.753 3 1 0 2 9.461749 1b 5.058 0.857 3 - - - -2a 94.716 0.980 3 -0.28367 0 2 2.842431 2b 88.063 13.398 3 - - - -Adriana + Catana 1a 24.161 0.759 3 0.963104 0 2 -9.08512 1b 38.980 13.356 3 - - - -2a 75.721 0.760 3 0.97015 0 2 8.376323 2b 60.680 15.595 3 - - -
-In the traditional method much larger share of seeds was observed on the 2 mm mesh sieve than in the IR method. On the other hand, for the sieve with 1 mm mesh using the IR method an inverse relationship was observed through a higher share of rapeseeds (Tab. 3). This phenomenon can be explained by a more accurate three-dimensional measurement of seeds in the case of the IR method. In the traditional method the measurement is carried out only in two dimensions. Therefore, depending on the setting of seeds passing through the screen, there is the possibility of passing a material with different shapes than a sphere. This situation can cause a remarkable measurement error, when using the traditional method (sieve). Based on this the total volume of seeds and maximum dimensions were calculated.
Table 3 Percentage distribution of rape seeds on sieves using LPzE-2e shaker and AWK 3D analyzer
0.315 0.50 1.0 2.0 3.0 0.315 0.50 1.0 2.0 3.0
Sieves (mm)/
Cultivar LPzE-2e shaker AWK 3D analyzer
Abacus 0.006 ± 0.05 0.001 ± 0.05 26.1 ± 20.74 73.8 ± 19.99 0.04 ± 0.09 0 0.01 ± 0.02 49.2 ± 3.3 50.63 ± 3.4 0.37 ± 0.2 Bellevue 0.005 ± 0.12 0.15 ± 0.32 5.06 ± 8.71 94.71 ± 8.51 0.069 ± 0.01 0 0.02 ± 0.01 11.73 ± 3.3 85.95 ± 3.6 0.35 ± 0.2 Adriana+ Catana 0.01 ± 0.06 0.09 ± 063 24.16 ± 9.26 75.72 ± 9.88 0.02 ± 0.02 0 0.02 ± 0.01 38.98 ± 3.6 60.68 ± 3.9 0.37 ± 0.3
Table 4 shows the distribution of rapeseed shape as percentage distribution of seeds considering their shape. Problems of contamination and damage of rapeseeds is widely discussed due to the special negative influence on the technologies for oil production and its subsequent stabilization. The distribution of rapeseeds is shown below, which presents the quantity and percentage of seeds referring to the shape of the analyzed material. In all cases the highest share was reported for a spherical shape representing the range from 92 % to 98 %, while the smallest - blades being presumably a natural product described as the seed contamination (with irregular and unidentified shape) ranging from 0.3 for Abacus to 1 % for Bellevue. These contaminants were within acceptable limits in fat industry, for which, in the case of raw rapeseed, the pollution level should be about 8 % and for technological about 6 %. The disc and rod-shaped seeds were considered damaged or halved. The smallest share of these parameters has occurred for Abacus 1.5 %; for Adriana + Catana 5.33 % and 7.45 % for Bellevue cultivar. No mouldy seeds were found.
Table 4 Distribution of rape seed shape using AWK 3D analyzer
Abacus Bellevue Adriana + Catana
Shape Quantity, pcs % Shape Quantity, pcs % Shape Quantity, pcs %
Sphere 978 98.5 Sphere 919 92.55 Sphere 941 94.67
Disc 6 0.6 Disc 41 4.13 Disc 26 2.62
Rod 6 0.6 Rod 23 2.32 Rod 18 1.81
Blade 3 0.3 Blade 10 1.00 Blade 9 0.9
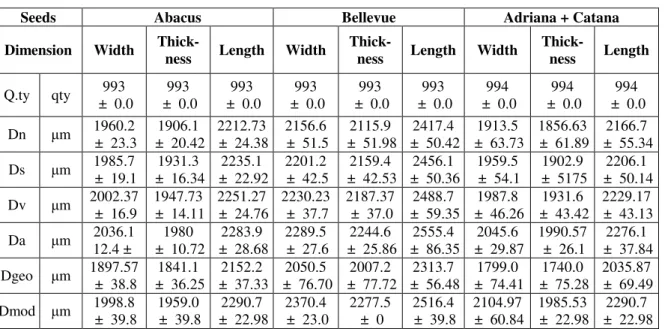
Tab. 5 presents general magnitudes for all cultivars that were measured by the width, thickness and length of seeds. Unfortunately, the AWK 3D registered less than 1000 particles than it was assumed before. Based on this table, the largest mean particle size for all distributions (quantitative, surficial, volumetric) has been noticed for the cultivar of the following dimensions – Bellevue, width of the seeds 2196.01 µm, thickness 2154.12 µm and length 2454.06 µm. The smallest dimensions have been noticed for Adriana + Catana concoction, where the values were respectively: width 1953.60 µm, thickness 1987.04 µm and length 2200.66 µm. Stipulated that the length is usually overestimated while scanning. It happens due to the partial blurring of the image by the laser sensor at the time measurement during the free-falling of seeds.
Table 5 General results with standard deviation for each measured dimension
Seeds Abacus Bellevue Adriana + Catana
Dimension Width
Thick-ness Length Width
Thick-ness Length Width
Thick-ness Length Q.ty qty 993 ± 0.0 993 ± 0.0 993 ± 0.0 993 ± 0.0 993 ± 0.0 993 ± 0.0 994 ± 0.0 994 ± 0.0 994 ± 0.0 Dn µm 1960.2 ± 23.3 1906.1 ± 20.42 2212.73 ± 24.38 2156.6 ± 51.5 2115.9 ± 51.98 2417.4 ± 50.42 1913.5 ± 63.73 1856.63 ± 61.89 2166.7 ± 55.34 Ds µm 1985.7 ± 19.1 1931.3 ± 16.34 2235.1 ± 22.92 2201.2 ± 42.5 2159.4 ± 42.53 2456.1 ± 50.36 1959.5 ± 54.1 1902.9 ± 5175 2206.1 ± 50.14 Dv µm 2002.37 ± 16.9 1947.73 ± 14.11 2251.27 ± 24.76 2230.23 ± 37.7 2187.37 ± 37.0 2488.7 ± 59.35 1987.8 ± 46.26 1931.6 ± 43.42 2229.17 ± 43.13 Da µm 2036.1 12.4 ± 1980 ± 10.72 2283.9 ± 28.68 2289.5 ± 27.6 2244.6 ± 25.86 2555.4 ± 86.35 2045.6 ± 29.87 1990.57 ± 26.1 2276.1 ± 37.84 Dgeo µm 1897.57 ± 38.8 1841.1 ± 36.25 2152.2 ± 37.33 2050.5 ± 76.70 2007.2 ± 77.72 2313.7 ± 56.48 1799.0 ± 74.41 1740.0 ± 75.28 2035.87 ± 69.49 Dmod µm 1998.8 ± 39.8 1959.0 ± 39.8 2290.7 ± 22.98 2370.4 ± 23.0 2277.5 ± 0 2516.4 ± 39.8 2104.97 ± 60.84 1985.53 ± 22.98 2290.7 ± 22.98
Dn – mean particle size in quantitative distribution, Ds – mean particle size in area distribution, Dv – mean particle distribution in volumetric distribution, Da – Sauter mean (mean volumetric diameter of seed weighed according to its area), Dgeo – geometric mean, Dmod - mode (mean of particles the most significant in quantitative distribution)
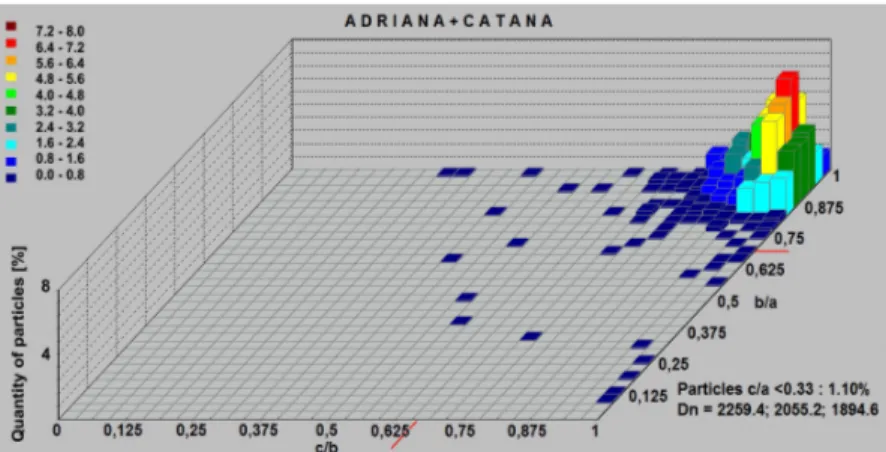
This distribution can be also presented by graphic form using the Zingg classification. The test results were processed using AWK 3D software applying the Zingg classification, based on the proportions between three seed dimensions related to the longest dimension - length (a), medium (b) – width, and the shortest (c) - thickness. Referring to the seed proportions (SP) it was assumed that:
• SP b/a > 0.67 and c/b > 0.67 recall sphere (if b/a = c/b = 1, it is an exact sphere). • SP b/a > 0.67 and c/b < 0.67 recall disc.
• SP b/a < 0.67 and c/b > 0.67 recall rod. • SP b/a < 0.67 and c/b < 0.67 recall blade.
Fig. 1. Quantitative distribution of rape seed particles (Zingg class.: Abacus cultivar)
Fig. 2. Quantitative distribution of rape seed particles (Zingg class.: Bellevue cultivar)
Fig. 3. Quantitative distribution of rape seed particles (Zingg class.: Adriana + Catana cultivar) The classification is based on the proportions between three dimensions of seeds by means of a quantitative system. Fig. 1 shows the distribution for one of three cultivars (Abacus), dividing the analyzed material into four basic classes: spheres located in the upper right corner of the graph, discs in the upper left corner, rods classified in the lower right corner and blades having unidentified shape of contaminants in the lower left corner of the graph. Based on Tab. 4 and Fig. 1-3 it can be concluded that nearly 95.24 % (mean from three cultivars) of all tested rapeseeds had a shape similar to sphere. The remaining 4.76 % (rolls, discs, blades) were recognized as contaminations or damaged seeds.
Conclusions
1. Statistically significant differences resulting from different measurement systems between the results obtained by means of the sieve methods and infrared (IR) have been observed. A three dimensional way of measuring the seed shape used in AWK suggests that it is more accurate than the measurement applying the two-dimensional method used in a shaker with a set of sieves. 2. All tested cultivars were characterized by optimum moisture contents ranging within 6.0-7.4 %.
The greatest differences were found for the results in the case if the resistance method of moisture (that) was damaging for seeds.
3. The largest number of contaminants and damaged seeds has been noted in Bellevue and Adriana + Catana cultivars that amounted to 7.45 % and 5.33 %, respectively.
4. The highest percentage share of rapeseeds for all cultivars has been observed on the sieve with 2 mm of mesh that collected the largest quantity of Bellevue seeds (94.71 %).
5. The mean 95.24 % of the tested rapeseeds had a spherical shape and 4.76 % have been recognized as contaminations or damaged seeds.
References
[1] Casséus, L. Canola: a Canadian success story. Component of Statistics Canada Catalogue, 2009, pp. 96-325.
[2] Bianchi B, Tamborrino A, Santoro F. Assessment of the energy and separation efficiency of the decanter centrifuge with regulation capability of oil water ring in the industrial process line using a continuous method. J Agr Eng 2013;44(2s), 278-82. http://dx.doi.org/10.4081/jae.2013.298 [3] Pascuzzi S., Santoro F. Analysis of possible noise reduction arrangements inside olive oil mills:
A case study. Agriculture (Switzerland), 7(10), 2017, 88. DOI: 10.3390/agriculture7100088 [4] Pascuzzi S., Santoro F. Analysis of the almond harvesting and hulling mechanization process:
A case study. Agriculture (Switzerland), 7(12), 2017, 100.DOI: 10.3390/agriculture7120100 [5] Nesi N., Delourme R., Bregeon M., Falentin C., Renard M. Genetic and molecular approaches to
improve nutritional value of Brassica napus L. seed. Comptes Rendus Biologies, vol. 331 (10), 2008, pp. 763-771.
[6] Sujak A., Kachel-Jakubowska M. Effect of Storage Period on Physicochemical Properties of Rapeseeds and Oil. Pol. J. Environ. Stud., vol. 21(3), 2012, pp. 719-723.
[7] Krasucki W., Tys J., Szafran K., Rybacki R., Orlicki Ł. Wpływ różnych temperatur suszenia nasion rzepaku na ich skład chemiczny. (Influence of drying temperature on chemical composition of seeds of oilseed rape) Oil plants: Rośliny Oleiste, XXIII (2), 2002, pp. 428-438. (In Polish).
[8] Unal H., Sincik M., Izli M. Comparison of some engineering properties of rapeseed cultivars. Industrial Crops and Products. vol. 30, 2009, pp. 131-136.
[9] Ropelewska E., Zapotoczny P., Budzyński W.S., Jankowski K.J. Discriminating power of selected physical properties of seed of various rapeseed (Brassica napus L.) cultivars. Journal of Cereal Science, 73, 2017, pp. 62-67.
[10] Calisir S., Marakoglu T., Ogut H., Ozturk. Physical properties of rapeseed (Brassica napus ofeifera L.). Journal Food Engineering, vol. 69, 2005, pp. 61-66.
[11] Ikebudu J. A., Sokhansanj S., Tyler R. T., Milne B. J., Thakor N. S. Grain conditioning for dehulling of canola. Canadian Agricultural Engineering, 42(1), 2000, pp. 27-32.
[12] Szydłowska-Czerniak A., Tułodziecka A. Comparison of a silver nanoparticle-based method and the modified spectrophotometric methods for assessing antioxidant capacity of rapeseed varieties. Food Chemistry 141, 2013, pp. 1865-1871.
[13] Anifantis A. S., Colantoni A., Pascuzzi S., Santoro F. Photovoltaic and hydrogen plant integrated with a gas heat pump for greenhouse heating: A mathematical study. Sustainability (Switzerland), vol. 10(2), 2018, pp. 1-12. DOI: 10.3390/su10020378.
[14] Dz.U.2004.20.178. Rozporządzenie Ministra Gospodarki, pracy i polityki społecznej z dnia 22 stycznia 2004r. w sprawie wymagań metrologicznych, którym powinny odpowiadać wilgotnościomierze do pomiaru wilgotności ziarna zbóż i nasion oleistych (Regulation of the Minister of Economy, Labor and Social Policy of January 22, 2004 on metrological requirements, which should correspond to moisture meters for measuring the moisture of cereal grains and oilseeds). (In Polish).