The Po Delta is restarting
progradation: geomorphological
evolution based on a 47-years Earth
Observation dataset
A. Ninfo
1, P. Ciavola
1& P. Billi
2From the 1950s, the Po delta, one of the largest anthropogenic world deltas, has been subjected to a fast degradation and shoreline retreat due a marked reduction of sediment supply, mainly controlled by human impacts/factors, including subsidence. Through the interpretation of satellite images, coupled with the analysis of the flow discharge, and of the annual frequency of marine storms, we show that recently (>2010) the Po River has resumed delta progradation, especially in its northern portion. This happens after decades of erosion, followed by alternating regrowth and degradation phases, indicating conditions of substantial stability (1970–2000). Today the delta shows aggradation of new mouth-bars at the main distributary mouth, a clear evidence of active constructive processes. The ongoing trend marks a countertendency compared to many deltas worldwide.
The Po is the largest Italian river, draining an area of 70,091 km2 and flowing for 650 km (Fig. 1). The Po River sediment supply to the Adriatic Sea has generated one of the largest Mediterranean deltaic system (emerged delta area ~700 km2). The Po delta is considered relatively young (~4–5 ky)1 and can be described as a delta dominated
by both natural and anthropogenic process2. Historically, the delta developed through different branches, the
position of which was quite different from the present one. The Po delta evolution has been driven by natural flu-vial processes (floods/avulsions) and by a growing anthropogenic influence (e.g. engineering works and extensive land reclamation)2.
The delta progradation near the current position started in the early 17th century, following massive hydraulic works such as the ‘Porto Viro” bypass. The works were made by the Venetian Republic in 1604 to divert the delta southwards in order to prevent the sedimentation generated by the northern branches into the Venice lagoon3.
The recent human influence (e.g. dredging near the mouths, artificial consolidation of spits/beaches through sand feeding, channel bank protection, man-induced subsidence, etc.) has been shaping the delta and it is still a dominant controlling factor. Most likely, the Po delta can be considered among the best examples of man-made (anthropogenic) delta in the world4.
The historical maximum sedimentation (and progradation) rates were associated with the Little Ice Age cli-matic transition1, whereas during the 20th century, the delta progradation slowed down.
The delta reached its maximum extension between 1930s–1940s; thereafter a significant retreat started at a rate of tens of meter per year, with a negative peak in the 1954–1978 interval2. This reduction in sediment
yield, generally observed in all Italian rivers after World War II, was caused by different factors including bed material exploitation, dam construction, landslide stabilization, and a progressive reduction of agriculture on low mountain and hilly areas which was commonly followed by reforestation or by a natural regrowth of bush and low forest5. In the same period, a marked subsidence, due to extraction of methane and water from shallow
aquifers, occurred. These actions resulted in a halt of progradation and a very rapid shrinkage of the deltaic body, as observed in other large delta systems around the world (e.g. Colorado, Nile, Yangtze and Yellow River)6. The
Po delta, therefore, turned into a fragile and vulnerable landscape, exposed to human modification and climate change impacts like sea level rise and coastal flooding7.
The post-1950 reduction in sediment supply generated an overall retreat of the coastline and of all the delta outlets, which was particularly severe in the Po di Pila mouth and the northern part of the delta (Fig. 1). According to previous studies (e.g.3), the Po di Pila mouth erosion started in the 1950s and proceeded till today.
1University of Ferrara, Ferrara, Italy. 2University of Tottori, Tottori, Japan. Correspondence and requests for materials should be addressed to P.C. (email: [email protected])
Received: 26 October 2017 Accepted: 13 February 2018 Published: xx xx xxxx
The Pila mouth is estimated to deliver at least 70% of the whole Po sediment load8,9. The sediment input to the
delta mouths was modulated also by the fast artificial subsidence experienced by the channel beds during the sec-ond half of the 20th century10 and caused by fluid withdrawal and by the changing flow proportions between the
different distributary channels in consequence of river regulation and water pumping for irrigation.
This part of the delta is therefore ideal to test whether the decreasing trend in sediment supply is still reflected by coastal retreat. Thanks to more than 40 years of satellite Earth Observations (EO), we investigated the coastal changes occurred in the Po Delta during the last phase of general reduction in sediment supply (1970–2000). Moreover, the recent enhanced satellite capabilities (e.g. Sentinel 2) permit to focus, in particular, on the most recent and on the current geomorphological evolution of the Po delta margins.
Methods
While for the period 1950 onwards researchers had to rely on indirect sources like a not frequently updated cartography and sparse aerial photography, remotely sensed data offers a higher frequency dataset of direct observation.
With the technological progress of scientific optical satellite imaging and access policy, large public datasets are now available, starting from the 1970s through the Landsat missions1,2 and, from summer 2015, through the
Copernicus Program with the Sentinel-2a satellite, followed, in march 2017, by the Sentinel-2b, which allowed an almost continuous monitoring of the geomorphological evolution of the most active Po delta margins.
Compared with Landsat 8, Sentinel-2 has a better temporal resolution (e.g. it can archive on average at least one cloud free image every week), a better spatial resolution on VIS and NIR (10 m vs 30 m of Landsat) and a
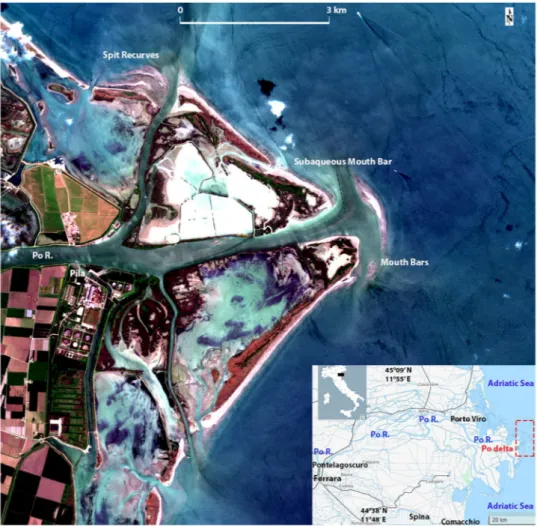
Figure 1. Sentinel 2a scene (L1C_T32TQQ_A009743_20170504T101349), acquired on 4 May 2017, visible
false color composition (B432+ Gaussian_stretch, 10 m cell size). In this normal low-tide image the prograding landforms are clearly shown: notice the mouth bars in front of the main Pila mouth, and on the secondary distributary channel (N oriented) a series of three spit recurves. The satellite image was processed by the authors using Copernicus Sentinel 2017 data (L1C level of processing), downloaded from https://eros.usgs.gov/ about-us/data-citation under EU open access policy (https://sentinel.esa.int/web/sentinel/sentinel-data-access). The map in the inset was obtained from Open Street Map under Open Data Commons Open Database License (ODbL) V1.0: https://opendatacommons.org/licenses/odbl/. The location map of Italy was obtained from http:// d-maps.com/carte.php?num_car=14528&lang=it under Open Access policy http://d-maps.com/conditions. php?lang=it.
good radiometric capability (12 bit depth like the Landsat 8). For this study, images taken during extremely high or low tidal levels were not considered because they could give false information on the position of the shoreline. All the other images were considered acceptable, considering that in the Adriatic Sea the tide range is very limited (0.2–0.8 m). Moreover, some images, acquired with visible wave crests near the coast, underlined the presence of subaqueous landforms (e.g. Fig. 2f), that could be identified by the breaking wave patterns.
To maximize the geometric resolution, the 10 m visible bands of Sentinel 2 were composed in the following order, 4(665 nm) 3(560 nm) 2(490 nm). The false color compositions were digitally enhanced applying a contrast
stretch, based on the Gaussian distribution of the pixel image values, to emphasize the landform visibility (Fig. 1). In order to get complementary information on the river delta dynamics, flow measurements carried out by the Po River Authority were obtained for the gauging station of Pontelagoscuro (Fig. 1), approximately 70 km inland and 40 km upstream of the deltaic system apex. The validated data span the 1925–2015 interval, with some gaps around WWII and in recent years. As suspended sediment transport measurements were stopped in 1984, these data were not used. As an alternative, a newly defined effective flow discharge (Qk) was considered a good proxy of
sediment yield. In a large river like the Po, sediment yield is controlled by a number of factors, the most important of which are sediment supply and flood frequency. The most downstream reach of the Po river, between the flow gauge of Pontelagoscuro, near Ferrara (Fig. 1) and the mouth, is devoid of tributaries, thus it can be considered a buffer reach in which sediment undergoes a repeated deposition and entrainment conditions. This implies that the river mouth response to the variability of sediment yield is not immediate and a certain time lag should be expected. Furthermore, the sequence of flows with very different discharges may play a very important role in transferring the river bed material to the mouth. Though an individual exceptional flood can entrain, transport and deliver a large quantity of bedload, phases with a number of higher-than-average floods can also be effective in the actual transfer of more or less large quantities of sediment to the mouth. The discharge exceeded 10 days a year (Q10d) is a useful datum that may well represent the fraction of the largest flows, i.e. the most effective for
bed-load transport. Though yearly variable, Q10d, is in fact close to the threshold conditions for bed material entrain-ment in sandbed rivers of the northern Adriatic coast11; moreover, that is the lowest duration flow data available
in the official data records for the rivers of the region. On the base of yearly data, as the discharge exceeded 10 days a year (Q10d) is close to the maximum discharge (Qmax), and the higher is Qmax the larger amount of sediment
is likely to be delivered at the mouth. These two characteristic discharges were combined to obtain a sediment transport capability discharge (Qk) in the following from:
= −
Qk QmaxQ10d/(Qmax Q10)
Qk was found to well explain the variability of the sediment yield of the Po R. on the base of the data published
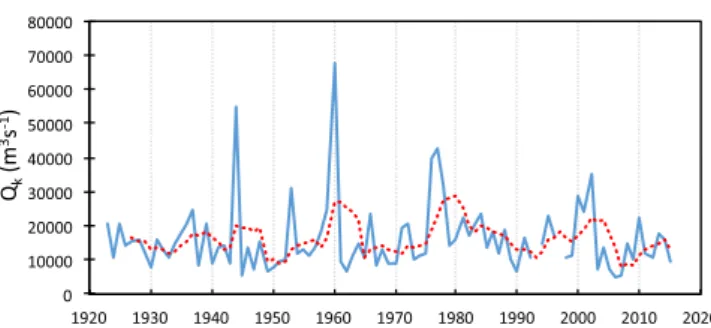
until 1984. A time series of Qk yearly values was constructed and plotted in the diagram of Fig. 3, where the
five-year mobile average (the dotted red line) is also included to emphasize high and low flow intervals.
To assess the last decade of meteo-marine activity, the storm identification was carried out using data from a wave buoy located at Cesenatico (https://arpae.it/sim/?mare/boa), maintained by the Regional Environment Agency of Emilia-Romagna (ARPAe) and located about 100 km south of the Pila mouths. The data of this meas-uring station were used to analyze the annual frequency and mean duration of representative storms (Table 1).
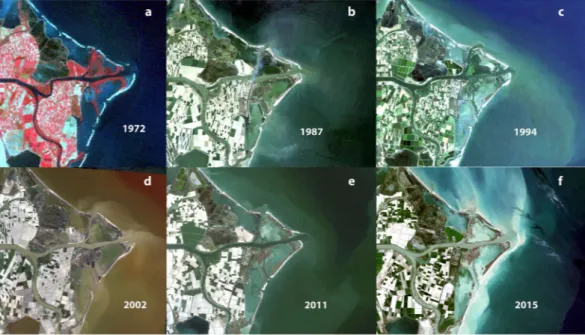
Figure 2. Landsat satellite images: (a) L1MSS-12 August 1972 (60 m); (b) L5TM 8 May 1987 (30 m); (c) L5TM
14 July 1994 (30 m); (d) L7ETM 23 April 2002 (30 m); (e) L5TM 17 April 1991 (30 m); (f) L8OLI 3 April 2015 (30 m). Landsat images were obtained by processing datasets downloaded from the Glovis USGS server (https:// glovis.usgs.gov) under open-access policy https://eros.usgs.gov/about-us/data-citation.
Data availability statement.
The authors declare that the data used for this paper are open-access and available from the institutions who own them. Landsat satellite images are available from the Glovis USGS serverhttps://glovis.usgs.gov. Sentinel images are available from the server of the European Space Agency https://sen-tinel.esa.int/web/sentinel/sentinel-data-access. River Po Hydrologic Data can be requested to the Po River Basin Authority http://www.adbpo.gov.it. Wave data can be downloaded from the ARPAe server https://www.arpae.it/ dettaglio_generale.asp?id=3284&idlivello=1625.
Results
From the 2015–2017 Sentinel-2 images of the Po delta, the growth of a small barrier/lobe island is evident in front of the main Pila mouth. Initially it was observed only in overpasses at low tide, or from patterns in visible suspended sediment and in alterations in the wave crests, for example in January 2015 (Fig. 2f), confirming a fast growth of the mouth bar, after a series of floods occurred between 2013–1512. At about the same time, new
crescent-shaped mouth bars (spit recurves) aggraded above sea level at the secondary northern Pila mouth. From the summer/winter 2016 the islands and the mouth bars became evident with almost every tide level. This trend seems to continue until present as shown by the May 2017 Sentinel-2a digitally enhanced image (Fig. 1). The growth direction of these active bars is N-NW, most likely driven by SE waves (Scirocco wind), i.e. mainly follow-ing a longshore drift direction opposite to the dominant northern wind (Bora)9,13. Also the main channel outlet
and the subaqueous mouth bar are oriented N-NW (Fig. 1).
The coastline analysis (1972–2011), based on the interpretation of at least one images every 7–10 years (Fig. 2), shows that the most active margins of the delta have been subjected to some erosion followed by progradation and then again by erosion. That indicates a certain degree of stability, as recently reported by other authors14, with
some changes in the ‘arrow’ shape of the delta till the end of the 1990s (Fig. 2a–c). During this interval, a partial growth of the secondary Pila mouth was observed, but later it was eroded. At this location, a slow sedimentation started around 2002 and became more evident in 2011, with the formation of the submerged parts of the mouth bars. These landforms became visible in low tide conditions from 2015 and still continue building-up above the sea level (Fig. 1). Since the 1970s the coastline between the two Pila outlets had advanced of 400–500 m, with some zones growing of 100–200 m in the last 6–7 years (Figs 1–2f).
Figure 3. Sediment transport capability, effective discharge (Qk) time series. It shows that in the last 50 years
only three periods of potential high sediment flux occurred around 1960, 1976–1977 and 2000–2002. The interval between the last two peaks, 26 years, is the largest of the time series and coincides with the phase of higher retreat rates of the delta. The red dotted line is the five-years moving average.
Year Number of storms Cumulative number of storm hours Data gaps
2007 10 226 2008 14 256 2009 13 161 January-May 2010 13 234 November-December 2011 13 244 October-December 2012 12 194 January-March 2013 16 361 2014 7 135 February-June 2015 20 401 2016 17 301 2017 12 291 July-October
Table 1. Storms identification during the last ten years using data from the Cesenatico buoy station. Storm
identification is based on the criteria of15 and corresponds to a storm threshold of wave height >1.5 m;
individual storms are identified by a 3 hours interval with the wave height below threshold; minimum storm duration considered is 6 hours.
extend and large survey vessels cannot access. Remotely sensed optical data allow detecting the changes of even the shallowest coastal morphologies (between tide levels ~0.8–1.5 m) but in the past had the limitation of a low frequency of data acquisition and an unsatisfactory on-the-ground resolution. The Sentinel platform revisiting capabilities permit the frequent comparison between images captured at the same tidal level and increase the possibility of finding acquisitions made during conditions of good water transparency, as in Fig. 1. The inability of a deeper water penetration prevented us from exactly pinpointing when nearshore aggradation of the submerged landforms has started, triggering the emersion of the mouth bar. However, it is clear that the underwater aggrada-tion had already been developing for some times (few years 2–4) as it can be seen in Fig. 2e around the secondary Pila northern mouth and in Fig. 2f on the main outlet.
Two main factors generally control delta progradation: longshore sediment transport system and the amount of sediment supply by the river. Furthermore, storm-related erosive marine processes can play a fundamental role in contrasting the mouths progradation and aggradation. Previous works10 found no evidence that in the
last two to four decades the coastal sediment transport system and the wave activity have changed. As it can be seen in Table 1, in the last decade, the frequency of storms has remained substantially constant, showing only limited deviation within the normal climate variability, also during the years of the fastest coastal progradation (2015–17). This evidence supports the hypothesis that the sediment budget at the Po river mouth has turned pos-itive again propelling coastal accretion at the northern margins of the delta (Pila mouth bars) after a few decades of low yields.
Figure 3 clearly shows that after about 30 years of relatively low potential effective flows, in the 2000–2002 interval the situation was reversed and higher transfer rates of bed sediment to the mouth were likely resumed. It is worth noticing that this is not the only factor that could have contributed to restore a substantial sediment flux to the Po river mouths. In fact, the prohibition of bed material harvesting, defined by law in the late 1980s, could be showing now its positive effects. The sediment infilling of the very many (thousands) weirs in the headwaters may have contributed as well. They were constructed during the last century all across the mountainous and hilly areas of the Po catchment, as torrent control works to contrast slope degradation and river incision. Nowadays most of these weirs have already fulfilled their original purpose and are completely silted-up. With no more sed-iment being trapped behind them, they no longer hinder the natural transfer of sedsed-iment from the catchment slopes to the river network. Moreover, climate change may have played an important role in terms of acceler-ated glacier and snow melting in the Alps, which increased the spring season discharges of the Po4, resulting in
higher values of the potential effective discharge (Qk) (Fig. 3). In Fig. 3 also the five-year mobile average has been
included in order to point out prolonged periods with higher values of Qk which may reflect a substantial bedload
supply, more effective in contributing to the formation of mouth bars.
In conclusion, the results of this study point out that the Po delta, after a sediment budget crisis extended throughout the first years of the 21st century, has started again to prograde. In the most recent years (>2010) between the Pila mouths the process has been accelerating and now some progradation is taking place as showed by the growth of mouth bars in Fig. 1. This signal cannot be extrapolated to the whole of the delta, as it is relative to only a portion of it. It is probably necessary to consider a longer time span in the future to assess the response of the whole system.
The current trend marks a countertendency compared to many other world deltas5,6 and can be summarized
as the result of sediment management policy paired by unexpected climate change positive feedbacks (e.g. accel-erated spring ice/snow melting). In any case the area still remains highly vulnerable to sea-level rise as well as storm and river flooding due to the low elevation above mean seal level.
References
1. Stefani, M. The Po Delta Region: Depositional Evolution, Climate Change and Human Intervention Through the Last 5000 Years. In: Soldati, M. & Marchetti, M., (Eds) Landscapes and Landforms of Italy. World Geomorphological Landscapes. Springer (2017). 2. Cencini, C. P. Processes and Human Activities in the Evolution of the Po Delta, Italy. J. Coast. Res. 14-3, 774–793 (1998). 3. Stefani, M. & Vincenzi, S. The interplay of eustasy, climate and human activity in the late Quaternary depositional evolution and
sedimentary architecture of the Po Delta system. Mar. Geol. 222–223, 19–48 (2005). 4. Maselli, V. & Trincardi, F. Man-made deltas. Sci. Rep. 3, 1926 (2013).
5. Billi, P. & Fazzini, M. Global change and river flow in Italy. Glob. Planet. Chang. 155, 234–246 (2017). 6. Syvitski, J. P. M. et al. Sinking deltas due to human activities. Nat. Geosci. 2, 681–686 (2009). 7. Giosan, L. et al. Protect the world’s deltas. Nat. 516, 31–33 (2014).
8. Correggiari, A. et al. The modern Po Delta system: Lobe switching and asymmetric prodelta growth. Mar.Geol. 222–223, 15–49 (2005).
9. Syvitski, J. P. M. et al. Distributary channels and their impact on sediment dispersal. Mar. Geol. 222–223, 75–94 (2005).
10. Gambolati, G. et al. Coastline regression of the Romagna region, Italy, due to natural and anthropogenic land subsidence and sea level rise. Water Resour. Res. 35(1), 163–184 (1999).
12. Braga, F. et al. Mapping turbidity patterns in the Po river prodelta using multi-temporal Landsat 8 imagery. Estuarine Coastal and Shelf Science 1–13, in press, https://doi.org/10.1016/j.ecss.2016.11.003 (2016).
13. Bever, A. J. et al. Deposition and flux of sediment from the Po River, Italy: an idealized and wintertime numerical modeling study.
Mar. Geol. 260, 69–80 (2009).
14. Besset, M. et al. River delta shoreline reworking and erosion in the Mediterranean and Black Seas: the potential roles of fluvial sediment starvation and other factors. Elem. Sci. Anth. 5(54), 2–20 (2017).
15. Armaroli, C. et al. Critical storm thresholds for significant morphological changes and damage along the Emilia-Romagna coastline, Italy. Geomorph. 143–144, 34–51 (2012).
Acknowledgements
LANDSAT data are available from the U.S. Geological Survey. Sentinel2 data courtesy of ESA (European Space Agency). We are grateful to E. Duo for assistance in processing wave data.
Author Contributions
A. Ninfo processed all satellite data and wrote large parts of the manuscript. P. Ciavola analyzed wave data, edited the whole manuscript, wrote parts of it and coordinated the study. P. Billi analyzed river discharge and wrote parts of the manuscript.
Additional Information
Competing Interests: The authors declare no competing interests.
Publisher's note: Springer Nature remains neutral with regard to jurisdictional claims in published maps and
institutional affiliations.
Open Access This article is licensed under a Creative Commons Attribution 4.0 International
License, which permits use, sharing, adaptation, distribution and reproduction in any medium or format, as long as you give appropriate credit to the original author(s) and the source, provide a link to the Cre-ative Commons license, and indicate if changes were made. The images or other third party material in this article are included in the article’s Creative Commons license, unless indicated otherwise in a credit line to the material. If material is not included in the article’s Creative Commons license and your intended use is not per-mitted by statutory regulation or exceeds the perper-mitted use, you will need to obtain permission directly from the copyright holder. To view a copy of this license, visit http://creativecommons.org/licenses/by/4.0/.