DOCTORAL SCHOOL IN BIOLOGY
Section: Biodiversity and Ecosystem Analysis
XXV CYCLE
A.A. 2011/2012
Morphological analysis of two Paussinae
species: Paussus favieri and P. cridae (Coleoptera:
Carabidae). A geometric morphometric approach.
Ph.D. Student: Raffaella Bravi
Tutor: Dr. Andrea Di Giulio
Co-tutor: Dr. Massimiliano Scalici
Thesis Defense on the 25th February 2013 in front of the following jury: Dr. Vincent Debat (Eurpean committee member)
Prof. Werner Greuter (Eurpean committee member) Prof. James D. Harris (Eurpean committee member)
European Evaluators: Prof. Paul Alibert Prof. Jean-Yves Rasplus
I have called this principle, by which each slight variation, if useful, is preserved, by the term of Natural Selection.
TABLE OF CONTENTS
Supplementary materials ... I Papers published or prepared in the course of the PhD ... II Preface ... III
INTRODUCTION ... 1
Morphology ... 1
Geometric morphometrics ... 1
Myrmecophily and Parasitism on ants ... 3
Paussinae ... 5
Paussini ... 7
Paussus favieri. ... 8
Paussus cridae ... 10
Aim and objectives ... 10
CHAPTER 1 ... 13
1) Introduction ... 13
2) Morphological variation in Paussus favieri. ... 14
3) Morphological variation in Paussus cridae. ... 24
CHAPTER 2 ... 39
1) Introduction ... 39
2) Directional asymmetry in Paussus favieri (Coleoptera: Carabidae: Paussini). 43 3) Directional asymmetry in two Paussinae species: Paussus cridae and P. spinicoxis (Coleoptera: Carabidae: Paussini). ... 50
CONCLUSIONS ... 59
REFERENCES ... 62
I
Supplementary materials
Appendix A: Materials and Methods of the thesis, with references. Appendix B: Addictional Materials to Chapter 2, section 2:
1. Table 2.2a - Pairwise comparisons by the canonical variate analysis performed between the studied populations in P. cridae. Mahalanobis distances and p-values, after 10000 permutation runs. Significative values are reported in bold red. (Angola – AN; Democratic Republic of Congo-former Zaire- CN; Kenya – KN; Rwanda – RW; South Africa – SA; Tanzania – TZ; Uganda – UG; Zambia – ZA; Zimbabwe – ZB).
2. Table 2.2b - Pairwise comparisons by the canonical variate analysis performed between the studied populations in P. cridae. Procrustes distances and p-values, after 10000 permutation runs. Significative values are reported in bold red. (Angola – AN; Democratic Republic of Congo-former Zaire- CN; Kenya – KN; Rwanda – RW; South Africa – SA; Tanzania – TZ; Uganda – UG; Zambia – ZA; Zimbabwe – ZB).
Appendix C: other papers published and submitted during the PhD:
1. Scalici M., Bravi R. 2012. Solving alpha-diversity by morphological markers contributes to arranging the systematic status of a crayfish species complex (Crustacea, Decapoda). J Zool Syst Evol Res. 50: 89-98.
2. Bravi R., Ruffini M., Scalici M. Morphological variation in riverine cyprinids: a geometric morphometric contribution. Italian Journal of Zoology. Accepted.
Papers published or prepared in the course of the PhD
1. Scalici M., Bravi R. 2012. Solving alpha-diversity by morphological markers contributes to arranging the systematic status of a crayfish species complex (Crustacea, Decapoda). J Zool Syst Evol Res. 50: 89-98.
2. Bravi R., Ruffini M., Scalici M. Morphological variation in riverine cyprinids: a geometric morphometric contribution. Italian Journal of Zoology. Accepted.
3. Benitez H., Bravi R., Vallebuona F. Left-Right Asymmetry and Shape Analysis in Multiple Austral Populations of Ceroglossus chilensis (Coleoptera: Carabidae). Journal of Zoological Systematics and Evolutionary Research. In rev.
4. Benítez H., Pizarro-Araya J., Bravi R., Sanzana M.J. Alfaro FM. Variation and island effect on isolated populations of Praocis (Praocis) spinolai Gay and Solier, 1840 (Coleoptera: Tenebrionidae) with a geometric morphometric approach. Journal of Arid Environment. In rev.
5. Bravi R., Scalici M., Klingenberg C.P., Di Giulio A. Directional asymmetry in Paussus favieri (Coleoptera: Carabidae: Paussini). Biological Journal of Linnean Society. (In preparation).
6. Bravi R., Scalici M., Klingenberg C.P., Di Giulio A. Morphological variation in ant nest beetle Paussus favieri (Coleoptera: Carabidae, Paussinae). Biological Journal of Linnean Society. (In preparation). 7. Bravi R., Scalici M., Klingenberg C.P., Di Giulio A. Morphological
variation in Paussus favieri Fairmaire, 1851. In prep.
8. Bravi R., Scalici M., Klingenberg C.P., Di Giulio A. Morphological variation in Paussus cridae/spinicoxis Westwood 1850. In prep. 9. Bravi R., Scalici M., Klingenberg C.P., Di Giulio A. Directional
asymmetry in two Paussinae species: Paussus cridae and P.
III Preface
The thesis is structured in:
ü Brief introduction on the issue of the Ph.D. project, discussing the importance of morphology and how it can be used to infer characters involved in intraspecific relationships, upon the light of coevolutionary interactions. In particular the study focuses on myrmecophilous beetles, which have revealed as an interesting model of study for they strictly morphological adaptations.
Paussus favieri and Paussus spinicoxis/cridae were used as model
species for this purpose. Moreover, morphological characters are used to deepen the taxonomic status of the group Paussus
spinicoxis/cridae, which some authors consider as two separate
species, some others as one.
Chapters are structured as manuscripts, with brief introductions, results and discussions, including tables and figures.
ü Chapter 1 is focused on the investigation of morphological variability in two myrmecophilous beetles, and in particular on how the coevolutionary interactions with ants could infer on the morphology of the two species. This chapter is divided in to three sections:
1. A brief introduction on the study of morphological variability and its importance in this parasite beetles, unpon the light of coevolution;
2. Is focused on the investigation of morphological variability on several parts of the entire body, in different populations of the myrmecophilous beetle P. favieri;
3. Is centred on morphological analyses on the taxonomically questioned species of myrmecophilous beetles Paussus cridae and P. spinicoxis.
ü Chapter 2 is centred on the analysis of evolutionary patterns that shaped the coevolutionary interactions between myrmecophiles beetles and their ant hosts. This chapter is subdivided in to three sections
1. Briefly introduction of coevolutionary theories and their importance in morphological adaptations.
2. Analysis of evolutionary patterns in P.favieri.
3. Analysis of evolutionary patterns in P.spinicoxis and P. cridae. ü Conclusions section briefly synthetize and link the main results of
the thesis, also suggesting future directions for researchers
Additionally, abstract and materials and methods are separated from the main text and included in the supplementary material section. References include all the citations in the thesis. Finally, chapters correspond to manuscripts, submitted or in preparations.
INTRODUCTION Morphology
The importance of morphology is stated from ancient time, in fact from Linnaeus to present days, differences in forms were used to infer differences between organisms, and finally to describe and classify species.
Over the past 20 years systematic biology has enlarged the view of morphology to include in the study many different kinds of patterns to phylogenetic studies. Among these, macroscopic structural characters are traditionally used to infer patterns of phylogenetic relationships through the time (e.g. ancients and descents) (Lauder 1990). Systematists have largely used morphology as the foundation for biogeographic, ontogenetic, and morphometric analyses, but more recently they have included DNA sequences, electrophoretic banding patterns and ontogenetic sequences to disentangle genealogical relationships (Lauder 1990). Since this genetic approach to phylogeny increased in its diffusion and applications, the use of morphology to describe forms and infer their phylogeny has decreased.
More recently a rediscover of the importance of morphological characters happened. Morphological evidence in fact, helps to solve the hypotheses of phylogenetic relationships and characters evolution, and excluding it from the analyses could result in less exploratory and explanatory outcomes (Assis 2009). Furthermore molecular hypotheses could fail in providing explanations and reconstructions regarding the morphological evolution of traits, omitting the importance of coherently linking morphological evidence to phylogenetic relationships.
Under these considerations, it emerges the importance of morphological data in testing phylogenetic relationships among taxa. Consequently, morphology must have its own role in phylogenetic reconstructions, and this could not be omitted (Assis 2009; Hermsen and Hendricks 2008).
Geometric morphometrics
The study of the shape is fundamental for many biological studies such as taxonomic classification and understanding the variety of many biological forms, both based on the descriptions of these biological forms (Zelditch et al. 2012). The so-called traditional morphology took place in the early twentieth century, when the biological studies passed from merely describe,
2
to scientifically quantify the different morphologies of the forms (Adams et al. 2004). This “quantitative approach” was possible because the development of multivariate statistical methodologies, and made possible the beginning of the morphometric studies (Adams et al. 2004). Enclosed in this context, morphometrics is the study of shape variation and its covariation with other variables. Traditionally it takes applications in analyzing quantitative variables as length, width, and height. Unfortunately with this traditional method one could obtain the same set of variables from two different shapes, and this because the two shapes could have for instance the same length or the same width even if the two shapes are completely different.
Nowadays modern morphometrics studies include and emphasize the geometry of morphology in the shape analyses, and this new technique is known as “geometric morphometrics” (GMM). Including the geometric information in the analyses avoid obtaining the same set of variables. This new method of analysis started what Rohlf and Marcus called the “morphometric revolution”(Rolhf and Marcus 1993).
One of the methods used for catching the information regarding the geometry of shapes is the landmarks based method. This begins with the collection of coordinates, which characterize the shape of the object. Then the superimposition (Procrustes fit) mathematically eliminates all the non-shape information (rotation, orientation and location). After that it is possible to compare the shape of the objects through the coordinate data and obtain the variation in shape between objects (described in terms of differences in deformation grids or shapes) (Adams et al. 2004; Klingenberg 2011).
Starting from 90’, advances in morphometric methods allow integrating the geometric morphometric with other methods, coming from different fields. The study of symmetry and asymmetry for instance, had fascinated researchers for years. Detecting random departures from perfect symmetry (so called fluctuating asymmetry-FA) had taken to identify the stability or instability of developmental processes (Møller and Swaddle 1997; Palmer and Strobeck 1986; Palmer 1996, 2004), and thus to assess the environmental processes that could influence these departures from symmetry, and their implications in evolutionary processes (Palmer 2004). A great innovation on this field took place when Klingenberg and McIntyre (1998) developed a technique for assessing the departure of symmetry with the use of geometric morphometrics, and used the shape variation to depict
levels of integrations, thus benefit from the powerful of analyses and visualization of this method.
More recently the interests of researchers in quantify and depict variation in symmetry in apparently symmetrical forms has increased (Klingenberg et al. 1998, 2002, 2010a,b; Savriama et al. 2012) and promise to begin another “revolutionary era” in studies of symmetries.
Myrmecophily and Parasitism on ants
Ants inhabit well-structured and stable nests, composed by a variety of microhabitats (e.g. foraging trunks, nest chambers, guard nests, storage chambers, brood chambers divided into pupae, larvae and eggs chambers, queen chamber, etc.) that are suitable and attractive for a variety of organisms, including symbionts and social parasites (Hölldobler and Wilson 1990). Nests are well defended, and only members of the colony are allowed to enter the nest, the alien individuals being severely rejected. Specialized castes are variously able to block and hurt the enemies when defending both the nest and the colony members (Hölldobler and Wilson 1990). Where this strategies are not enough, ants are also equipped with poison glands, releasing toxic chemicals, the most known of which is the formic acid (Hölldobler and Wilson 1990). In a so strongly defended environment, organisms that want to access and use the abundant resources stored inside the nest, have to infiltrate into the defensive system.
Nevertheless many organisms (especially arthropods) have succeeded into penetrate the ant nests, that is, they have “broken the code”, interrupting the honest signal transmitted among the ants’ colonies, and becoming in various grade ants’ parasites.
In general, the parasite-host interaction involves an intimate association with host and an unfavorable impact on it (Foitzik 2009). Parasites have evolved several times, in several taxa from free-living ancestors and experimented a continuous implementation of their specialization during their evolution (Poulin 2006).
Parasites can also act as mediators in biological interactions between two or more populations of the same or different species. Price et al. (1986) inferred that the parasite mediation is one of the most important kind of interactions in ecological systems, comparable with the importance that competition, parasitism or mutualism could have. This kind of interaction
4
includes several types of mediation by parasites: i) in a species-species competition parasites could act as agent of interference; ii) parasites could be an instrument of defense for a species against its enemies; iii) consumers could benefit from parasites during the eating processes (Price et al. 1986).
A particular type of parasitic social interaction may refer to social parasites. In this type of parasitism, parasite takes advantage from the interactions between members of social species. Avian brood parasitism is an example: cuckoos and cowbirds lay theirs eggs in nests of different species, and in this manner they avoid the costs of parental cares (Foitzik et al. 2003). Another suitable example is the parasitism on social insects such as ants or termites. In ants in particular, the social parasitism is widely found with a variety of manifestations: xenobiosis, temporary parasitism, permanent parasitism, the latter with or without slavery (Wilson 1971).
Originally the definition of social parasite was referred to ants that parasite other ants (Hölldobler and Wilson 1990), and today is still used in this sense (Foitzik 2001, 2003, 2009); however, from its formulation since now, the term “social parasite” is increasingly used referring also to other organisms (especially arthropods) which live in ant nests, causing various degree of damages to the colony (Hölldobler and Wilson 1990; Barbero et al. 2009).
It’s thought that about 10,000 insects species have evolved as social parasites, and “learned” how to speak the ants’ behavioral, chemical and acoustical languages. Consequently, ants do not attack them; instead in many cases they are actively fed and cared by the ants (Hölldobler and Wilson 1990; Barbero et al. 2009; Thomas et al. 2010). This kind of relationship involved “durable interactions” between parasite and its host, starting a process of co-evolutionary changes between them (Combes 2001).
Thompson (2001) referred to this process as coevolution: “Coevolution is the process of reciprocal evolutionary change between interacting species, driven by natural selection. It is one of the major processes organizing the Earth’s biodiversity into interrelated communities of species”.
Coevolution between parasites and their hosts has been widely studied in many biological systems (May and Anderson 1990; Toft and Karter 1990; Bolen et al. 2000; Gandon 2002). During time, particularly appropriate to explain this peculiar type of coevolution both in animals and plants has revealed the arms races theory (Dawkins and Krebs 1979; Davies et al. 1989; Holub 2001; Foitzik 2003; Maor and Shirasu 2005). In particular Foitzik et al. (2001) showed the evidence of the arms race model in social parasites (ants) and also related it to the local co-adaptation of the populations examined. According to this model, hosts are expected to evolve
resistance against parasites when the parasite pressure is stronger. As a part of the counter adaptation, parasites constantly have to break the host defenses in order to guarantee their survival. It is a never-ending battle between two opponents, which climaxes in adaptation, shaping behaviors, communications and characters of the opponents.
Paussinae
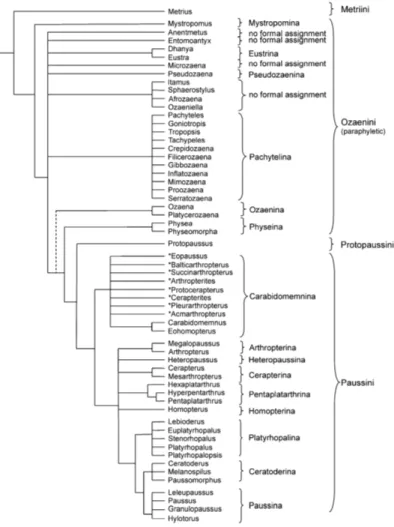
The subfamily Paussinae (Coleoptera: Carabidae) is considered a monophyletic group within Carabidae, divided into five tribes: Metriini, Mystropomini, Ozaenini, Protopaussini and Paussini (Figure 1) (Di Giulio et al. 2003). They are small (2.8-22 mm) and generally brownish, characterized by nocturnal predatory habits. They have chemical defensive glands in adults based on quinones releasing, which give them the appellative of bombardier beetles. Moreover they have a unique type of larva, highly derived and extremely modified, with a U-shaped curved abdomen, and the three last abdominal segments and the urogomphi transformed into a terminal disk (Di Giulio and Vigna Taglianti, 2000; Di Giulio et al. 2003, 2011; Di Giulio and Moore, 2004; Moore and Di Giulio, 2006; Di Giulio 2007; Moore et al. 2011).
Among the five tribes, Metriini (3 species distributed in North America and 1 in China) and Mystropomini (2 Australian endemic species) are considered as basal tribes with free-living predatory habits, Ozaenini (180 species distributed predominantly in Neotopical Region) have mostly free-living lifestyle but some species are associated with ants, whereas Protopaussini (monogeneric tribe with 8 described species, distributed in the Oriental Region) and Paussini (572 species distributed in the Afrotropical Region) are more derived tribes and obligate myrmecophiles (Di Giulio et al. 2003; Geiselhardt et al. 2007; Moore 2008; Moore et al. 2011 Myrmecophily (obligate association with ants) seems to have evolved in the most derived groups of the Paussinae (Protopaussini and Paussini), and in
6
Figure 1. Phylogenetic relationships of Paussinae beetles, based on structural characters. Maked with asterisk are fossil genera (from Geiselhadt et al. 2007).
Paussini
The tribe Paussini is composed by typically tropical and subtropical ant’s parasites: they are rare, and spend most part of their life cycle in hidden ant nests, making them difficult to observe and understand their interaction with ants in the field. Within this tribe only two species show a European distribution: Paussus favieri, Fairmaire 1851 and P. turcicus Frivaldszky von Frivald, 1835. Paussini are obligatory associated with ants’ subfamilies Myrmicinae and Formicinae and considered as social parasites, since they prey on ant broods (Geiselhardt et al. 2007). It seems that evolution of myrmecophilous lifestyle in Paussini have been complex, as suggested by the evolution and regression of trichome systems and other structures (Darlington 1950; Geiselhardt et al. 2007).
Due to their morphological and functional adaptations to myrmecophilous lifestyle, Paussini can be subdivided into the “protective type” and the “symphile type” on the base of their defensive strategies. The former is a type characterized by a compact hard body with smooth surface and retractable appendages; by this way the beetle is protected against the ants’ aggressions. This body shape is also present in other myrmecophilous coleopterans (Rasa 1996; Geiselhardt et al. 2007). Slim body, with long thin appendages and the presence of many trichomes, characterizes the “symphile type” that is common to most derived taxa, and denotes beetles completely integrated in the ant nests (Geiselhardt et al. 2007).
The tribe shows further fascinating morphological myrmecophilous adaptations: antennae very modified in a variety of shapes (flattened, enlarged, lenticular, globular, concave, elongate, etc.) (Figure 2) and with antennal joints often reduced, compact and slim bodies, and elongated legs. Moreover on the antennae, abdomen, and prothorax some “myrmecophilous organs” are present, composed of trichomes (specialized tufts of hairs) and connected to exocrine glands releasing some chemicals (of still unknown composition) that result attractive and appeasing for ants (Darlington 1950; Geiselhardt et al. 2007; Di Giulio et al. 2011).
8
Figure 2. Morphological variability in Paussini antennal clubs (SEM micrographs by A. Di Giulio).
Paussus favieri.
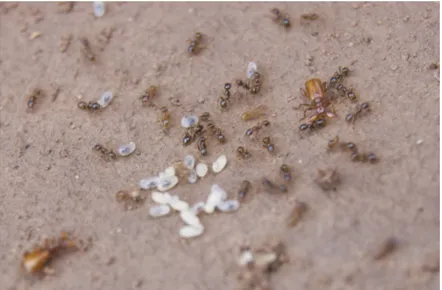
Paussus favieri Fairmaire, 1851 lives in nests of the polygynic ant Pheidole pallidula (Nylander, 1849) (Figure 3), and is one of the two
Paussini species present also in Europe. It is an Atlanto-Mediterranean species and its distribution range comprises Algeria, France, Morocco, Spain, Portugal and Tunisia (Casale et al. 1982; Di Giulio et al. 2011). Some specimens from Sardinia and Sicily (Casale et al. 1982) and one from Corsica (Zerche, 1990) are present in museum collections, however no specimen was found there during the last 100 years (Di Giulio et al. 2011).
Due to its rarity and bizarre structural and morphological adaptations to myrmecophilous life style, this species has attracted the interest of collectors and researchers since the past 150 years.
Escherich (1899) made the first ethological observations of P. favieri in captivity describing some interactions between the beetles and their hosts (e.g. grooming, dragging, and grabbing), and on the acceptance of the beetle in the nest. Le Masne (1961a,b,c) later, focused his observations on the predatory strategy (the beetle feeding on the ants brood), and on the mechanisms of acceptance of the beetle. According to both Echerich (1899) and Le Masne (1961 a,b,c) P. favieri is promptly accepted and fully
integrated in the nest, without ostility. These observations were recently confirmed and implemented by the sexual and cleaning behavior by Maurizi et al. (2012).
The morphology of P. favieri can be described as follows: antennal clubs with subtriangular shape, composed by three joints: subrectangular scape, small rounded pedicel and flagellum represented by a unique “antennal club”; analysis of the antennae at scanning electron microscope (SEM) revealed the presence of different types of modified sensilla and glandular pores of different sizes that represent the openings of cuticular ducts; head is shiny and covered with a long spiny trichome in the middle; prothorax is constricted in the middle and covered with bristles; elytrae are trimmed along the edges and covered with branched bristles (Westwood 1850; Di Giulio et al. 2009, 2012).
Apart from the number of past and recent studies, many gaps on the life history, biology and morphological variations of P. favieri needed to be filled.
Figure 3. Two specimens of Paussus favieri in a nest of Pheidole pallidula with eggs, larvae and workers of the host ant (photo by R. Bravi).
10
Paussus cridae
Paussus cridae Gestro 1915 is reported from the west part of Central
Africa (Angola, Cameroun, Congo Republic, Democratic Republic of Congo - former Zaire). Moreover it is a host of ants of unidentified Pheidole species (Luna de Carvalho, 1989).
From a preliminary analysis, it seems to be very similar in morphology (A. Di Giulio in verbis) to its closest relative Paussus spinicoxis Westwood 1850. According to Luna de Carvalho (1989), the only character that separates the two species is the antennal club: slightly shorter and less convex in P. spinicoxis. However we observed that there is a morphological cline when long series of well geographically distributed specimens are considered.
P. spinicoxis is reported to occupy the eastern part of Central Africa
(Botswana, Democratic Republic of Congo, Kenya, Mozambique, Ruanda, South Africa, Zambia, Zimbabwe); finally, it is a host of the ant species
Pheidole megacephala atrox (Luna de Carvalho, 1989).
The two species potentially occupy ant nests of the same host, they have a very close distribution range, and finally they are reported as sympatric in Democratic Republic of Congo (Luna de Carvalho, 1989).
Nagel (1983) assigned both species to the “Paussus spinicoxis” group, and Luna de Carvalho (1989) considered the two species belonging to the same “super-species”. For this reason when investigating the taxonomical validity of the P. cridae species it is not possible to exclude the species P.
spinicoxis from the analyses.
Very few studies have been conducted on these species, and due to their morphological similarities and their vicinity in the distribution area, the debate on their species status could be considered still open.
Moreover P. cridae and P. spinicoxis are widely represented in the entomological collections of the European museums, ongoing to be misidentified, and their natural status requires additional studies.
Aim and objectives
Aim of the present Ph.D. thesis is to contribute to knowledge about the still poorly known tribe Paussini, focusing on morphology of the model species: Passus favieri, P. cridae, and P. spinicoxis.
1. To analyze and describe the morphological variability of the beetle
Paussus favieri, in order to depict and describe its geographical
variability in its distribution range. We perform this approach analyzing several parts of the whole body of the two species. Several W-Mediterranean populations are studied, representative of its main distribution range;
2. To investigate through a morphological approach the differences between the described species group Paussus cridae and P.
spinicoxis, in order to contribute to the debate about their taxonomic
status. We perform this approach analyzing several parts of the whole body of the two species. Several populations, representative of their main African distribution range are studied;
3. To describe the morphological variability of the species Paussus
cridae and P. spinicoxis, in their distribution range, in order to depict
and assess their geographical variation.
4. To investigate how the selective pressure operate on the beetles by the ants, could influence the morphological variability, especially on the structures most involved in intraspecific interactions (principally antennal clubs and head), upon the light of coevolutionary myrmecophilous interactions.
CHAPTER 1 1) Introduction
Coevolution is reported as the evolution among two or more interacting species, and is a dynamic process that reshapes the interactions among species over the time and over the geographic landscapes (Thompson 2009). This kind of evolutionary force is particularly strong in the parasite-host interactions. In this way parasites lead to strong evolutionary interactions with their hosts, often reducing the fitness of the hosts. This strong selective pressure causes a counter-adaptation in the host, leading to an evolutionary arms race between parasite and its host (Dawkins and Krebs 1979). This is particularly true in ant nest parasites (Foitzik et al. 2001, 2003, 2009).
Ant nests represent a great supply in terms of resources (food, ants, brood, waste materials etc.), and they can be viewed as stable environments. For these reasons, ant nests are very attractive for a large number of organisms, many of which establishing various types of relationships: from commensalism to selective predation, mutualism, and parasitism (Maurizi et al. 2012). Ant parasites represent about 10% of known myrmecophilous insects (considered to be ~ 10,000 species) and most of them belong to the families Coleoptera, Lepidoptera, Orthoptera, and Diptera (Thomas and Settle 2004).
Members of the tribe Paussini (Coleoptera, Carabidae, Paussini) are ground myrmecophilous beetles considered to be ant nest parasites, generally associated with the ants’ subfamilies Myrmicinae (that comprise the genus Pheidole) and Formicinae (Geiselhardt et al. 2007). Due to their unique morphological adaptations to myrmecophily (e.g. myrmecophilous organs, very modified antennal clubs and bodies) the study of Paussini is very challenging, mostly for the higher morphological variability inside the tribe.
Within Paussini the subtribe Paussina comprises on the whole 12 genera and 29 subgenera, and all are obligate myrmecophiles (Di Giulio et al. 2003; Lorenz 2005; Geiselhardt et al. 2007; Moore 2008; Moore et al. 2011).
Paussini have been extensively studied from a taxonomic point of view, and recently many are the researches concerning their life cycle and their interactions with their hosts (Darlington 1950; Nagel 1987, 2003; Luna de Cravalho 1986; Di Giulio et al. 2003, 2009, 2001; Maurizi et al. 2011, 2012), but the majority of the studies concern the species Paussus favieri, a relatively abundant species with an Atlanto-Mediterranean distribution.
14
2) Morphological variation in Paussus favieri.1
I. Introduction
Despite the rarity of Paussinae species, Paussus favieri Fairmaire, 1851 is quite common in northern Africa, and one of the two species present also in Europe (the other one is Paussus turcicus Frivaldszky von Frivald, 1835) (Figure 1.1). It is an Atlanto-Mediterranean species and its distribution range comprises Algeria, France, Morocco, Portugal, Spain and Tunisia (Casale Portugal 1982; Di Giulio et al. 2011). Among this species some authors found an intraspecific variability (A. Di Giulio personal observation), probably due to the partial geographic isolation the ant nest offer.
Although many studies investigate on P. favieri, they are for the majority about the behaviour and the interactions with its host Pheidole pallidula, or regard the fine structural morphology of specific structures as antennal clubs or head (Di Giulio et al. 2009, 2012; Maurizi et al. 2012); no study regarded instead the analysis and description of the morphological variability of P.
favieri.
The aim of the present study is to analyze and describe the morphological variability within and among populations (Algeria, France, Morocco, Spain) of Paussus favieri, located among the distribution range of the species, investigated with a geometric morphometric approach.
1 This work corresponds to the paper: Bravi R., Scalici M., Klingenberg C.P., Di Giulio A.
Morphological variation in Paussus favieri. In prep.
Figure 1.1. Paussus favieri (photo by A. Di Giulio).
II. Results
Antennal clubs
Canonical Variate Analysis (CVA) showed that significative differences exist between right and left antennal clubs (Mahalanobis distance = 4.63, P < 0.0001; Procrustes distance = 0.032, P < 0.0001) and they are not influenced by sexual dimorphism (Mahalanobis distance = 0.61, P = 0.64; Procrustes distance = 0.007, P = 0.58). ANOVA test confirmed the existence of left-right differences for both size and shape in the antennal clubs (for size Sums of Squares = 1.83, Means of Squares = 1.83, P < 0.0001; for shape Sums of Squares = 0.041, Means of Squares = 0.0023, P < 0.0001). Concerning the shape variation, Principal Component Analysis (PCA) analysis showed that the majority of the variation is due to the firsts four PC components (76.93% for the right antennal club, 78.27% for the left antennal club), with each principal component (PC) that account for no more than 37% of the total shape variation (for right antennal club PC1 + PC2 + PC3 +
16
PC4 = 36.93% + 19.35% + 10.80% + 9.85%; for left antennal club PC1 + PC2 + PC3 + PC4 = 37.02% + 17.55% + 13.47% + 10.24%) (Figure 1.2). Finally CVA analysis showed that significative differences between the four populations analyzed emerged, and were highest for the Moroccan population (Table 1.1).
Figure 1.2. Decomposition of shape variation in left and right antennal clubs. The firsts four principal components (PCs) of shape variation are shown. For each PC the diagrams show the shapes that correspond to scores -1.0 (on the left, for both left and right antennal clubs) or +1.0 (on the right, for both left and right antennal clubs).
Head
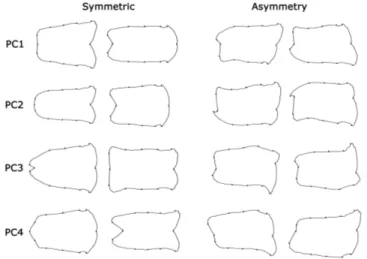
CVA analysis didn’t show the existence of sexual dimorphism (Mahalanobis distance = 0.51, P = 0.70; Procrustes distance = 0.20, P = 0.32). Shape and size variation were assessed using ANOVA and MANOVA tests for both symmetric and asymmetry component of shape variation. ANOVA test showed a high morphological variation in shape in the whole sample (Sums of Squares = 0.22, Means of Squares = 0.00087, P = 0.001); in particular variation between populations for both shape and size were evident (for size Sums of Squares = 0.010, Means of Squares = 0.0033, P = 0.018; for shape Sums of Squares = 0.026, Means of Squares = 0.0017, P = 0.018). MANOVA test confirmed the differences between populations for symmetric component of the shape variation, but not for asymmetry (for symmetric component Pillai trace = 0.57, P = 0.0072; for asymmetry component Pillai trace = 0.25, P = 0.61). Then we used PCA analysis to quantify the shape variation. The firsts three PCs were sufficient to explain the majority of the variation for both symmetric and asymmetry components (for symmetry component PC1 + PC2 + PC3 = 89.78%; for asymmetric component PC1 + PC2 + PC3 = 95.28%) (Figure 1.3). Finally CVA analysis were used to assess and quantify the differences emerged between population, enlighten that majority of the differences were found in the Moroccan population, but differences also emerged from the Algerian population (Table 1.1).
Figure 1.3. Decomposition of shape variation in head. The firsts three PCs for each category of symmetry or asymmetry are shown. For each PC the diagrams show the shapes that correspond to scores -1.0 (on the left) or +1.0 (on the right) for both symmetric and asymmetry components of shape variation.
18 Pronotum
CVA analysis showed that morphological variation of pronotum was not influenced by sexual dimorphism (Mahalanobis distance = 0.46, P = 0.58; Procrustes distance = 0.025, P = 0.21). ANOVA test showed the presence of morphological variation in the whole sample (Sums of Squares = 0.51, Means of Squares = 0.0013, P < 0.0001), and differences high for shape variation (Sums of Squares = 0.11, Means of Squares = 0.008, P < 0.0001) and less evident for size (Sums of Squares = 0.011, Means of Squares = 0.0036, P = 0.06). MANOVA test confirmed the presence of morphological variation in both symmetric and asymmetry components of shape variation (for symmetric component Pillai trace = 0.90, P < 0.0001; for asymmetry component Pillai trace = 0.59, P < 0.0001). PCA analysis then, was used for describe the shape variation. The firsts three PCs accounted for the majority of variation for both symmetric and asymmetry components (for symmetric component PC1 + PC2 + PC3 = 88.58%; for asymmetry component PC1 + PC2 + PC3 = 93.89%) (Figure 1.4). Finally CVA was used to assess morphological differences between populations, and the Moroccan one emerged as the population more different from the others (Table 1.1).
Figure 1.4. Decomposition of shape variation in pronotum. The firsts three PCs for each category of symmetry or asymmetry are shown. For each PC the diagrams show the shapes that correspond to scores -1.0 (on the left) or +1.0 (on the right) for both symmetric and asymmetry components of shape variation.
Elytrae
CVA test for sexual dimorphism revealed there were no differences between sexes (Mahalanobis distance = 0.76, P = 0.80; Procrustes distance = 0.0081, P = 0.61). We examined then the morphological variation in the entire sample, which resulted high and significative (Sums of Squares = 0.52, Means of Squares = 0.0011, P < 0.0001). Differences emerged between populations for shape (Sums of Squares = 0.0051, Means of Squares = 0.00017, P = 0.035) but not for size (Sums of Squares = 0.65, Means of Squares = 0.022, P = 0.56), and were not confirmed by MANOVA test (for symmetric component Pillai trace = 0.79, P = 0.087; for asymmetry component Pillai trace = 0.53, P = 0.67). Shape variation for symmetric and asymmetry components was described by PCA analysis. In both cases the firsts four PCs were sufficient to explain the majority of shape variation (for symmetry component PC1 + PC2 + PC3 + PC4 = 94.19%; for asymmetric component PC1 + PC2 + PC3 + PC4 = 89.30%) (Figure 1.5). Finally differences between populations were assessed with CVA, and Moroccan population emerged also in this case as the most morphologically different from other populations (Table 1.1.1 and Figure 1.1.5).
Figure 1.5. Decomposition of shape variation in elytrae. The firsts three PCs for each category of symmetry or asymmetry are shown. For each PC the diagrams show the shapes that correspond to scores -1.0 (on the left) or +1.0 (on the right) for both symmetric and asymmetry components of shape variation.
20
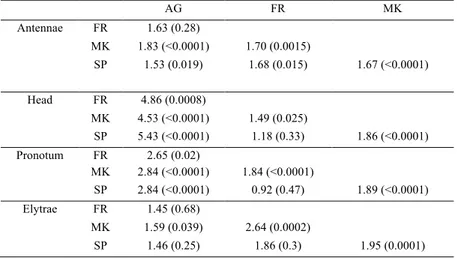
Table 1.1. Pairwise comparisons by the canonical variate analysis performed between the studied four populations for all the investigated body parts. Results are reported as Mahalanobis distance (and
p-values), after 10000 permutation runs. AG = Algeria, FR = France, MK = Morocco, SP = Spain.
AG FR MK Antennae FR 1.63 (0.28) MK 1.83 (<0.0001) 1.70 (0.0015) SP 1.53 (0.019) 1.68 (0.015) 1.67 (<0.0001) Head FR 4.86 (0.0008) MK 4.53 (<0.0001) 1.49 (0.025) SP 5.43 (<0.0001) 1.18 (0.33) 1.86 (<0.0001) Pronotum FR 2.65 (0.02) MK 2.84 (<0.0001) 1.84 (<0.0001) SP 2.84 (<0.0001) 0.92 (0.47) 1.89 (<0.0001) Elytrae FR 1.45 (0.68) MK 1.59 (0.039) 2.64 (0.0002) SP 1.46 (0.25) 1.86 (0.3) 1.95 (0.0001) III. Discussion
The present study aimed to describe the morphological variability of P.
favieri. In particular we took for the analyses four different populations,
quite representative of the whole distribution range of this species.
All results revealed the presence of a high morphological variability among populations, especially due to the antennal clubs, even if all other body parts presented a certain morphological variability as well.
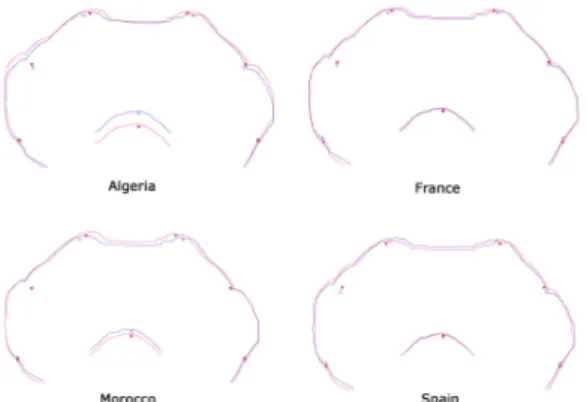
Regarding the antennal clubs morphological differences emerged in both size and shape. In particular the antennal clubs presented a variation mostly associated with the length of the antennal club that passed from elongated shape to a more rounded shape. This is well evident in the Moroccan population, emerged as the most different from our analyses: the apical part of both left and right antennal clubs is more elongate, even best distinguishable in the left antennal club than in the right one (Figure 1.6).
Figure 1.6. Average shape variation in left and right antennal clubs in different population analyzed. Shape deformation is shown in red, whereas starting shapes are shown in blue.
Regarding the head, morphological variations resulted associated to the structure on the whole, and the higher variation are related with the eyes and the upper part of the head, the latter having the higher morphological variability. The Moroccan population emerged from the analyses as the one with majority of variation, even if the shape modifications were not so evident as in the last cases. Moreover some differences emerged for the head also in the Algerian population, even les subtle than the Moroccan ones (Figure 1.7).
Figure 1.7. Average shape variation in head, in different population analyzed. Shape deformation is shown in red, whereas starting shape is shown in blue.
22
Pronotum resulted in quite high morphological variability, the variations regard the structure on the whole, and goes from a larger to quite tiny shape and the modifications involved the upper or the lower part, but not both in the same time. Regarding differences between populations, even in this case the Moroccan population resulted the one with the highest variability and the pronotum assumes a short and large form (Figure 1.8).
Figure 1.8. Average shape variation in pronotum in different population analyzed. Shape deformation is shown in red, whereas starting shapes are shown in blue.
Finally the elytrae resulted as the structures less under variation, with a certain morphological variability mostly associated to the upper and lower extremities of the abdomen. Regarding the Moroccan population emerged as the mostly different from the others even in this case, with the majority of shape variation concentrated at the extremities of the structure (Figure 1.9).
Figure 1.9. Average shape variation in elytrae in different population analyzed. Shape deformation is shown in red, whereas starting shapes are shown in blue.
On the whole from our analyses a certain morphological variability emerged. It was bigger in the antennal clubs, the organs mostly involved in the ant-beetle interactions, and less pronounced in the other body parts. Regarding the intra-populations variability, the latter appeared as present and mostly due to the Moroccan population. The specimens from the Moroccan population were from the Atlas Mountains; the ant nests were at ~2000 m (a.s.l.), whereas the other populations’ specimens were caught from 600 m (a.s.l.) up to 1000 m (a.s.l.). This geographically differences could be revealed in the morphological differences emerged from our analyses. The high morphological variability assumed among the population we examined was confirmed with the approach of geometric morphometric, and although solving some questions, our analysis raise up other questions about the evolutionary interpretation of this so high variability. Further studies are necessary to solve the question.
24
3) Morphological variation in Paussus cridae.2
I. Introduction
Paussus cridae (Figure 1.10) is an African species, very close in
morphology to its relative P. spinicoxis, with an apparently morphological cline that makes the species not easy to distinguish one another (A. Di Giulio personal observation). The only taxonomical character for distinguish the two species is the morphology of the antennal club (Luna de Carvalho 1989).
The African species have attracted many researchers (Nagel 1983, 1987; Luna de Carvalho 1989; Geiselhardt et al. 2007), but due to their rarity, and to particular political condition of many countries in the distribution range, the African species are still lacking of studies.
Figure 1.10. Paussus spinicoxis (photo by R. Bravi).
2 This work corresponds to the paper: Bravi R., Scalici M., Klingenberg C.P., Di Giulio A.
Very few studies have been conducted on P. cridae and P. spinicoxis, and due to their morphological similarities, their vicinity in the distribution area, the debate on their species status is to be considered still open.
The aim of present study is to contribute to the debate on the taxonomical status of the two species from a morphological point of view. In particular we were interested in study the whole body, subdivided in five different anatomical parts (left and right antennal clubs, head, pronotum and elytrae), and analyzed them with a geometric morphometric approach.
26
Results
Antennal clubs
Canonical Variate Analysis (CVA) analysis showed the existence of subtle differences between species (Mahalanobis distance = 1.88, P < 0.0001; Procrustes distance = 0.029, P < 0.0001), confirmed by the ANOVA (for size Sums of Squares = 0.67, Means of Squares = 0.67, P < 0.0001; for shape Sums of Squares = 0.013, Means of Squares = 0.00075, P < 0.0001) but not by MANOVA (Pillai trace = 0.64, P = 0.12). Given these results the two species were analyzed separately.
Paussus cridae
CVA showed that certain differences exist between right and left antennal clubs (Mahalanobis distance = 28.83 P < 0.0001; Procrustes distance = 0.021, P = 0.25) and they are shortly influenced by sexual dimorphism (Mahalanobis distance = 4.89, P < 0.0001; Procrustes distance = 0.020, P = 0.38). ANOVA test confirmed the existence of left-right differences for size but not for shape (for size Sums of Squares = 1.46, Means of Squares = 1.46, P < 0.0001; for shape Sums of Squares = 0.0022, Means of Squares = 0.00012, P = 0.12). These differences were not influenced by sexual dimorphism (Sums of Squares = 0.014, Means of Squares = 0.014, P = 0.14) or by populations’ differences (Sums of Squares = 0.007, Means of Squares = 0.007, P = 0.28)
Concerning the shape variation, Principal Component Analysis (PCA) showed that the majority of the variation is due to the firsts three PC components (75.65% for the right antennal club, 80.78% for the left antennal club), with each other principal component (PC) that account for no more than 14% of the total shape variation (for right antennal club PC1 + PC2 + PC3 = 43.06% + 20.07% + 12.52%; for left antennal club PC1 + PC2 + PC3 = 47.80% + 18.09% + 14.89%) (Figure 1.11).
Figure 1.11. Decomposition of shape variation in left and right antennal clubs of P. cridae. The firsts three principal components (PCs) of shape variation are shown. For each PC the diagrams show the shapes that correspond to scores -1.0 (on the left, for both left and right antennal clubs) or +1.0 (on the right, for both left and right antennal clubs).
Paussus spinicoxis
CVA showed that certain differences exist between right and left antennal clubs (Mahalanobis distance = 2.61 P < 0.0001; Procrustes distance = 0.012, P = 0.23) and they are influenced by sexual dimorphism (Mahalanobis distance = 2.89, P < 0.0001; Procrustes distance = 0.035, P < 0.0001). ANOVA test confirmed the existence of left-right differences for both size and shape (for size Sums of Squares = 2.90, Means of Squares = 2.90, P < 0.0001; for shape Sums of Squares = 0.0025, Means of Squares = 0.00014, P = 0.12). These differences were influenced by sexual dimorphism (for size Sums of Squares = 1.31, Means of Squares = 0.65, P < 0.0001; for shape Sums of Squares = 0.025, Means of Squares = 0.0007, P < 0.0001) and partially by populations’ differences (for size Sums of Squares = 0.69, Means of Squares = 0.12, P = 0.0024; for shape Sums of Squares = 0.019, Means of Squares = 0.00017, P = 0.0018).
Concerning the shape variation, Principal Component Analysis (PCA) analysis showed that the majority of the variation is due to the firsts three PC components (75.65% for the right antennal club, 73.32% for left antennal club), with each other principal component (PC) that account for no more than 14% of the total shape variation (for right antennal club PC1 + PC2 + PC3 = 43.06% + 20.07% + 12.52%; for left antennal club PC1 + PC2 + PC3 = 40.77% + 20.74% + 11.79% + (Figure 1.12).
28
Figure 1.12. Decomposition of shape variation in left and right antennal clubs of P. spinicoxis. The firsts three principal components (PCs) of shape variation are shown. For each PC the diagrams show the shapes that correspond to scores -1.0 (on the left, for both left and right antennal clubs) or +1.0 (on the right, for both left and right antennal clubs).
Head
CVA analysis showed the existence of subtle differences between species (Mahalanobis distance = 1.46, P = 0.052; Procrustes distance = 0.0038, P = 0.023), partially confirmed by the ANOVA (for size Sums of Squares = 0.018, Means of Squares = 0.018, P = 0.01; for shape Sums of Squares = 0.011, Means of Squares = 0.022, P = 0.013) and MANOVA (for symmetric component Pillai trace = 0.49, P = 0.0042; for asymmetry component Pillai trace = 0.16, P = 0.49). Given these results the two species were analyzed separately.
Paussus cridae
CVA showed a subtle indication about the presence of sexual dimorphism (Mahalanobis distance = 3.85, P = 0.061; Procrustes distance = 0.029, P = 0.56). Shape and size variation were assessed using ANOVA and MANOVA tests for both symmetric and asymmetry component of shape variation. ANOVA test showed a certain morphological variation in shape in the whole sample (Sums of Squares = 0.024, Means of Squares = 0.00069, P<0.0001), due nor to variation between populations (for shape Sums of Squares = 0.044, Means of Squares = 0.00088, P = 0.29; for size Sums of Squares = 0.00, Means of Squares = 0.00, P = 0.98), neither to a strong signal of sexual dimorphism (for size Sums of Squares = 0.0031, Means of Squares = 0.0031, P = 0.18; for shape Sums of Squares = 0.031, Means of
Squares = 0.00062, P = 0.49). MANOVA test confirmed the absence of differences between populations (for symmetric component Pillai trace = 0.81, P = 0.24; for asymmetry component Pillai trace = 0.67, P = 0.46) and sexes (for symmetric component Pillai trace = 0.90, P = 0.10; for asymmetry component Pillai trace = 0.57, P = 0.61).
Then we used PCA analysis to quantify the shape variation. The firsts two PCs were sufficient to explain the majority of the variation for both symmetric and asymmetry components (for symmetry component PC1 + PC2 = 96.53% = 70.93% + 25.60%; for asymmetric component PC1 + PC2 = 83.24% = 55.20% + 28.05%) (Figure 1.13).
Figure 1.13. Decomposition of shape variation in head in P. cridae. The firsts three PCs for each category of symmetry or asymmetry are shown. For each PC the diagrams show the shapes that correspond to scores -1.0 (on the left) or +1.0 (on the right) for both symmetric and asymmetry components of shape variation.
Paussus spinicoxis
CVA showed a subtle indication about the presence of sexual dimorphism (Mahalanobis distance = 1.65, P = 0.039; Procrustes distance = 0.029, P = 0.16). Shape and size variation were assessed using ANOVA and MANOVA tests for both symmetric and asymmetry component of shape variation. ANOVA test showed a certain morphological variation in shape in the whole sample (Sums of Squares = 0.043, Means of Squares = 0.00042, P<0.0001), due to certain variation between populations (for shape Sums of Squares = 0.046, Means of Squares = 0.0013, P <0.0001; for size Sums of Squares = 0.035, Means of Squares = 0.0049, P = 0.11), but not to sexual dimorphism (for size Sums of Squares = 0.0031, Means of Squares = 0.00069, P = 0.77; for shape Sums of Squares = 0.0049, Means of Squares = 0.00049, P = 0.32). MANOVA test confirmed the absence of differences
30
between populations (for symmetric component Pillai trace = 1.65, P = 0.067; for asymmetry component Pillai trace = 1.28, P = 0.43) and sexes (for symmetric component Pillai trace = 0.51, P = 0.30; for asymmetry component Pillai trace = 0.31, P = 0.76).
Then we used PCA analysis to quantify the shape variation. The firsts two PCs were sufficient to explain the majority of the variation for both symmetric and asymmetry components (for symmetry component PC1 + PC2 = 75.73% = 41.86% + 33.86%; for asymmetric component PC1 + PC2 = 76.59% = 53.08% + 23.52%) (Figure 1.14).
Figure 1.14. Decomposition of shape variation in head in P. spinicoxis. The firsts three PCs for each category of symmetry or asymmetry are shown. For each PC the diagrams show the shapes that correspond to scores -1.0 (on the left) or +1.0 (on the right) for both symmetric and asymmetry components of shape variation.
Pronotum
CVA analysis showed the existence of certain differences between species (Mahalanobis distance = 1.89, P < 0.0001; Procrustes distance = 0.019, P = 0.0016), partially confirmed by the ANOVA (for size Sums of Squares = 0.058, Means of Squares = 0.058, P = 0.06; for shape Sums of Squares = 0.062, Means of Squares = 0.00089, P = 0.0009) and MANOVA (for symmetric component Pillai trace = 0.54, P = 0.0002; for asymmetry component Pillai trace = 0.16, P = 0.49). Given these results the two species were analyzed separately.
Paussus cridae
Sample size comprised only one population, so we didn’t perform the analyses on populations differences.
CVA showed a subtle indication about the presence of sexual dimorphism (Mahalanobis distance = 6.18, P < 0.0001; Procrustes distance = 0.020, P = 0.041). Shape and size variation were assessed using ANOVA and MANOVA tests for both symmetric and asymmetry component of shape variation. ANOVA test showed a certain morphological variation for both shape and size in the whole sample (for shape Sums of Squares = 0.0093, Means of Squares = 0.00015, P<0.0001; for size Sums of Squares = 0.049, Means of Squares = 0.0055, P = 0.0054), and a very subtle signal of sexual dimorphism (for size Sums of Squares = 0.030, Means of Squares = 0.030, P = 0.046; for shape Sums of Squares = 0.0019, Means of Squares = 0.00027, P = 0.10). MANOVA test confirmed the presence of subtle sexual dimorphism (for symmetric component Pillai trace = 0.96, P = 0.035; for asymmetry component Pillai trace = 0.60, P = 0.71).
Due to the fact we found a certain morphological variability we performed PCA analysis to quantify the shape variation. The firsts two PCs were sufficient to explain the majority of the variation for both symmetric and asymmetry components (for symmetry component PC1 + PC2 = 80.04% = 50.80% + 29.24%; for asymmetric component PC1 + PC2 = 73.51% = 37.70% + 35.81%) (Figure 1.15).
Figure 1.15. Decomposition of shape variation in pronotum in P. spinicoxis. The firsts three PCs for each category of symmetry or asymmetry are shown. For each PC the diagrams show the shapes that correspond to scores -1.0 (on the left) or +1.0 (on the right) for both symmetric and asymmetry components of shape variation.
32
Paussus spinicoxis
CVA showed the presence of sexual dimorphism (Mahalanobis distance = 1.77, P < 0.0001; Procrustes distance = 0.027, P < 0.0001). Shape and size variation were assessed using ANOVA and MANOVA tests for both symmetric and asymmetry component of shape variation. ANOVA test showed a certain morphological variation in size and shape in the whole sample (for size Sums of Squares = 0.57, Means of Squares = 0.018, P<0.0001; for shape Sums of Squares = 0.057, Means of Squares = 0.00026, P<0.0001), a subtle variation between populations (for shape Sums of Squares = 0.019, Means of Squares = 0.00040, P = 0.024; for size Sums of Squares = 0.18, Means of Squares = 0.025, P = 0.23), and present but little sexual dimorphism on shape (for size Sums of Squares = 0.025, Means of Squares = 0.013, P = 0.51; for shape Sums of Squares = 0.018, Means of Squares = 0.0013, P < 0.0001). MANOVA test partially confirmed the absence of differences between populations (for symmetric component Pillai trace = 1.92, P = 0.0071; for asymmetry component Pillai trace = 1.03, P = 0.87) and sexes (for symmetric component Pillai trace = 0.89, P = 0.0020; for asymmetry component Pillai trace = 0.42, P = 0.47).
Then we used PCA analysis to quantify the shape variation. The firsts three PCs were sufficient to explain the majority of the variation for both symmetric and asymmetry components (for symmetry component PC1 + PC2 + PC3 = 80.39% = 49.44% + 18.77% + 12.18%; for asymmetric component PC1 + PC2 + PC3 = 82.38% = 47.03% + 22.76% + 12.59%) (Figure 1.16).
Figure 1.16. Decomposition of shape variation in pronotum in P.cridae. The firsts three PCs for each category of symmetry or asymmetry are shown. For each PC the diagrams show the shapes that correspond to scores -1.0 (on the left) or +1.0 (on the right) for both symmetric and asymmetry components of shape variation.
Elytrae
CVA analysis didn’t show the differences between species (Mahalanobis distance = 1.13, P = 0.35; Procrustes distance = 0.0075, P = 0.76), partially confirmed by the ANOVA (for size Sums of Squares = 2.20, Means of Squares = 2.20, P < 0.0001; for shape Sums of Squares = 0.062, Means of Squares = 0.00089, P = 0.0009) and totally by MANOVA (for symmetric component Pillai trace = 0.22, P = 0.72; for asymmetry component Pillai trace = 0.20, P = 0.79). Given these results the two species were analyzed together.
CVA showed a very subtle presence of sexual dimorphism (Mahalanobis distance = 1.35, P = 0.043; Procrustes distance = 0.017, P = 0.21).Shape and size variation were assessed using ANOVA and MANOVA tests for both symmetric and asymmetry component of shape variation. ANOVA test showed a certain morphological variation for shape in the whole sample (Sums of Squares = 0.060, Means of Squares = 0.00018, P < 0.0001), and no signal of sexual dimorphism (for size Sums of Squares = 0.11, Means of Squares = 0.057, P = 0.56; for shape Sums of Squares = 0.00078, Means of Squares = 0.000039, P = 0.99). MANOVA test completely confirmed the
34
absence of sexual dimorphism (for symmetric component Pillai trace = 0.34, P = 0.95; for asymmetry component Pillai trace = 0.31, P = 0.97).
Then PCA analysis was used to quantify the shape variation. The firsts two PCs were sufficient to explain the majority of the variation for both symmetric and asymmetry components (for symmetry component PC1 + PC2 = 94.47% = 82.70% + 11.77%; for asymmetric component PC1 + PC2 = 81.88% = 56.41% + 25.48%) (Figure 1.17).
Figure 1.17. Decomposition of shape variation in elytrae. The firsts two PCs for each category of symmetry or asymmetry are shown. For each PC the diagrams show the shapes that correspond to scores -1.0 (on the left) or +1.0 (on the right) for both symmetric and asymmetry components of shape variation.
II. Discussion
The present study aimed to describe the morphological variability of the two species P. cridae and P. spinicoxis, helping to clarify their taxonomic status.
These two species emerged as controversial from literature: some authors define them belonging to a subgenus, others to a species group (Luna de Carvalho 1989; Nagel 1983, 1987, 2003), making not easy to identify their taxonomic status. Additionally, the two species occupy near distribution areas, and are sympatric in Democratic Republic of Congo (Luna de Carvalho 1989).
Moreover, the specimens we analyzed were all identified as P. spinicoxis, even they came from areas identified as distribution areas of both species, evidence this of the difficulties in taxonomically distinguish the two species. Hence, our analyses were made on different populations, quite representative of the whole distribution range of the two species, and
additionally a population in their geographical contact point in Democratic Republic of Congo.
From the analyses emerged a high morphological variability within the sample, not coherent with the taxonomic species identification.
Regarding the antennal clubs, differences between the two species emerged. The shape passes from rounded and bigger in P. cridae, to little more elongate in P. spinicoxis (Figure 1.18).
Figure 1.18. Average shape variation in left and right antennal clubs. Shape deformation is shown in red, whereas starting shapes are shown in blue. All the shape changes are exaggerated 5-fold for better visibility. a) P. cridae; b) P. spinicoxis.
Regarding the head, very subtle differences emerged between species, and were more statistical than morphological: the shapes were not so different in the two species, even if the majority of variation is associated with P. cridae (Figure 1.19).
Figure 1.19. Average shape variation in head. Shape deformation is shown in red, whereas starting shapes are shown in blue. All the shape changes are exaggerated 5-fold for better visibility. a)
36
Pronotum showed to be morphologically different in the two species and also in this case the difference were most statistical than morphological. (Figure 1.20).
Figure 1.20. Average shape variation in pronotum. Shape deformation is shown in red, whereas starting shapes are shown in blue. All the shape changes are exaggerated 5-fold for better visibility. a)
P. cridae; b) P. spinicoxis.
The elytrae resulted from the analyses the part less differentiated, and didn’t show differences between the two species analyzed, even if a subtle variation in shape in the terminal part of the elytrae could be detected (Figure 1.21).
Finally all differences emerged from the analyses are indicative of a high similarity between the two species, more than of a separation between them. In fact the morphological variation emerged was not present in all structures analyzed, and where present, not all structures showed the same grade of differentiation between the two species.
Figure 1.1. Average shape variation in elytrae. Shape deformation is shown in red, whereas starting shapes are shown in blue. All the shape changes are exaggerated 5-fold for better visibility. a)
Results showed a certain morphological variability between the two described species, with the exception of the elytrae, in which no differences had been found. Regarding the populations’ differences, a certain variability emerged, but not referred to a population in particular. Interestingly the Angolan population, the one denoted as belonging to P. cridae species, seems to be not separated to the other populations, reinforcing the findings of a certain morphological similarities between the two species. At the same time the differences emerged showed high morphological variability within
P. spinicoxis, mostly due to the antennal clubs. This is a part intensively
used in ant-beetle interactions, and resulted very modified within all members of the subfamily Paussinae (Geiselhardt et al. 2007; Di Giulio et al. 2009; Maurizi et al. 2012). Moreover previous analyses under the scanning electron microscope (S.E.M.) revealed the presence of sensilla and pores similar to thos already described in P. favieri (Di Giulio personal observation; Di Giulio et al. 2009, 2011). This observation let us to conclude that in the species P. cridae and P. spinicoxis antennae are the part most involved in interspecific interactions and consequently they are the part highly under coevolutionary pressures.
On the whole, variation among populations was higher than the one expected from the two species, indicating a very high morphological variability, but not sufficient to distinguish and separate two differen species. The results we obtained brought us to the conclusion that we could be in presence of only one species, with a very high intra-specific morphological variability.
However, even if the geometric morphometric approach has demonstrated its validity in enlightening still subtle morphological variation, further studies are necessary to better understand and explain the variability we observed.
CHAPTER 2 1) Introduction
Results of analyses discussed in chapter 1 indicated the presence of high morphological variability in all the species we examined. Due to the novelty of our results, we were interested in deepened the significance of them, upon the light of coevolutionary interactions.
Evolutionary interactions between species and their environment, and among different species, have attracted an increasing number of evolutionists. Coevolutionary interactions between species constitute a challenging topic in evolutionary theories.
In 1979 Dawkins and Krebs formulated the arms races theory with the aims to explain how two interacting species do coevolve. “An adaptation in one lineage (e.g. predators) may change the selection pressure on another lineage (e.g. prey), giving rise to a counter-adaptation. If this occurs reciprocally, an unstable runaway escalation or ‘arms race’ may result” (Dawkins and Krebs 1979). The arms races could be inter-specific or intra-specific, and helpfully explains the prey-predator and host-parasites interactions, as well as the other types of interactions between lineages. The host-parasite interaction is what Dawkins and Krebs (1979) identified as an asymmetric interspecific arms race. From its formulation this theory has been demonstrated to be suitable for various host-parasite interactions (Anderson and May 1982; Foitzik et al. 2001, 2003, 2009).
This theory implies also that lineages posses the capacity to change plastically as the environment change. This capacity is called evolutionary plasticity, and allows a lineage to respond to the changes of its environment, or otherwise it may be going extinct.
Most animals have a bilaterally symmetric body plan, at least externally, although other types of symmetry exist as well. Morphological symmetry outcomes from the repetition of an organ or part of an organ in different positions or orientations, making the spatial arrangement strongly patterned. Because of its interest, bilateral symmetry is largely studied in various contexts (e.g., Finnerty et al. 2004, Manuel 2009) and several studies have approached it by means the geometric morphometrics (Debat et al. 2000, Klingenberg et al. 2002, Drake and Klingenberg 2010, Klingenberg et al. 2010 a,b).