DEPARTMENT OF BIOLOGICAL AND ECOLOGICAL SCIENCES (DEB)
XXVI PhD course in Genetics and Cellular Biology
BIO/11
Analysis of Tap73-dependet signaling
via integrated Omics technologies
Coordinator: Tutor:
Prof. Giorgio Prantera Prof. Lello Zolla
PhD student:
2
Index
Aim of the study……….………4
1 INTRODUCTION.……….6
1.1 P53 family………...………..6
1.2 Protein Structure p53 Family………...……..……….6
1.3 Genomic Organization of p53 Family……….…….…………8
1.4 Biological activity of p53 Family protein isoforms……….………..12
2 MATERIALS AND METHODS……….………..………..………16
2.1.1 Cell culture and reagents………16
2.1.2 RNA isolation and qRT-PCR……….………16
2.1.3 Immunoblot analysis, antibodies and cell cycle analysis………17
2.2 METABOLOMICS AND LIPIDOMICS………..…...………..……17
2.2.1 Metabolite and Lipid extraction…………..…….………….………17
2.2.2 Rapid Resolution Reversed-Phase HPLC ………18
2.2.3 Untargeted Metabolomics: Mass Spectrometry: Q-TOF setting…...18
2.2.4 Targeted metabolobomics and lipidomics:Multiple reaction Monitoring (MRM) ………..…....19
2.2.5 Data elaboration and statistical analysis……….………..………20
2.3 PROTEOMICS……….21
2.3.1 Protein extraction and 2DE analyses……….………21
2.3.2 Statistical analyses and trypsin digestion………..…22
2.3.3 Phosphoproteomics analyses ………...………..…22
2.3.4 Mass spectrometry-based identification of proteins and phosphopeptides ………..……….………..…23
3. RESULTS AND DISCUSSIONS………25
3.1 PROTEOMICS AND PHOSPHOPROTEOMICS ANALYSIS ……….25
Index
3
3.1.2 Protein degradation and ER-stress………...……….….31
3.1.3 Transcription regulation by TAp73……….…...……….….36
3.2 METABOLOMIC ANALYSIS………...…….………...…….….37
3.2.1 PIP2 and PIP3, IP3 and cAMP………...…………...…….…39
3.2.2 Krebs cycle over-activation………..………...……...39
3.2.3 Glutathione homeostasis …….………40
3.2.4 Shift of glycolysis towards phosphoenolpyruvate accumulation and serine biosynthesis………...……...………...41
3.2.5 Pentose Phosphate pathway……….………...41
3.2.6 Purine metabolism………..……….….…44
3.2.7 Arginine-citrulline-NO metabolism………..……….….44
3.3 LIPIDOMICS………..……….45
4 CONCLUIION……….……….48
4
Aim of the study
In 1997, p73 emerged as a structural and functional homolog of the tumor suppressor p53 [1]. p73 and p53 genes consist of an N-terminal transactivation domain, a central sequence-specific DNA-binding domain, and a C-terminal oligomerization domain respectively [2, 3]. The human p73 genes are composed of 15 exons spanning over 80 000 bp on chromosome 1p36.3 [2]. Contrary to p53, p73 gene is very complex, since it expresses at least seven alternatively spliced C-terminal isoforms (α, β, γ, δ, ε, ζ and η – also referred to as transactivation proficient or TA variants) and at least four alternatively spliced N-terminal isoforms initiated at different ATG (including ΔNp73α and ΔNp73β, lacking the transactivation domain) [2-5]. Alternatively spliced TA isoforms display different transcriptional and biological properties. Based on their sequence similarity at the DNA binding domain, it is not surprising that p53 and TAp73 isoforms can share some transcriptional targets and, as a consequence, elicit similar biological effects. Ectopic expression of TAp73 isoform is indeed able to transactivate p53-responsive genes causing cell cycle arrest and apoptosis [2]. TAp73-triggered apoptosis follows several pathways [6-8], including mitochondrial intrinsic pathway (through activation of PUMA [9], Noxa [10] and Bax [6]) and via endoplasmic reticulum (ER) stress through the induction of Scotin [11]. Pro-apopotic activity of TAp73 variants can be modulated [12,13] by phosphorylation of TAp73 via checkpoint kinase Chk1 and Chk2 [14] or AMPK [15], or through collaborative binding to c-Abl [16,17].
In contrast to the TAp73 isoforms, the ΔN variants ΔNp73α and ΔNp73β, which are generated by alternative promoter utilization, exhibit dominant-negative behavior toward wild-type p73 as well as p53, display anti-apoptotic and oncogenic activity and it is involved in the regulation of the DNA damage checkpoint response [18-22]. Thus, the pro-apoptotic activity of p73 is determined by the relative expression levels of its TAp73 and dominant-negative ΔNp73 variants in cells [23]. However, exceptions to this assumption are all but infrequent, especially in the light of recent reports indicating a controversial role of the TAp73α isoform in mitigating apoptotic events in K-562 leukemia cells [24], small cell lung carcinoma [25,26], and human ovarian carcinoma cell line A2780 [27]. Therefore, although TAp73 isoforms are able to bind specifically to DNA through p53 responsive elements, transcriptional targets of p73 isoforms and p53 can not be entirely comparable, and thus their biological functions. Accordingly, the analysis of the isoform specific p73 knock-out mice revelead a peculiar function of p73 during
Aim of the study
5
neurodevelopment, mitotic spindle checkpoint and DNA damage checkpoint response, suggesting that p73 biological functions are not entirely redundant with those of p53.
Besides activating the transcription of genes-encoding proteins, p73 is also able to upregulate the expression of miRNAs, such as let-7, miR-34, miR-15/16a, miR-145, miR-29, miR-26, miR-30, miR-146a [28] and miR-200 family [29]. While connections between miRNAs and cancer cell metabolism are increasingly being confirmed [30,31], the actual effect of TAp73 expression in cancer cell metabolism still remain under-investigated. Indeed, energy metabolism is a key hallmark of cancer [32, 33], and tumor suppressor genes such as p53 play a central role in the modulation of glucose metabolism [34]. So far, available results suggest a role for TAp73α in the dysregulation of mitochondrial energy metabolism and exacerbation of mitochondria-induced ROS production in HCT116 and TAp73 knock out MEF cells [35]. The underlying mechanisms could involve the complex IV subunit cytochrome C oxidase subunit 4 (Cox4i1), a direct target of TAp73α [35].
The aim of this study is to seek a further understanding of the TAp73α-mediated cellular signaling. For this, we performed an integrated omics approach, based upon the simultaneous application of metabolomics, lipidomics, proteomics and phosphoproteomics. The application of multiple omics analyses to the same biological matrix holds several advantages, in that it helps coping with the intrinsic limitations of each independent approach [36], while providing further clues to the understanding of the biological phenomenon under investigation, even when scarce direct overlap among results from different omics is observed [37]. In this view, integration of omics disciplines represents the inevitable evolution of unsupervised approaches, towards the achievement of actual Systems Biology-wide comprehension of living systems [38].
6
1 INTRODUCTION
1.1 P53 family
The p53 protein family consists of three transcription factors: p53, p63, and p73. P53 was described for the first time in 1979 as a nuclear protein engaged by the oncogenic SV40 large T antigen, and it is the most studied proteins in the cancer field[39]. 18 years after discovery of p53, two p53-related genes were identified: p63 and p73.
Interestingly, p63 and p73 are structurally similar and functionally related to p53, and hence the entire p53 family may be regarded as a unique signaling network controlling cell proliferation, differentiation, and death. The discovery of these p53-related proteins, improve the level of complexity within this family, owing to their simultaneous, exclusive or consecutive physical interactions and ability to act as transcriptional regulators.
These genes encode a lot of protein isoforms through multiple mechanisms including extensive alternative mRNA splicing. According to recent study, approximately 92–95% of human multi-exon genes undergo AS, increasing the amount of functionally different protein isoforms. [40,41] Phylogenetic analysis of p53 family proves their origin from a p63/73-like ancestral gene early in metazoan evolution. Probably, maintenance of genetic stability of germ cells seems to be its ancestral function. The p53 family regulates many biological processes, including proliferation, cell differentiation, cell death and apoptosis. Abnormal alterations of splicing or dysregulation of the p53 family may interfere with normal cellular homeostasis and lead to cancer development.[54]
1.2 Protein Structure p53 Family
The members of p53 family share a very high structural similarity in protein organization. In fact, they are characterized by similar structure that identify p53 across all species:
an acidic N-terminal transactivation domain (TAD)
core DNA-binding domain (DBD)
Introduction
7
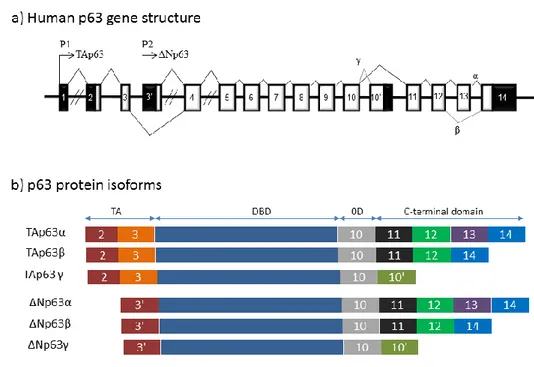
Between DBD and OD there is a small nuclear localization signal, responsible for localization in the nucleus (NLS), and at least one proline rich domain (PRD) with PXXP motif (P = proline, and X = any other amino acid) between TAD and OD [47]. Only p63 and p73 have a carboxy-terminal inhibitory region, post SAM domain (PS), and an area with a sterile a-motif (SAM).
(figure.1 a)
Figure.1 Schematic representation of the protein modular structure of the p53 family members: b)The overall
domain structure of p53, p73, and p63 is conserved and consists of an amino-terminal transactivation domain (TAD), a central DNA binding domain (DBD) and a carboxy-terminal oligomerization domain (OD), c) degree of identity between p53, p73 and p63. b) degree of identity between p73 and p63. They are both more homologous to each other than to p53.
The three major domains are highly conserved between the family members.(figure 1 b) The transactivation domain (TA ) is the least conserved with 5 identit etween p53 and p 3 p73. The core NA inding domain ( ) and of p73 p 3 are 5 identical with p53.
8
The C-terminal oligomerization domain (OD) of p53 is 35% identical with p63 and p73. In addition, the residues of p53 that directly interact with DNA are identical in p63 and p73. Consequently, both p63 and p73 can form oligomers, bind DNA, transactivate p53-responsive genes, and mediate cell cycle arrest, thus inducing cell cycle arrest, apoptosis and cellular senescence.
Sequence identity between p73 and p63 is more than to p53. (figure 1 c) Anal sis of primar amino acid se uence reveal a high degree of identit . In fact, the transactivation domain (TA ) and the NA inding domain ( ) of p73 are and 5 identical with p 3 respectivel , the carboxy-terminal oligomerization domain (O ) of p73 is 5 identical with p 3 and the area containing sterile a-motif ( A ) and ost- A domain of p73 is 5 identical with p 3. Therefore, they are both more homologous to each other than to p53.
Because of splicing events occurring at the carboxy-terminal region and to the presence of an alternative promoter located in the third intron, p53 family members exist as multiple protein variant.
1.3 Genomic Organization of p53 Family
The genomic organization of the p53 family is highly conserved among different species. The human p53 gene is composed approximately of 19 200 bp spanning over 11 exons on chromosome 17p13.1. (figure 2 a)
Due to alternative promoter usage and alternative splicing, p53 gene encodes respectively full-length p53 (p53), Δ p53 and Δ133p53[ ]. (figure 2 b)
The Δ p53 (or ΔNp53) can e generated either alternative initiation of translation or an alternative splicing on the intron 2 to produce an amino-terminally truncated p53 isoform deleted of the first 40 amino-acid. The full length p53, encoded by the first promotor (P1), is full efficient in transcriptional activity, whilst the variant Δ40p53 protein still contains part of the p53 transactivation domain and can activate gene expression after transfection through a second transactivation domain located between amino-acid 43 and 63. Δ40p53 can also act after transfection, in a dominant-negative manner towards WTp53 inhibiting both p53 transcriptional activity and p53-mediated apoptosis.
The alternative promoter (P2) leads to the expression of an amino-terminally truncated p53 protein initiated at codon 133 (Δ 133p53). Alternative splicing of intron 9 give rise to three
Introduction
9 Figure 2 Schematic representation of a) Human p53 gene structure: alternative splicing (α, β, γ) and alternative
promoters (P1, P1' and P2) are indicated. b) The p53 protein isoforms generated by alternative promoters and/or alternative splicing.
isoforms p53, p53β and p53γ can e generated , where the p53β and p53γ isoforms without the oligomerization domain.
Thus, the p53 can generate 9 protein isoforms, indicated p53, p53β, p53γ, Δ133p53, Δ133p53β and Δ133p53γ due to alternative splicing of the intron 9 and usage of the alternative promoter in intron , and Δ p53, Δ p5 β, Δ p53γ due to alternative splicing of the intron 9 and alternative initiation of translation or alternative splicing of the intron 2. However, new splice variants of p53 are discover , p53ζ, p53Δ and p53ε, arising from alternative splicing of exon and intron 9, respectively. [49]
p53 variant mRNA are expressed in several normal human tissues in a tissue-dependent manner, suggesting that the internal promoter and the alternative splicing of p53 can be regulated.
The human p73 gene is composed of 15 exons spanning over 80 000bp oh chromosome 1p36.3.
10 Figure 3 chematic representation of a) Human p53 gene structure: alternative splicing (α, β, γ, δ, ζ, η) and
alternative promoters (P1 and P2) are indicated. b) The p53 protein isoforms generated by alternative promoters and/or alternative splicing.
Introduction
11
The p73 gene encodes at least seven alternatively spliced C-terminal isoforms (indicated α, β, γ, δ, ε, and ζ) and at least four alternativel spliced N-terminal isoforms initiated at different ATG.
(figure 3 b) The p73 gene can be transcribed from alternative promoter in the intron 3 to produce
an amino terminal truncated isoforms (ΔNp73) lacking of the transactivation domain, while the transactivating isoforms (TAp73) are generated by the activity of the promoter upstream of exon 1. Although the p73 gene encodes at least 35 mRNA variants, only 14 different protein isoforms have een descri ed. The ΔN'p73 variant contains three first exons of Tap73, pro a l the translation is initiated from the first ATG located in exon 2 and it is finished at codon stop located in exon 3', leading to expression of a short p73 protein composed only of the N-terminal domain. The protein encoded ΔN'p73 mRNA has not e identif . o, the p73 isoforms can e contain different part of the N-terminal domain, suggesting that they have different protein interaction and specific activities.
The TA isoforms can be bind specifically to DNA through p53RE and activate transcription of target genes inducing cell cycle arrest or apoptosis like p53. However p73 can bind DNA through response elements specific to p73 and different to p53RE.
The ΔN isoforms can e ind NA through p53RE, ut the have a dominant-negative effect over p53, p73 and p63 activities by competing for DNA binding sites or by direct protein interaction showing antiapoptotic acticit .[ ,37] ΔNp73 isoforms can active transcription of gene target not induced by TA isoforms.
The human p63 gene is located on chromosome 3q27 and is composed of 15 exons spanning over 270 000 bp.(figure 4 a) The p63 can be transcribed from alternative promoters (P1 and P2) and express at least three alternative spliced C-terminal isoforms (α, β and γ).The transactivating isoforms (TA) are generated by the activity of promoter P1 upstream of exons 1, while the alternative promoter P2 in intron 3 leads to the expression of N-terminal truncated isoforms (ΔN) without transactivation domain. The p63 gene expresses for six mRNA which encode for six different protein isoforms: Tap 3α, Tap 3β, Tap 3γ, ΔNp 3α, ΔNp 3β and ΔNp 3γ.(figure 4
b) The isoforms TAp63, containing the N-terminal transactivation domain, are able to bind DNA
through p53RE, activate transcription of target genes and thus induce cell cycle arrest or apoptosis, like p53. However TAp63 can bind DNA through response element (p63RE) to p 3.[5 ] ΔNp 3 isoforms also can ind NA through p53RE and can have dominant-negative effect either competing for NA inding site or direct protein interaction.[5 ] ΔNp 3 isoforms can active specific gene targets not induced by TA isoforms. [53]
12
Figure 4 chematic representation of a) Human p 3 gene structure: alternative splicing (α, β, γ) and alternative
promoters (P1 and P2) are indicated. b) The p53 protein isoforms generated by alternative promoters and/or alternative splicing.
1.4 Biological activity of p53 family protein isoforms
Though the p53 family proteins share similar domain structure and the TA isoforms can activate apoptosis in response to DNA damaging insults, the outcome of their ablation in vivo is strikingly different. Indeed, p63 and p73 are important in the regulation of epidermal and neuronal development respectively. (figure 5).
The p53 is frequently inactivated or mutated in over 50% of human tumors, while p73 and p63 are mutated in only 1% of human tumors, thus excluding them as classic Knudson-type tumor suppressor genes. [54,55] However, emerging evidence indicates that they may contribute to tumorigenesis. Unlike p53 null mice, which manifest increased susceptibility to spontaneous and
Introduction
13
experimentally induced tumors, p63 and p73 loss does not result in increased tumorigenesis in vivo [56]
Cell Cycle arrest Apoptosis Development
p53 +++ +++ - ΔNp53 ? ? ++ TAp73 ++ + +++ ΔNp73 - - + TAp63 ++ ++ +++ ΔNp63 - - ++
Figure 5 Schematic classification of the functions of p53 family proteins.
Genetic study have shown that p63 is essential for epidermal morphogenesis and limb development. ΔNp 3 isoforms are expressed in the progenitor cell la ers of skin, reast and prostate, while Tap63 isoforms are poorly detectable, indicating a different expression of p63 isoforms during normal cellular differentiation.[57] Recently, some studies demonstrate that TAp63 isoforms are the first to be expressed during embryogenesis and are very important for initiation of epithelial stratification.[58] TAp63 isoforms inhibit terminal differentiation and pro a l TAp 3 isoforms must e counter alanced ΔNp 3 isoforms to allow cells to respond to signals required maturation of embryonic epidermis and to differentiate.
In human, the p63 gene usually is amplified in squamous cell in lung and cervical carcinomas, and TAp63 isoforms are expressed in most malignant lymphomas but ΔNp 3isoforms are not expressed.
P63 null mice born alive but not survive more than a few days after birth. They have striking developmental defects: craniofacial malformations, limb truncations and fail to develop skin and other epithelial tissues. In human, germ line mutation of p63 are found and cause six rare autosomal dominant development disease: Ectrodactyly Ectodermal dysplasia–Clefting syndrome (EEC), Acro-dermato-ungual-lacrimal-tooth malformations (ADULT), Limb– Mammary Syndrome (LMS). Hay–Wells syndrome, also named AEC syndrome for Ankyloblepharon (partial or complete fusion of eyelids) and Ectodermal dysplasia-Clefting, Split-hand/foot malformations (SHFM) and Rapp–Hodgkin Syndrome.[59]
EEC and ADULT (ectrodactyly) syndromes result from missense mutation in the DNA binding domain of p63 that affect all p63 isoforms, while AEC (absence of ectrodactyly) [60] are cause
14
by missense mutation in exon 13 affecting onl TAp 3α and ΔNp 3α. This suggest that TAp 3α and ΔNp 3α have a specific iological activities and are necessar to normal ectodermal development of specific organs.
The p73 gene is expressed at very low level in all normal tissue. p73 gene frequently undergoes loss of heterozygosity in some tumors: lung, ovarian and neuroblastoma. However, the most common cancer specific alteration is an overexpression of p73 and not the loss of its function. [61] Studies show that expression of p73 in different stage of development of colon tumors is associated with poor outcome of disease. TAp73 and ΔNp73 are overexpressed in man tumors. In different human tumor, abnormal variation of p73 is observed. Since, in different part of the same tumor could be expressed different variant of p73 isoforms and this heterogenity reflect the biological heterogenity of tumor. Often the hallmark of tumor formation is the change of the alance etween p73 isoform expression. ΔNp73 are relevant component of tumor-associated p73 expression, functionally overriding an accompanying increase of TAp73 expression. To date no syndrome in human associated with mutation of p73 has been found.
Mice p73 null die before 4 week of age with only 25% of them reaching adulthood [62]. At birth, p73 deficient mice manifest hippocampal dysgenesis due to massive apoptosis of sympathetic neurons in superior cervical ganglion, with approximately 40% of cell loss.[63]
Later on, they display hypersecretion of cerebrospinal fluid resulting in hydrocephalus, as well as runting, and abnormal social and reproductive behavior because of defects in pheromone detection. In addition, they have immunological problems characterized by chronic infections and inflammation.
These findings indicate the central role of p73 in the developing neuronal cells as well as in mature nervous system in the long-term maintenance of adult neurons.
uring normal nervous s stem development, the antiapoptotic ΔNp73 isoforms have a prosurvival role in developing brain and sympathetic ganglia. In response to NGF withdrawal, the asal levels of ΔNp73 decline dramaticall , thus allowing neurons to undergo cell death during nervous system develop. If the a sence of ΔNp73 is rescued ectopic expression of ΔNp73 isoform, neurons are protected from apoptosis.
ΔNp73 is an NGF-induced anti-apoptotic protein in sympathetic neurons and during development, neuronal survival is guaranteed by the availability of NGF, which in turn maintains the ΔNp73 levels high enough to inhi it the pro-apoptotic functions of both p53 and TAp63.
(figure 6 a) On the other hand, once the levels of NGF becomes restrictive, neuronal cells are
Introduction
15
circumstances, the antagonistic action of ΔNp73 is released, and the proapototic famil mem ers can elicit cell death by initiating mitochondrial apoptosis (figure 6 b).
The neuronal defects observed in the p73 knockout mice are a result of the absence of the ΔNp73 isoforms that normally block p53/TAp73/TAp63-mediated apoptosis in developing neurons.
Figure 6. Regulation of developmental sympathetic neuronal survival and apoptosis by the p53 family members.
16
2 MATERIALS AND METHODS
2.1.1 Cell culture and reagents
Human osteosarcoma SAOS-2 with doxycycline-inducible expression of HA-TAp73α were cultured in ul ecco’s modified Eagle’s and F1 medium (Gi co, Invitrogen), supplemented with 10% fetal bovine serum (FBS), 100 µg/ml penicillin and 100 µg/ml streptomycin (all Gibco, Invitrogen) and cultured at 37 C with 5% CO2.
To induce TAp73α expression, Saos-2- TAp73α cells were grown in the presence of doxycyclin (2 μg/ml) for 24 hours.
2.1.2 RNA isolation and qRT-PCR
Total mRNA was isolated using the RNeasy mini kit (Qiagen, Duesseldorf, Germany) following manufacturer recommendations. Total RNA was quantified using a NanoDrop Spectophotometer (Thermo Scientific, Delaware, USA) and used for cDNA synthesis using SuperScript Reverse Transcriptase (Promega, Fitchburg, WI, USA), according to the manufacturer’s protocol. cDNA was subsequentially used for Real-Time PCR analysis (qRT- CR). Each 5 μl reaction contained 2X SYBR-Green CR aster ix (Applied ios stems), .1 5 μl MultiScribe Reverse Transcriptase (Applied Biosystems), 2 μl cDNA and the appropriate specific primers ( .5 μM, sequences available upon request). Amplification and fluorescence detection according to the manufacturer's instructions was performed using the ABI PRISM 7700 Sequence Detection System (Applied Biosystems, France).
The expression of each gene was defined from the threshold cycle (Ct), and relative expression levels were calculated using the 2-ΔΔCt method. The following primers were used: for hPGLS 5’- CAGACCACCCCCTCCTACAG -3’; rev h GL 5’- CTGCCTTGCCTTCTCCAGTT -3’; for hp 1 5’-CACTGCCCTCCCATTACCTAG-3’, rev hp 1 5’-GAAGCTCAAGCATGGGAACAG-3’; for hActin 5’GTTGCTATCCAGGCTGTGCTA-3’; rev hActin 5’-AATGTCACGCACGATTTCCCG-3’.
Materials and Methods
17
2.1.3 Immunoblot analysis, antibodies and cell cycle analysis
Immunoblot analysis was performed using whole cell extracts obtained by lysing cell pellets with Triton Buffer (50 mM Tris-Hcl pH 7.5, 250 mM NaCl, 50 mM NaF, 1mM EDTA 1 pH 8, 0.1% Triton), supplemented with protease and phosphatase inhibitors. Proteins were separated by SDS-PAGE, transferred onto PVDF membranes and blocked with PBS-T (Phosphate-buffered saline and 0,1%Tween-20) containing 5% non-fat dry milk for one hour at room temperature (RT). The incubation with primary antibodies was performed for two hours at RT, followed by incubation with the appropriate horseradish peroxidase-conjugated secondary antibody. Detection was performed with ECL Western Blot Reagent (Perkin Elmer). Mouse monoclonal antibodies were from Covance (anti-HA), Sigma (actin), Santa Cruz (anti-p21). Anti-rabbit IgG or anti-mouse IgG horseradish peroxidase-conjugated antibodies were purchased by Perkin Elmer.
Quantification of sub-G1 population and cell cycle phase was performed by FACS analysis of propidium iodide-staining nuclei, carried out in a FACScan flow cytometer (Becton Dickinson, Heidelberg, Germany) using the CELLQuest software system.
2.2 METABOLOMISC AND LIPIDOMICS
2.2.1 Metabolite and Lipid extraction
One million cells per group (control and p73α-induced SAOS-2 cells) were exploited for subsequent metabolomics and lipidomics analyses. Samples were extracted following the protocol ’Alessandro et al. [64]. In brief, cells were resuspended in 0.15 mL of ice cold ultra-pure water (1 Ω) to l se cell, then the tu es were plunged into a water ath at 37°C for 0.5 min. Samples were mixed with 0.6 mL of -20°C methanol and then with 0.45 mL chloroform. Subsequently, 0.15ml of ice cold ultra-pure water was added to each tube and vortexed every 5 mintues for 30 minutes. Tubes were then transferred to -20°C freezer for 2-8 h. An equivalent volume of acetonitrile was added to the tube and transferred to refrigerator (4°C) for 20 min. Samples with precipitated proteins were thus centrifuged for 10000 x g for 10 min at 4°C. Two phases were thus recovered, the upper hydrophilic phase (metabolites) and the lower hydrophobic phase (lipids), with cell membrane debris at the interface. Finally, samples from
18
separated phases were dried in a rotational vacuum concentrator (RVC 2-18 - Christ Gmbh; Osterode am Harz, Germany) and re-suspended in 200 µl of water, 5% formic acid and transferred to glass auto-sampler vials for LC/MS analysis.
2.2.2 Rapid Resolution Reversed-Phase HPLC
An Ultimate 3000 Rapid Resolution HPLC system (LC Packings, DIONEX, Sunnyvale, USA) was used to perform metabolite and lipid separation. The system featured a binary pump and vacuum degasser, well-plate autosampler with a six-port micro-switching valve, a thermostated column compartment. Samples were loaded onto a Reprosil C18 column (2.0mm×150mm, 2.5 µm - Dr Maisch, Germany) for metabolite and lipid separation.
Chromatographic separations were achieved at a column temperature of 30°C; and flow rate of 0.2 mL/min. For downstream negative ion mode (-) MS analyses, a 0–100% linear gradient of solvent A (10mM tributylamine aqueous solution adjusted with 15mM acetic acid, pH 4.95) to B (methanol mixed with 10 mM TBA and with 15 mM acetic acid, pH 4.95) was employed over 30 min, returning to 100% A in 2 minutes and a 6-min post-time solvent A hold. For downstream positive ion mode (+) MS analyses, a 0–100% linear gradient of solvent A (ddH2O, 0.1%formic
acid) to B (acetonitrile, 0.1% formic acid) was employed over 30 min, returning to 100% A in 2 minutes and a 6-min post-time solvent A hold.
For lipids the gradient program started with 100% solvent A (acetonitrile-methanol 99:1 (v/v) containing 5 mmolL-1 ammonium acetate) for 10 min. The mobile phase was linearly changed to 30% solvent B (methanol-water 80:20 (v/v) containing 5 mmolL-1 ammonium acetate) over 10 min, reached 40% solvent B in 15 min, and was maintained so for another 10 min, followed by a fast change to 100% solvent A in 5 min. At the end of gradient, the column was reconditioned with 100% solvent A for 10 min. The overall run time was 60 min. Column oven was 50°C and flow rate of 0.5 mL/min.
2.2.3 Untargeted Metabolomics: Mass Spectrometry: Q-TOF settings
Owing to the use of linear ion counting for direct comparisons against naturally expected isotopic ratios, time-of-flight instruments are most often the best choice for molecular formula
Materials and Methods
19
determination. Thus, mass spectrometry analysis was carried out on an electrospray hybrid quadrupole time-of flight mass spectrometer MicroTOF-Q (Bruker-Daltonik, Bremen, Germany) equipped with an ESI-ion source. Mass spectra for metabolite extracted samples were acquired both in positive and in negative ion mode. ESI capillary voltage was set at 4500V (+) (-) ion mode. The liquid nebulizer was set to 27 psi and the nitrogen drying gas was set to a flow rate of 6 L/min. Dry gas temperature was maintained at 200°C. Data were stored in centroid mode. Data were acquired with a stored mass range of m/z 50–1200. Automatic isolation and fragmentation (AutoMSn mode) was performed on the 4 most intense ions simultaneously throughout the whole scanning period (30 min per run).
Calibration of the mass analyzer is essential in order to maintain an high level of mass accuracy. Instrument calibration was performed externally every day with a sodium formate solution consisting of 10 mM sodium hydroxide in 50% isopropanol: water, 0.1 % formic acid. Automated internal mass scale calibration was performed through direct automated injection of the calibration solution at the beginning and at the end of each run by a 6-port divert-valve.
2.2.4 Targeted metabolobomics and lipidomics: Multiple Reaction Monitoring
(MRM)
Metabolites and lipids of interest were thus further tested for validation with multiple reaction monitoring (MRM), as previously reported [64]. Instrument set up, calibration curves and relative quantitations were performed against external standards from SIGMA Aldrich (Milan, Italy). Metabolites/lipids were directly eluted into a High Capacity ion Trap HCTplus (Bruker-Daltonik, Bremen, Germany). Mass spectra for metabolite/lipid extracted samples were acquired in positive and negative ion mode, as previously described [64]. ESI capillary voltage was set at 3000 V (+) ion mode. The liquid nebulizer was set to 30 psig and the nitrogen drying gas was set to a flow rate of 9 L/min. Dry gas temperature was maintained at 300 °C.
Data was stored in centroid mode. Internal reference ions were used to continuously maintain mass accuracy. Data were acquired at the rate of 5 spectra/s with a stored mass range of m/z 50– 1500. Data were collected using Bruker Esquire Control (v. 5.3 – build 11) data acquisition software. In MRM analysis, m/z of interest were isolated, fragmented and monitored (either the parental or fragment ions) throughout the whole RT range. Validation of HPLC online MS-eluted metabolites was performed by comparing transitions fingerprint, upon fragmentation and
20
matching against the standards metabolites/lipids through direct infusion with a syringe pump (infusion rate μl min).
For lipid analyses, MS analysis was carried out in negative ion mode capillary voltage 2800V, nebulizer 45 psi and dry gas of 9 l/min, scan mode 100-1500 m/z. For sample injection, solutions were evaporated to dryness and reconstituted in an adequate volume of methanol:ethanol 1:1. Lipids extracts were prepared by dilution to a concentration of 5 pmol/L ( where total phospholipids concentration was 2.5 pmol/L). Tandem mass spectrometry (MS/MS) is used for glycerophospholipid species structural characterization. Unambiguous species identification is done by analysis of the retention time and fragmentation pattern and comparative to those acquired from chemically defined standards ( Avant Polar Lipids, Inc., Alabaster, Al. ) [65].
2.2.5 Data elaboration and statistical analysis
In order to reduce the number of possible hits in molecular formula generation, we exploited the SmartFormula application within the MAVEN software package (Bruker Daltonics, Bremen, Germany), which directly calculates molecular formulae based upon the MS spectrum (isotopic patterns) and transition fingerprints (fragmentation patterns). This software generates a confidence-based list of chemical formulae on the basis of the precursor ions and all fragment ions, and the significance of their deviations to the predicted intact mass and fragmentation pattern (within a predefined window range of 5 ppm).
Triplicate runs for each group (TAp73α-induced vs non-induced controls) were exported as mzXML files and processed through MAVEN [66]. Mass spectrometry chromatograms were elaborated for peak alignment, matching and comparison of parent and fragment ions, and tentative metabolite identification (within a 20 ppm mass-deviation range between observed and expected results against the KEGG pathway database [67]). Relative quantitation and pathway representations were determined upon normalization against non-induced controls in a pathway-wise fashion. Data were further refined and plotted with GraphPad Prism 5.0 (GraphPad Software Inc.).
Materials and Methods
21
2.3 PROTEOMICS
2.3.1 Protein extraction and 2DE analyses
Cell lysis was performed in lysis buffer (7 mol/L urea, 2 mol/L thiourea, 4% CHAPS, protease inhibitor cocktail). The cell debris was removed by centrifugation (16,000 g, 20 min, 4°C) and samples were stored at -80°C. Protein concentration was determined using the 2-D Quant Kit (GE Healthcare, Little Chalfont, Buckinghamshire, UK).
A total of 8 2DE gels have been performed during the proteomic analysis of membrane proteins (4 technical replicates per group – TAp73α-induced and non-induced controls). Proteins were precipitated from a desired volume of each sample with a cold mix of tri-n-butyl phosphate/acetone/methanol (1:12:1) as described elsewhere [68]. After washing with the same solution, the pellet was air-dried and then solubilized in the focusing solution containing 7 M urea, 2 M thiourea, 2% (w/v) CHAPS ,40 mM Tris, , 0.1 mM EDTA (pH 8.5), 2% (v/v) protease inhibitor cocktail (Sigma-Aldrich). Proteins were subsequently reduced (10 mM tributylphosphine, 1 h) and alkylated (40 mM IAA, 1 h). To prevent over-alkylation, iodoacetamide (IAA) excess was destroyed by adding 10 mM DTE. Finally, a new precipitation step was performed as describe before.
Six hundred μg of protein samples were resuspended in 300 μL of isoelectric focusing buffer (7M urea, 2M thiourea, 4% CHAPS, 0.2% Bio-Lyte 3/10 ampholyte) and absorbed into 17 cm ReadyStripTM IPG strips (Bio-Rad, Hercules, CA, U A) following the manufacturer’s directions. Isoelectric focusing was performed on a Protean IEF Cell (Bio-Rad, Hercules, CA, USA) with the following program: 200 V for 1 hour, 500 V for 1 hour, 1000V for 1 hour 3000 V for 1 hour, 5000 V for 60000 VH.
For the second dimension, the IPG strips were equilibrated for 30 min in a solution containing 6 M urea, 2% (w/v) SDS, 20% (v/v) glycerol, and 50 mM Tris-HCl (pH 8.8) under gentle agitation. Then, IPG strips were overlaid onto 12% SDS-PAGE gels and electrophoretic run was performed at a constant current (10 mA for 60 min, followed by 40 mA until the run was completed). During the whole run, the temperature was set at 10°C.
22
2.3.2 Statistical analyses and trypsin digestion
tained gels were digitalized using Chemi oc™ XR + stem with Image La ™ oftware ( io-Rad, Hercules, CA) and image analysis was performed using Progenesis SameSpot software v.2.0.2733.19819 software package (Nonlinear Dynamics, New Castle, UK). Each gel was analyzed for spot detection and background subtraction. Within-group comparison of protein spot numbers was determined by repeated measures analysis; thus, the arithmetic mean of the total spot number (standard deviation (SD) was considered). Among-group comparisons were determined by ANOVA (Analysis of Variance) procedure in order to classify sets of proteins that showed a statistically significant difference with a confidence level of 0.05. Moreover, protein spots matching across all the replica maps were selected and analyzed by MS/MS.
Spots from 2-DE maps of biological interest (p<0.05) were carefully excised from the gel and subjected to in-gel trypsin digestion according to Shevchenko et al. [70] with minor modifications. The gel pieces were swollen in a digestion buffer containing 50 mM NH4HCO3 and 12.5 ng/mL trypsin (modified porcine trypsin, sequencing grade, Promega, Madison, WI) in an ice bath. After 30 min, the supernatant was removed and discarded; then μL of 5 m NH4HCO3 were added to the gel pieces, and digestion was allowed to proceed overnight at 37 °C. The supernatant containing tryptic peptides was dried by vacuum centrifugation. Prior to mass spectrometric anal sis, the peptide mixtures were redissolved in 1 μL of 5 FA (formic acid).
2.3.3 Phosphoproteomics analyses
TiO2 enrichment and CID/ETD-analysis of phosphopeptides were performed as previously
reported [71, 72].
Cell lysis was performed in lysis buffer (7 M urea, 2 M thiourea, 4% (w/v) CHAPS, 50mM Tris, 0.1 mM EDTA (pH 8.5), 2% (v/v) protease inhibitor cocktail (Sigma-Aldrich, Basle, Switzerland), 2mM orthovanadate). Samples were then centrifuged (16,000×g, 15 min, 4 °C) to remove cellular debris. The supernatant was transferred to a new Eppendorf tube and protein estimation was subsequently performed using a 2Dquant kit (GE Healthcare, Little Chalfont, Buckinghamshire, UK) μg of protein was precipitated using a cold mix of tri-n-butyl
Materials and Methods
23
phosphate/acetone/methanol (1:12:1) as described elsewhere [68] and resuspended in 7 M urea, 2 M thiourea, 50 mM Tris–HCl (pH . ) to a final concentration of μg μL. roteins were reduced (DTT 2 mM, 30 min) and alkylated (8 mM iodacetamide, 1 h). Finally, to prevent overalkylation, iodoacetamide (IAA) excess was neutralized by adding 2 mM DTE. A new precipitation step was performed and sample was resuspended in 50 mM ammonium bicarbonate containing 1 M urea and 0.1% SDS. Trypsin was added to a final protease:protein ratio of 1:50 (w/w) and incubated overnight at 37 °C.
Prior to phosphopeptide enrichment, the digested samples were desalted using ZipTip C18 pipette tips (Millipore, Billerica, MA, USA) following the manufacturer's directions. Purification of phosphopeptides was then performed according to Larsen et al. [72]. Briefly, tryptic peptides were diluted 5-fold in dihydroxybenzoic acid (DHB) buffer [350 mg/mL DHB, 80% (v/v) ACN, 2% (v/v) TFA] and applied to TiO2 eads ( μg) pre-equilibrated in 50% ACN. The sample
was then washed once in DHB buffer, before being washed two times with wash buffer [80% ACN (v v), TFA (v v)] to remove the H . The sample was finall eluted with 5 μL of .5 ammonium h droxide solution (pH≥1 .5) and immediatel neutralized with .5 μL of formic acid. All buffers used ultrapure water and were made fresh on the day of experimentation.
2.3.4 Mass spectrometry-based identification of proteins and phosphopeptides
Mass spectrometric procedures for proteomics and phosphopeptide analyses were performed as previously described.
To provide a larger list of phosphorylation sites, the TiO2-enriched samples were analyzed using
a split-free nano-flow liquid chromatography system (EASY-nLC II, Proxeon, Odense, Denmark) coupled to a 3D-ion trap (model AmaZon ETD, Bruker Daltonik, Germany) equipped with an online ESI nano-sprayer (the spray capillary was a fused silica capillary, 0.090mm o.d., . mm i.d.). For all experiments, a sample volume of 15 μL was loaded the autosampler onto a homemade cm fused silica precolumn (1 μm I. .; 375 μm O. .; Reprosil C1 -AQ, 5 μm, r. Maisch GmbH, Ammerbuch-Entringen, Germany). Sequential elution of peptides was accomplished using a flow rate of 300 nL/min and a linear gradient from Solution A (2% acetonitrile; 0.1% formic acid) to 50% of Solution B (98% acetonitrile; 0.1% formic acid) in 40 min over the precolumn in-line with a homemade 15 cm resolving column (75 μm I. .; 375 μm O.D.; Reprosil C18-AQ, 3 μm, r. aisch Gm H, Ammer uch-Entringen, Germany). To
24
identify phosphorylation sites, two types of peptide fragmentation were carried out in parallel in the mass spectrometer: (i) Collision Induced Dissociation (CID); (ii) Electron Transfer Dissociation (ETD). When CID was used a MS2 was automatically performed on the three most intense MS ions, and MS3 was triggered if one of the top three MS2 peaks corresponded with neutral loss of 98.0, 49.0, 32.7 m/z. For ETD experiments the reaction time was set to 100 ms using a reactant ICC of 500000 allowing a maximum accumulation time for the reactant ion of 10 ms. A detailed description of the ETD setup of the ion trap instrument including the generation of the reagent anion of fluoranthene was given previously.[73] The acquisition parameters for the instrument were as follows: dry gas temperature, 220 °C; dry gas, 4.0 L/min; nebulizer gas, 10 psi; electrospray voltage, 4000 V; high-voltage end-plate offset, − V; capillary exit, 140 V; trap drive: 63.2; funnel 1 in, 100 V out 35 V and funnel 2 in, 12 V out 10 V; ICC target, 200000; maximum accumulation time, 50 ms. The sample was measured with the “Enhanced Resolution ode” at 1 m z per second (which allows mono isotopic resolution up to four charge stages) polarity positive, scan range from m/z 300 to 1500, 5 spectra averaged, and rolling average of 1. The “ mart ecomposition” was set to “auto”. Ac uired ET CI spectra were processed in DataAnalysis 4.0, and deconvoluted spectra were further analyzed with BioTools 3.2 software and submitted to Mascot search program (in-house version 2.2, Matrix Science, London, UK). The following parameters were adopted for database searches: NCBInr database (release date 22/10/2011; 15 670 865 sequences; 5 387 755 057 residues); taxonomy=mammalia; peptide mass tolerance of ±0.3 Da; fragment mass tolerance of ±0.3 for CID ions and of ±1.3 Da for ETD ions; enzyme specificity trypsin with 2 missed cleavages considered; fixed modifications: carbamidomethyl (C); variable modifications: oxidation (M), phosphorylation (STY). Phosphopeptide identifications were accepted if the Mascot score was over the 95% confidence limit ased on the “identit ” score of each peptide. A delta ion score was calculated of all phosphopeptides containing more than one serine, threonine or tyrosine residues by taking the difference between the two top ranking Mascot ion scores. Phosphorylation site assignments with a delta score >5 were automatically accepted.[74] All fragmentation spectra with delta score ≤5 were manuall inspected as to whether the phosphorylation sites were unambiguously determined or not.
Results and Discussions
25
3 RESULTS AND DISCUSSIONS
In order to evaluate the TAp73-dependent signaling, we utilized a subclone of the human osteosarcoma SAOS-2 cell line (p53 null cells) where the exogenous expression of HA-TAp73α is under control of a doxycycline responsive promoter. Upon 24 h of doxycycline treatment, the expression of TAp73α and its transcriptional target gene p21 is increased. The ectopic expression of TAp73α is able to induce cell cycle arrest or apoptosis within 48 h from doxycyline induction.9 Since in the present study we were interested in investigating the events leading to TAp73α-driven apoptosis, we analyzed the cell cycle profile of the cells 24 h from TAp73α induction. We confirmed that this time frame is adequate for further omics analyses in that early evidence of cell cycle arrest in G2/M phase and slight increases in the percentage of apoptotic cells were already visible at 24 h from the induction (Fig. 7).
3.1 PROTEOMISC AND PHOSPHOPROTEOMICS ANALYSIS
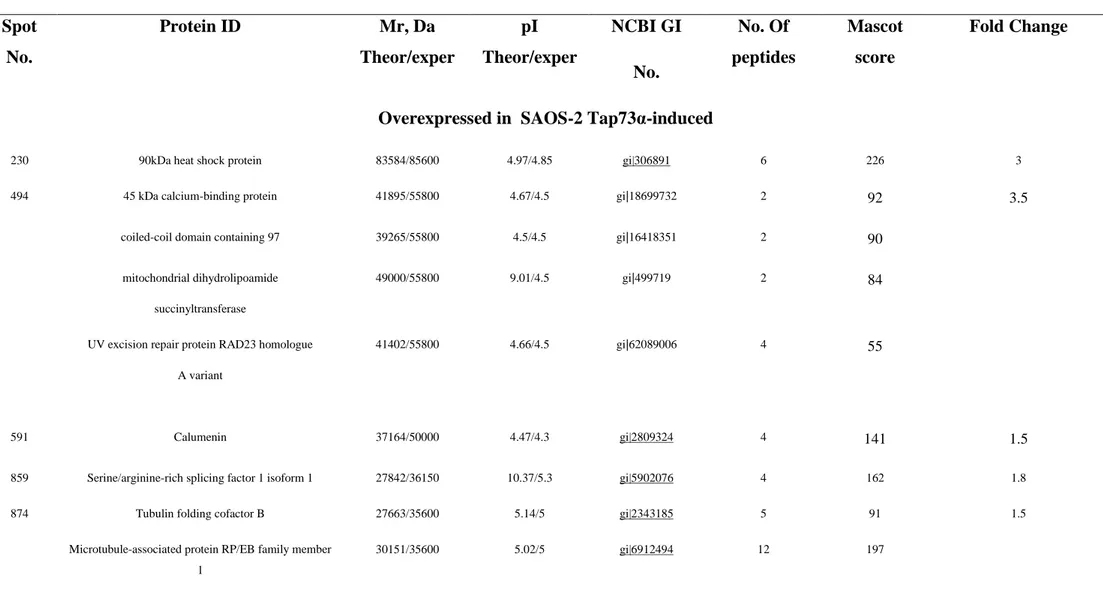
roteomics anal sis revealed that the induction of TAp73α expression resulted in the up-regulation of 15 and down-up-regulation of 9 protein spots. Results are reported in Table 1, along with the indication of the extended protein name, theoretical MW and pIs, gene identifiers (NCBI gi), and identification details (the number of matched peptides and MASCOT scores). istri ution of protein spots in the control (left panel) and in the TAp73α–induced (right panel) SAOS-2 cells is showed on 2DE maps in Figure 8.
First of all, it is worthwhile noting that we assayed cells at 24 h after induction of TAp73α. This time frame is indeed sufficient to observe the induction of direct target genes of TAp73 transcriptional activity (Figure 1A) and early biological responses (such as cell cycle arrest, as reported above, Figure 1B). Since TAp73α is expressed roughly already at 8−12 h from induction in the Tet-On doxycycline-inducible SAOS2 cell line,11 some of the observed changes at the proteomics level might be also attributable to early indirect transcriptional effects of TAp73α activation.
Differentially-expressed proteins could be further divided on the basis of their biological activity, including:
26
b) proteins involved in p73 degradation and protein turn-over;
c) proteins reflecting an active transcriptional state upon TAp73α–induction;
d) proteins linked to metabolism.
Figure 7. Human osteosarcoma SAOS-2 cells (SAOS-2-TAp73α) with doxycycline-inducible expression of
HA-TAp73α were grown in the presence of doxycyclin (2 μg/ml) for twenty-four hours. A) Whole cell extracts of untreated and treated cells were utilized for western blot analysis using the antibodies to the indicated proteins. B) SAOS-2-TAp73α treated and untreated cell were subjected to FACS analysis. The percentage of sub G1, G1, S and G2/M cells is reported.
A
Results and Discussions
27
Table 1. Mass Spectrometry-Based Identification of Differentially Espressed Proteins upon Tap73α induction
Spot No. Protein ID Mr, Da Theor/exper pI Theor/exper NCBI GI No. No. Of peptides Mascot score Fold Change
Overexpressed in SAOS-2 Tap73α-induced
230 90kDa heat shock protein 83584/85600 4.97/4.85 gi|306891 6 226 3
494 45 kDa calcium-binding protein 41895/55800 4.67/4.5 gi|18699732 2 92 3.5
coiled-coil domain containing 97 39265/55800 4.5/4.5 gi|16418351 2 90
mitochondrial dihydrolipoamide succinyltransferase
49000/55800 9.01/4.5 gi|499719 2 84
UV excision repair protein RAD23 homologue A variant
41402/55800 4.66/4.5 gi|62089006 4 55
591 Calumenin 37164/50000 4.47/4.3 gi|2809324 4 141 1.5
859 Serine/arginine-rich splicing factor 1 isoform 1 27842/36150 10.37/5.3 gi|5902076 4 162 1.8
874 Tubulin folding cofactor B 27663/35600 5.14/5 gi|2343185 5 91 1.5
Microtubule-associated protein RP/EB family member 1
28
909 coatomer protein complex, subunit epsilon 34688/34300 4.97/5 gi|119605162 20 148 1.6
938 14-3-3 protein epsilon 29326/31300 4.63/4.6 gi|5803225 16 2100 1.7
975 14-3-3 protein epsilon 29326/31300 4.63/4.6 gi|5803225 2 240 1.8
987 Prohibitin 29843/30000 5.57/5.7 gi|4505773 5 181 1.5
proteasome beta 7 subunit 30260/30000 7.57/5.7 gi|62898273 3 91
6-phosphogluconolactonase 27815/30000 5.70/5.7 gi|6912586 7 134
1118 HSPC029 25329/25800 4.89/4.7 gi|5114051 3 266 1.6
proteasome subunit Y 25527/25800 4.80/4.7 gi|558528 4 141
1324 RNA polymerase II subunit 17203/17500 4.5/4.3 gi|1017823 3 236 1.5
1439 PSMC3 45507/49900 5.39/5.1 gi|48145579 54 724 1.6
α-tubulin 50810/49900 5.02/5.1 gi|37492 2 200
1454 mitochondrial ATP synthase, H+ transporting F1 complex β subunit
48083/50000 4.95/5.0 gi|89574029 8 567 2
β-tubulin 4 50240/50000 4.75/5.0 gi|338695 4 147
p48 41470/50000 5.09/5.0 gi|904032 3 130
1460 Smooth muscle myosin alkali light chain ( Myosin light polypeptide 6)
17772/17000 4.57/4.2 gi|467828 2 112 1.7
Results and Discussions
29
Dynactin subunit 2 44906/50200 5.06/5.1 gi|5453629 13 537
ATP synthase subunit beta, mitochondrial precursor 56525/50200 5.26/5.1 gi|32189394 18 458 Tat binding protein 1, TBP-1=transcriptional activator 49322/50200 5.08/5.1 gi|263098 10 258
p48 41470/50200 5.08/5.1 gi|904032 3 156
Tat binding protein 7, TBP-7 = transcriptional activator
51633/50200 5.52/5.1 gi|263099 7 90
Overexpressed in SAOS-2 Tap73α non-induced controls
387 Plastin-3 isoform 1 71279/79000 5.41/5.75 gi|7549809 34 1022 1.5
489 Alpha-tubulin 50810/51000 5.02/5.1 gi|37492 43 998 1.5
vimentin 53738/51000 5.03/5.1 gi|340219 9 302
596 chaperonin (HSP60) 61157/61900 5.70/5.7 gi|306890 2 72 1.7
638 actin 42480/48000 5.23/5.1 gi|178027 3 93 1.7
649 Deaminase a,adenosine 41009/48000 5.62/5.7 gi|224877 5 227 1.7
998 prosomal RNA-binding protein p27K 27838/31900 6.34/6.3 gi|446773 12 1082
Enoyl-CoA hydratase 31807/31900 8.34/6.3 gi|1922287 10 394
1199 not identified 1.9
1231 ribosomal protein L12 17979/19000 9.48/5.1 gi|4506597 2 94 1.5
30 Figure 8. 2DE maps of non-induced controls (left panel) versus TAp73α-induced SAOS-2 cells. Spot numbers indicate differentially expressed proteins (p<0.05 ANOVA) upon
Results and Discussions
31
3.1.1 Regulation of p73 activity
We found that the 90kDa heat shock protein (HSP90 - spot n. 230 – Table 1) is up-regulated in TAp73α-induced cells. This phenomenon might be related to stabilization of the p73 protein through a mechanism conserved within the p53/p63/p73 protein family. Indeed, accumulation of the p73-homolog p53 results from ATM kinase-mediated phosphorylation of p53 at serine 15 or rather by HSP90-binding to wild type p53 [75]. Inhibition of HSP90-p53 interaction by geldanamycin completely prevented p53 accumulation in ATM-deficient cells [75]. Analogous mechanisms could contribute to the stabilization and accumulation of newly-expressed TAp73α. Another protein whose expression is induced in TAp73α-expressing is 14-3-3 protein ε (spots n. 938 and 975 – Table 1). Several publications suggest that activation of p53 following DNA damage directly up-regulates the levels 14-3-3σ, and that this process is critical for maintaining the G2/M checkpoint [76, 77]. The interactions between p53 and 14-3-3 are complex, and likely to e at least partiall cell t pe specific. For example, 1 -3-3σ and other 14-3-3 isotypes, including 14-3-3ε have een reported to directl ind to p53 itself [77, 7 ], increasing the NA-binding function and activity of p53 as a transcription factor. However, p53 activation depends upon dephosphorylation and binding to 14-3-3 proteins [77]. Again, the up-regulation of 14-3-3 protein ε in TAp73α-induced cells is suggestive of further shared similarities between p53 and p73 activation cascades.
3.1.2 Protein degradation and ER-stress
Protein degradation determines the outcome of many cellular physiological processes. Degradation of proteins by the proteasomes occurs via various and tightly-regulated pathways, the most extensively studied one being the ubiquitin–26S proteasome pathway [79].
The proteasomal degradation of the tumor suppressors p73 is regulated by both poly-ubiquitination (a mechanism that is inhibited by the promyelocytic leukemia (PML) protein [80, 81]) and by an ubiquitin-independent process [82, 83]. Unlike p53, p73 is not targeted for ubiquitinylation by the E3 ubiquitin ligase MDM2 [84, 85].Hereby, we could find an up-regulation of proteasome 26S (spot n. 1439) and TAT-binding protein 1 (an ATPase of 19S regulatory particles of the 26S proteasome [86] – spot n. 1478) upon induction of the expression of TAp73α (Table 1). In addiction, we could observe up-regulation of spot n. 987 in the
32
TAp73α-induced group, also identified as proteasome 20S subunit beta 7 (Table 1). Overall, these findings are suggestive of a likely protein turn-over upon p73 induction, a process that might result in a negative feedback loop towards homeostasis of the levels of p73 protein itself. Another tentative explanation stems from increased rates of protein degradation through the proteasome system under conditions of endoplasmic reticulum (ER) stress [81, 82], a condition that is known to e induced TAp73α through a cotin-mediated pathway [11]. Misfolding of proteins is associated with ER stress [81, 82] and hereby indirectly documented by the overexpression of protein disulfide isomerase 5 (PDIA5 – spot n. 1478 in Table 1) in TAp73α-induced cells. Indeed, PDIA5 is an ER enzyme that catalyzes the rearrangement of disulfide bonds between cysteine residues within proteins during folding. This allows proteins to quickly find the correct arrangement of disulfide bonds in their fully folded state, which makes PDIA5 a catalyst of proper protein folding that responds to ER stress stimuli [83].
In line with the posited hypothesis about proteomics changes reflecting p73α involvement in ER-stress, the p73-induced up-regulation of protein UV excision repair protein RAD23 homolog A (spot n. 494 – Table 1) can be related to DNA damage responses, ER stress and protein degradation [84]. The DNA repair protein RAD23 has been shown to inhibit degradation of specific substrates in response to DNA damage, including the associated nucleotide excision repair protein XPC thereby stimulating DNA repair in a mouse model [84]. The RAD23 homolog MIF1 binds to the 19S regulatory subunit of proteasome 26S and could play a role in the translocation of the 26S proteasome towards the membrane, thereby enhancing ER-associated protein degradation [85]. It is at least worth noting that another protein was identified under the spot n. 494, namely 45 kDa calcium-binding protein, a protein that is involved in the regulation of calcium-dependent activities in the endoplasmic reticulum lumen or post-ER compartment.66 Consistently, ER-stress induced by p73 proteins follows a Scotin/caspase-dependent pathway [9, 11, 17, 86, 87].
Further clues to the p73α involvement in NA damage repair, proteasome-dependent degradation stem from differential phosphoproteomics results (Table 2).
Phosphorylation of the ubiquitin fusion-degradation 1like protein at Ser299 (uniquely found in the TAp73α expressing cells -Table 2) is associated with inactivation of the pathways leading to DNA-damage repair and mTOR signaling occurring during mitosis or in response to ATM activation [88]. Connections between the mTOR-p73 signaling axis are not novel [89-91]. In the present study, additional supporting evidence is provided by phosphorylation at Ser250 of the proteasome subunit alpha type-3 (only present in the non-induced cells - Table 2), a post
Results and Discussions
33
translational modification that triggers inhibition of proteasome activity in response mTOR [92] and MAPK [93] signaling. Analogous considerations can be made for microtubule associated protein 4, phosphorylated at Ser280 in non-induced cells (Table 2), which is associated with cytokinesis during mitosis [94]. On the other hand, the up-regulation of microtubule-associated protein RP/EB family member 1 (MAPRE1 - up-regulated in TAp73α-induced cells – spot n. 874 in Table 1) was unexpected, since oth p53 and p73β have een reported to inhibit transcription of this protein [95]. This might reflect differential p73 isoform-specific downstream regulation of target genes or rather differential T to this protein upon TAp73α-induction, causing spot displacement on the 2D map at the pI-level. Indeed, most of the pro-mitotic protein-protein interactions are modulated by phosphorylations. For example, MAPRE1 is known to interact with the stromal interaction molecule 1 (GOK), targeting to the growing microtubule plus ends [96] and promoting mitosis [97]. GOK is a Ca2+ sensor that resides in the ER and, upon Ca2+ depletion, it migrates to the membrane to trigger calcium release. Phosphorylation at Ser257 of GOK (Table 2) was peculiar of the non-induced group.
Table 2 – Phosphopeptidomics analyses of TAp73α-induced SAOS-2 cells
Phosphopeptides unique to TAp73 α-induced
Ubiquitin fusion-degradation 1 like protein
m/z 689.2604 FVAFSGEGQSLR + Phospho (ST) (Mascot score: 47, NL)
Peptides unique to non-induced controls
GOK
m/z 703.2812 AEQSLHDLQER + Phospho (ST) (Mascot score: 46, ETD) Human elongation factor-1-delta
m/z 501.8514 ATAPQTQHVSPMR + Phospho (ST) (Mascot score: 45, ETD) huMCM2
34
Microtubule-associated protein 4
m/z 814.4000 DMESPTKLDVTLAK + Phospho (ST) (Mascot score: 53, NL) Proteasome subunit alpha type-3
m/z 868.2320 ESLKEEDESDDDNM.- + Phospho (ST) (Mascot score: 53, ETD) Translation initiation factor IF2
m/z 705.2633 NKPGPNIESGNEDDDASFK + Phospho (ST) (Mascot score: 41, ETD) Uncharacterized protein C12orf4
m/z 893.0097 DAEASLAAVKSGEVDLHQLASTWAK + Phospho (ST) (Mascot score: 43, ETD)
Shared phosphopeptides
60S acidic ribosomal protein P1
m/z 1023.2906 KEESEESDDDMGFGLFD.- + Oxidation (M); Phospho (ST) (Mascot score: 69, NL)
Calnexin
m/z 754.7977 AEEDEILNRSPR + Phospho (ST) (Mascot score: 74, ETD) eIF-3 p110 subunit
m/z 584.8919 QPLLLSEDEEDTKR + Phospho (ST) (Mascot score: 76, ETD) hCG1817324, isoform CRA_a
m/z 579.5674 ASMSGELRSSGNQR + Oxidation (M); 3 Phospho (ST) (Mascot score: 47, ETD)
Hematological and neurological expressed 1 protein
m/z 569.2384 RNSSEASSGDFLDLK + Phospho (ST) (Mascot score: 88, ETD) Hepatoma-derived growth factor
Results and Discussions
35
m/z 502.5566 AGDLLEDSPKRPK + Phospho (ST) (Mascot score: 74, NL; 67, ETD) Heterogeneous nuclear ribonucleoprotein D0B
m/z 684.5732 IDASKNEEDEGHSNSSPR + Phospho (ST) (Mascot score: 120, ETD) Heterogeneous nuclear ribonucleoprotein H
m/z 588.8542 HTGPNSPDTANDGFVR + Phospho (ST) (Mascot score: 109, ETD) HSPC121
m/z 795.3309 WLDESDAEMELR + Oxidation (M); Phospho (ST) (Mascot score: 40, ETD) m/z 795.2997 WLDESDAEMELR + Oxidation (M); Phospho (ST) (Mascot score: 46, NL) HSR1 protein
m/z 544.9510 REEQTDTSDGESVTHHIR + Phospho (ST) (Mascot score: 82, ETD) Nucleolin
m/z 492.2147 LELQGPRGSPNAR + Phospho (ST) (Mascot score: 68, ETD) Protein transport protein Sec61 subunit beta
m/z 617.2425 PGPTPSGTNVGSSGRSPSK + Phospho (ST) (Mascot score: 90, ETD) Ribonucleoprotein La
m/z 602.2233 FASDDEHDEHDENGATGPVKR + Phospho (ST) (Mascot score: 94, ETD) SEPT2 protein
m/z 629.9698 IYHLPDAESDEDEDFKEQTR + Phospho (ST) (Mascot score: 61, ETD) SEPT9 protein
36
3.1.3 Transcription regulation by TAp73
The quality of proteomics results is also confirmed by evidences supporting the role of p73 as a transcriptional activator. This assumption is also underpinned by increased levels of RNA pol II in TAp73α-induced SAOS-2 cells (spot no. 1324 – Table 1).
We also observed differential expression of splicing factors, including Serine/arginine-rich splicing factor 1 isoform 1 (spot n. 59 in TAp73α-induced cells – Table 1) and several heterogeneous nuclear ribonucleoproteins (Table 2). This is relevant in the light of splicing factors regulating apoptosis through alternative processing of pre-mRNA of apoptotic players [98].
Other than modulating transcription and mRNA splicing, TAp73α appeared to modulate also protein translation. We found indeed the up-regulation of eIF-3 (HSPC029 in spot n. 1118 in
Table 1), an eukaryotic initiation factor which associates with the 40S ribosome and facilitates
the recruitment of eIF-1, eIF-1A, eIF-2/GTP/methionyl-tRNAi and eIF-5 to form the 43S preinitiation complex (43S PIC). The eIF-3 complex stimulates mRNA recruitment to the 43S PIC and scanning of the mRNA for AUG recognition [99]. Mitogenic stimulation leads to mTOR and RPTOR-dependent phosphorylation and release of RPS6KB1 and binding of EIF4B to eIF-3 [100]. However, phosphorylations to Ser133 of human elongation factor-1-delta and to Ser214 of translation initiation factor IF2 (EIF1D and eiF5B, respectively - only detected in non-induced controls – Table 2) are necessary for human spindle assembly at mitotic checkpoints [100, 101] and mTOR-dependent [92]. Also, phosphorylation of human MCM2 (only present in non-induced cells – Table 2) to Ser139, downstream of mTOR signaling [92], is pivotal in Cdc7/Dbf4-mediated phosphorylation of MCM2 in the initiation of DNA replication [102].
Together with other differential phosphorylation events mentioned above, since all of the observed differential phosphorylations present in the non-induced controls and absent in TAp73α-induced cells had already been reported to be dependent on mTOR-activation [92], we could conclude that TAp73α might trigger activation of specific phosphatases upstream of mTOR signaling. Since PI3K/Akt/mTOR signaling is important to interconnect cell growth with the regulation of the cellular metabolism, we decided to perform extensively metabolomics analyses and correlated it with proteomics results
Results and Discussions
37
3.2 METABOLOMICS ANALYSIS
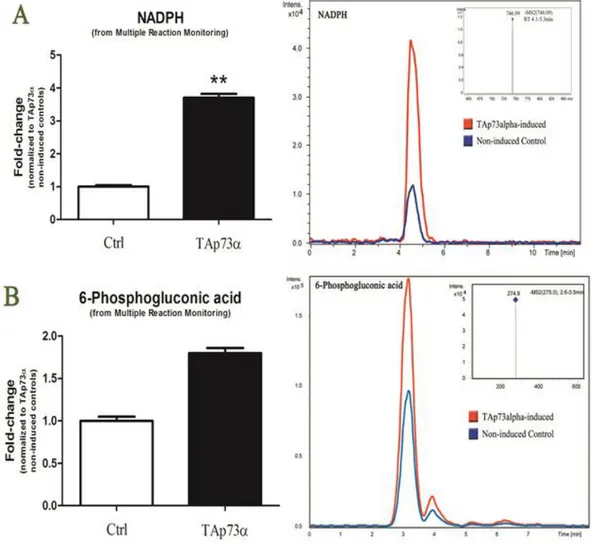
Untargeted metabolomics results are plotted in Figure 9, as fold-change variations of meta olites upon induction of TAp73α expression, normalized to non-induced controls. Metabolites are grouped through a pathway-based criterion:
a) glycolysis (Figure 9.A),
b) Krebs cycle (Figure 9.B),
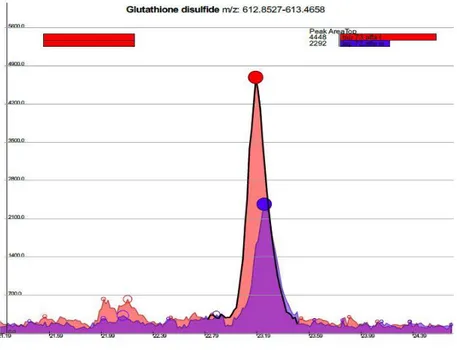
c) glutathione (GSH) homeostasis (Figure 9.C),
d) Pentose Phosphate Pathway (PPP) (Figure 9.D),
e) purine metabolism and other signaling (Figure 9.E),
f) arginine-citrulline-NO metabolism (Figure 9.F).
Results were also plotted as a metabolic interaction network on the basis of whole metabolome maps from KEGG pathway.
38 Figure 9 Pathway-wise plotting of untargeted metabolomics results, including glycolysis (A), Krebs cycle (B), GSH
homeostasis (C), pentose phosphate pathway (D), purine metabolism and other signaling (E), and arginine-citrulline-NO metabolism (F). Results are plotted as mean of values detected for each metabolite in TAp73α-induced cells upon normalization to non-TAp73α-induced controls as means + SEM. Asterisk indicate statistical significancy (p-value < 0.05 T-test of induced vs non-induced control values and fold-change > │2│).
Results and Discussions
39
3.2.1 PIP2 and PIP3, IP3 and cAMP
On the basis of the assumption of a likely role of the PI3K/Akt/mTOR signaling in TAp73α-modulated events, we assayed the levels of phosphatidylinositol (3,4,5)-trisphosphate (PtdIns (3,4,5)P3 or PIP3) and biphosphate product PIP2 (PtdIns(4,5)P2) (Figure 9.E).
Myo-inositol (1,4,5) triphosphate (IP3 – Figure 9.E) is a second messenger produced primarily in response to the stimulation of G-protein-coupled receptor or receptor tyrosine kinases. IP3 acts on the IP3 receptor (IP3R), an ER Ca2+ release channel which transmits Ca2+ spikes generated by the ER to mitochondria [103]. In particular, IP3-mediated Ca2+ signaling is critical for starvation-induced autophag stimulation [1 3,1 ]. The increase of I 3 levels in TAp73α-induced cells (Figure 9.E) might stem from a crosstalk between pathways downstream to p73 activation either leading to apoptosis or autophagy through a delicate balance [104, 105].
We also o served decreases of the cA levels upon induction of the expression of TAp73α (Figure 9.E), an event that can be suggestive of a metabolic switch leading to demodulation of the cAMP-mediated activation of PKA, which is known to result in the inhibition of p73 protein activity [106].
3.2.2 Krebs cycle over-activation
It has been recently demonstrated that TAp73 yields the activation of mitochondrial metabolism, utterly resulting in ROS production and rerouting of cancer metabolic fluxes away from the so-called Warburg effect [107]. Accordingly, we found an over-activation of the Krebs cycle intemediates (citrate/isocitrate, succinyl-coA, succinate, malate, fumarate and FADH2) in TAp73α-induced SAOS-2 cells (Figure 9.B).
These metabolic changes were supported at the protein level by the TAp73α-dependent upregulation of the Krebs cycle enzyme mitochondrial dihydrolipoamide succinyltransferase (spot no. 494), ATP synthase subunit beta (spot no. 1454 and 1478 in Table 1),35 and prohibitin (spot no. 987, Table 1), a regulator of the mitochondrial respiration activity.[108]
Prohibitin expression is induced by metabolic stress caused by an imbalance in the synthesis of mitochondrial- and nuclear-encoded mitochondrial proteins [109]. Indirect evidences about mitochondrial transcription un alance derive from the TAp73α-induced down-modulation of the