Effect of zinc cations on kinetics and chirality in porphyrin
J-aggregates
Andrea Romeo,[a,b] Maria Angela Castriciano,[a]* Roberto Zagami,[a] GianMichele Pollicino,[c] Luigi Monsù Scolaro[a,b] * and Robert F. Pasternack[d]
a Istituto per lo Studio dei Materiali Nanostrutturati ISMN-CNR c/o Dipartimento di Scienze Chimiche,
Biologiche, Farmaceutiche ed Ambientali, University of Messina V.le F. Stagno D’Alcontres, 31 98166 Messina, Italy
b Dipartimento di Scienze Chimiche, Biologiche, Farmaceutiche ed Ambientali, University of Messina and
C.I.R.C.M.S.B V.le F. Stagno D’Alcontres, 31 98166 Messina, Italy.
c Dipartimento di Scienze Biomediche, Odontoiatriche e delle Immagini Morfologiche e Funzionali, Sezione SASTAS, University of Messina, Messina, Italy.
d Department of Chemistry and Biochemistry, Swarthmore College, Swarthmore, Pennsylvania PA 19081, USA.
Supporting Information
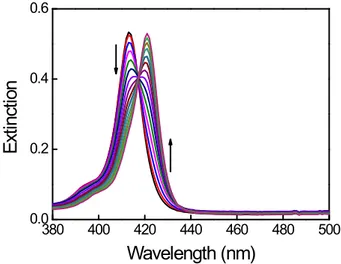
Figure SI1 UV-vis spectral changes during TPPS aqueous solution thermal annealing in glass.
Decreasing of 414 nm specie and increasing of 422 nm specie. (scanning time 5400 s). [TPPS] = 1
μM; T = 330 K.
380 400 420 440 460 480 500 0.0 0.2 0.4 0.6E
xt
in
ct
io
n
Wavelength (nm)
Electronic Supplementary Material (ESI) for Chemical Science.
This journal is © The Royal Society of Chemistry 2016
400 500 600 700 0.0 0.1 0.2 0.3 0.4 0.5 0 500 1000 1500 0.0 0.1 0.2 0.3 0.4 0.5 A b so rb a n ce ( A U ) t /sec
E
xt
in
ct
io
n
Wavelenght (nm)
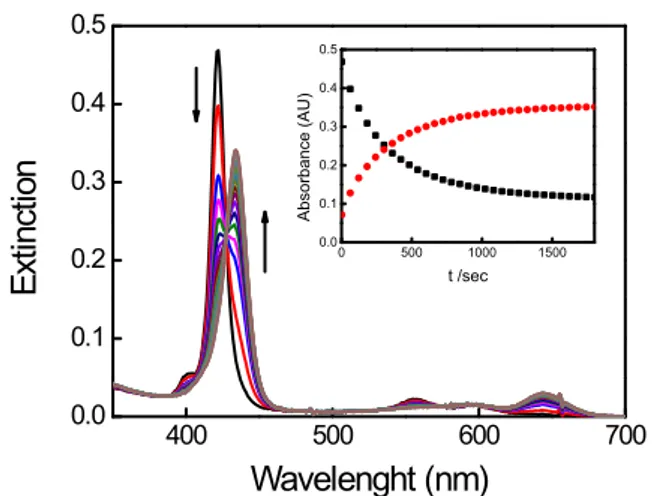
Figure SI2 UV-vis spectral changes for ZnTPPS demetallation (scanning time 60 s). In the inset the
corresponding UV-vis kinetic profile λ = 422 nm (black) and λ = 434 nm (red). [TPPS] = 1 μM,
[HCl] = 0.01 M, T = 298 K.
300 400 500 600 700 5 10 15In
te
ns
ity
(a
rb
. u
n.
)
Wavelength (nm)
Figure SI3. RLS spectra of water (black thin line), TPPS freshly made aqueous solution (full thick
line), after thermal annealing (dashed line) and soon after acidification ([HCl] = 0.5 M) of the
thermal annealed solution (dotted line). [TPPS] = 1 μM; T = 298 K.
0 2000 4000 6000 8000 10000 250 300 350 400 450 -2.5 0.0 2.5 C ou nt s S td . D ev . Channels 0.0 5.0x10⁻⁹ 1.0x10⁻⁸ -0.4 -0.2 0.0 0.2 0.4
r (
t)
t / sec
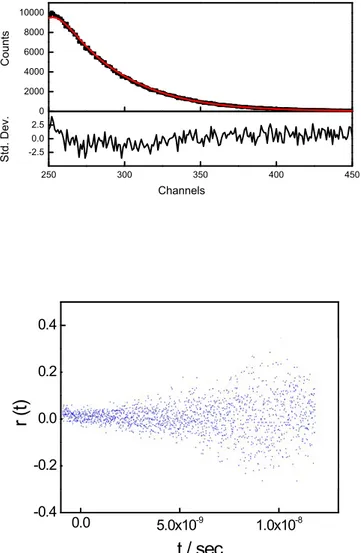
Figure SI4. Fluorescence emission decay (upper) and time resolved fluorescence anisotropy
(lower) of TPPS after thermal annealing, T = 298 K,
ex.= 390 nm,
em.= 606nm.
Figure SI5. . Kinetic parameters m and n for the aggregation of TPPS with HCl 0.5 M as function
of concentration of Zn(II) in solution. Data from table 1.
Table SI1. Conditions for ICP-OES analysis
.Parameters
Power generator 1000 W
Plasma gas flow 12 L min-1
Gas flow support 0.2 L min-1
Nebulising gas flow 1 L min-1
Nebulising pressure 2.98 bar
Speed peristaltic pump 20 rpm
Flow sample introduction 0.99 mL min-1
Table SI2. Acquisition parameters for ICP-OES analysis.
Element (nm) Slits (m) Acquisition mode Integration time (sec)