UNIVERSITY
OF TRENTO
DIPARTIMENTO DI INGEGNERIA E SCIENZA DELL’INFORMAZIONE
38123 Povo – Trento (Italy), Via Sommarive 14 http://www.disi.unitn.it
PLANAR MONOPOLE UWB ANTENNA WITH UNII1/UNII2
WLANBAND NOTCHED CHARACTERISTICS
L. Lizzi, G. Oliveri, P. Rocca, and A. Massa
January 2011
Planar Monopole UWB Antenna with UNII1/UNII2
WLAN-band Notched Characteristics
L. Lizzi, G. Oliveri, P. Rocca, and A. Massa, EMA Fellow
ELEDIA Research Group
Department of Information Engineering and Computer Science University of Trento, Via Sommarive 14, 38050 Trento - Italy Tel. +39 0461 882057, Fax +39 0461 882093
Planar Monopole UWB Antenna with UNII1/UNII2
WLAN-band Notched Characteristics
L. Lizzi, G. Oliveri, P. Rocca, and A. Massa, EMA Fellow
Abstract
In this paper, a planar monopole antenna for Ultra-Wideband (UWB) communications with a notched behavior in the two sub-bands UNII1 and UNII2 of the Wireless Local Area Network (WLAN) band is presented. The antenna geometry is described by means of a spline curve and a rectangular slot. Numerical and experimental results are reported to assess the effectiveness of the proposed design in terms of impedance matching and radiation characteristics.
Key words: Antenna Synthesis, Ultra-Wideband (UW B), Spline Curves, WLAN, UNII, Band Notch.
1 Introduction
In the last years, a great attention has been paid to the topic of home networking defined as the availability of wireless links among different and heterogeneous electronic and multimedia de-vices (HDTVs, DVDs, cameras, personal computers, etc.) for communications, entertainment, home automation and monitoring. Such a paradigm is usually accomplished by setting Wireless Personal Area Networks (WPANs). According to the IEEE 802.15.3a recommendation aimed at defining the WPAN standards, extremely high transmission rates over very short distances are taken into account. Towards this end, a core technology is certainly the Ultra-Wideband (UWB) technology [1]. As a matter of fact, the transmission of very short time pulses occupying very large frequency bandwidths provides high data rates together with other advantages such as low power consumption, multipath immunity, and low probability of intercept. However, despite suitable regulations from the agencies of the different countries (e.g., the Federal Communica-tion Commission - FCC [2]), there are still some concerns about the interferences among UWB systems and other devices that operate with different standards as those exploiting the range of frequencies from 5.15 up to 5.35 GHz [3]. Such a range of frequency is occupied by the first two sub-bands of the Unlicensed National Information Infrastructure (UNII) band. Such sub-bands, called UNII1 and UNII2, range from 5.15 to 5.25 GHz and from 5.25 to 5.35 GHz, respectively, corresponding to a portion of the so-called WLAN band.
In order to prevent/avoid such problems, UWB antennas with notched characteristics in the WLAN band are usually adopted. In [4] this task has been accomplished by introducing a fractal tuning stub in a microstrip slot antenna, while the same behavior has been obtained in [5] by printing a half-wavelength parasitic element on the back side of the antenna substrate. A more complex design approach performs a genetic algorithm optimization [6] to improve the performances of band-notched planar monopoles in terms of both impedance matching and radiation characteristics. Other solutions usually consider slot structures with different shapes within the antenna body [7][3][8][9][10][11] to realize compact systems. Such an approach is the most commonly adopted, but it usually requires two separated design steps. The first step is aimed at obtaining a reference antenna which exhibits a UWB behavior, while in the second one the slot structure is added and its geometrical parameters are tuned to obtain the notched
behavior in the desired frequency range.
This paper presents a prototype of an UWB antenna working within the FCC released fre-quency spectrum and showing a frefre-quency notched behavior within the two UNII1 and UNII2 sub-bands of the WLAN band. The rejection band is yielded by means of a rectangular slot located on the front of the antenna geometry, while the UWB behavior is obtained by defining the contour of the radiating part of the antenna with a spline curve. The use of a rectangular slot allows an easier fabrication with respect to solution based on circular shapes as the one presented in [3]. Moreover, the dimensions of the antenna turn out to be smaller than those of other radiating elements having a rejection band in the same frequency range (e.g., [4]). Finally, differently from solutions such as the one reported in [5], the proposed antenna exhibits quite stable radiation patterns.
The optimization of both the slot and the UWB antenna geometric parameters is carried out simultaneously with a non-negligible saving of the time required for the synthesis. The effec-tiveness of a spline-based representation has been assessed in [12] and successively profitably exploited in designing UWB antennas for wireless communication applications [13][14]. Fol-lowing the scheme presented in such works, the synthesis is here performed by means of a Particle Swarm Optimization (PSO) procedure. Unlike other optimization techniques, such as Genetic Algorithms (GAs), the PSO is based on the cooperation among the trial solutions and not on their competition. In general, one of the main advantages of PSO over GA is its al-gorithmic simplicity. As a matter of fact, GA considers three genetic operators and the best configuration among several options of implementation needs to be chosen, while PSO con-siders one simple operator which is the velocity updating. Moreover, manipulating the PSO calibration parameters is easier than evaluating the optimal values of the GA parameters among various operators. In addiction, there exist many studies regarding the effects of PSO parame-ters that makes their selection even easier [15][16]. Finally, PSO allows a more significant level of control to prevent stagnation of the optimization process [17][18][19].
Differently from [12][13][14], the antenna is now required to exhibit not only a good impedance matching over a very large bandwidth, but also a frequency notched behavior. This requirement is taken into account by adding a term in the PSO cost function [20] to maximize the impedance
mismatch within the UNII1 and UNII2 bands.
The outline of the paper is as follows. Section II is aimed at describing the design of the band notched antenna focusing on the parametrization of the geometry and the definition of the project requirements. In Sect. III, both numerical results and experimental validations are reported to assess the efficiency of the synthesized prototype as well as to give a proof of the reliability of the underlying design strategy. Finally, some conclusions are drawn (Sect. IV).
2 Band Notched Antenna Design
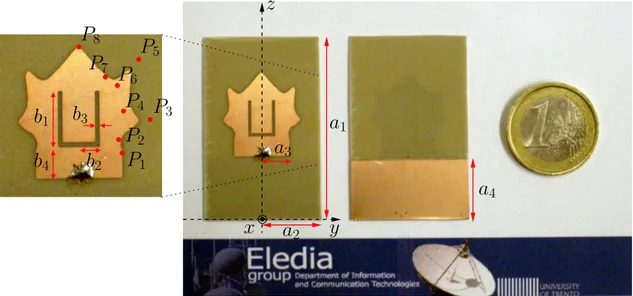
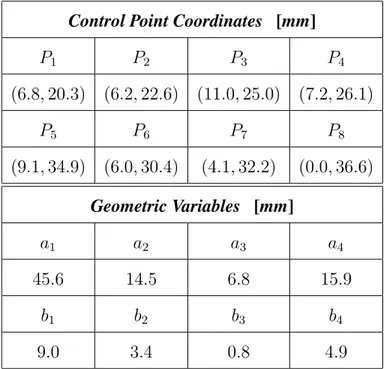
Figure 1 shows the geometry of the antenna described by means of the the spline-based repre-sentation presented in [12] and now suitably integrated to realize a frequency notched behavior. More specifically, the antenna is composed by a metallic patch and a partial metallic plane printed on both sides of a dielectric substrate. Such a structure does not need to be mounted on a larger groundplane (e.g., as for the antenna solution presented in [8]) and therefore it can be easily integrated in small wireless devices. On the front side, the contour of the antenna is modeled through a spline curve of control points Pn = (yn, zn) ; n = 1, ..., 8. The remaining of the patch structure is defined by the following set of geometric parameters: a1(the substrate length), a2(a half of the substrate width), and a3(a half of the feedline width). On the back side, the length of the metallic plane is equal to a4. Consequently, the size of the groundplane turns out to be equal to 2a2× a4 and it is optimized together with the other antenna descriptors. The feeding port is located at (yF = 0.0, zF = a4), while the slot structure is constituted by a sym-metric rectangular shape whose geosym-metric parameters are {b1, ..., b4}. The antenna structure is then univocally identified by the following set of descriptors
χ = {Pn; n = 1, ..., 8; ai, bi; i = 1, ..., 4} . (1)
In order to determine the optimal set of the antenna descriptors, an iterative procedure has been used to fit the following constraints:
|s11(f )| ≥ sf n11 f ∈ [5.15, 5.35] GHz. (3) In (2) and (3), sop11 = −10 dB and sf n11 = −5 dB denote the target values at the operating fre-quency and within the notched bands, respectively. Moreover, the antenna is required to occupy a maximum area of 50 × 50 mm2 in order to be suitably integrated in modern communication devices.
The optimization procedure is based on the integration of a Particle Swarm Optimizer (PSO) [18][21][22][23][24], aimed at defining the strategy of evolution of the trial shapes of the an-tenna, and a standard electromagnetic simulator based on the Method-of-Moment (MoM), de-veloped at the Electromagnetic Diagnostic Laboratory (ELEDIA) of the University of Trento and implemented following the guidelines in [25] and [26], to compute the antenna electric parameters. The MoM is usually more appropriate than other methods such as the Finite Ele-ment Method (FEM) when planar geometries are considered since it is a surface discretization method [27].
More specifically, the optimization of (1) is carried out, according to the PSO logic, by mini-mizing a suitable cost function
Ψ (χ) = Ψ1(χ) + Ψ2(χ) + Ψnotch(χ) (4)
that quantifies the matching between the electric antenna performances and the project con-straints. The terms Ψ1(χ) and Ψ2(χ) in (4) are related to the operating frequency ranges
Ψ1(χ) = Z 4.65 GHz 3 GHz max ½ 0,|s11(f )| − s op 11 sop11 ¾ (5) Ψ2(χ) = Z 10 GHz 5.85 GHz max ½ 0,|s11(f )| − s op 11 sop11 ¾ (6)
while Ψnotch(χ) is concerned with the region where the stopband behavior is required
Ψnotch(χ) = Z 5.35 GHz 5.15 GHz max ( 0,s f n 11 − |s11(f )| sf n11 ) . (7)
position of each particle, which corresponds to a trial antenna configuration, has been randomly initialised within the range of physically admissible values. The positions of the particles of the swarm is iteratively updated on the basis of the corresponding values of the cost function (4) and the PSO control parameters: w (inertial weight), C1 and C2 (acceleration coefficients). In such a case-of-study, these latter have been set to C1 = C2 = 2.0 and w = 0.4 as suggested in [17][19]. The optimization procedure ends when a maximum number of K iterations (here K = 500) is reached or the value of the fitness function Ψ (χ) is smaller than a user-defined tolerance value ηΨ(here ηΨ = 10−5).
The final outcome of the PSO-based optimization procedure when applied to the synthesis problem defined by (2) and (3) has been the shape described by the parameter set in Tab. I. As it can be noticed, the synthesized antenna fits the size constraint occupying an area of 29.0 × 45.6 mm2.
3 Numerical and Experimental Assessment
The performances of the synthesized antenna have been both numerically and experimentally assessed. Towards this aim, a prototype (Fig. 1) of the antenna has been built with an easy and low-cost photo-lithographic technology. The antenna has been printed on an Arlon dielectric substrate (εr = 3.38) of 0.78 mm thickness. As for the measurements, the prototype has been fed with a coaxial cable connected to the beginning of the feedline and grounded to the edge of the metallic plane on the opposite side of the substrate. The coaxial cable has been equipped with a standard SMA connector and it has been connected to a vector network analyser to evalu-ate the electrical characteristics of the synthesized antenna. In order to reduce the interferences with the antenna radiating behavior, the feeding cable was connected perpendicularly to the antenna plane. The measurements have been collected in a non-controlled environment.
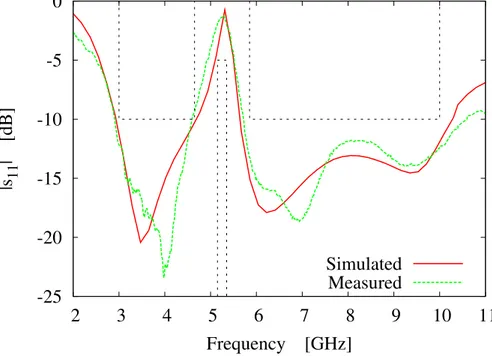
Concerning the impedance matching, Figure 2 shows a comparison between simulated and measured magnitudes of the s11coefficient over the frequency range of interest. Dashed identify the mask of the requirements to be satisfied [Eqs. (2) and (3)]. As it can be observed, the antenna complies the electrical guidelines since the simulated s11magnitude values turn out to be greater than −5 dB within the frequency range 5.10 − 5.50 GHz avoiding the transmission/reception in
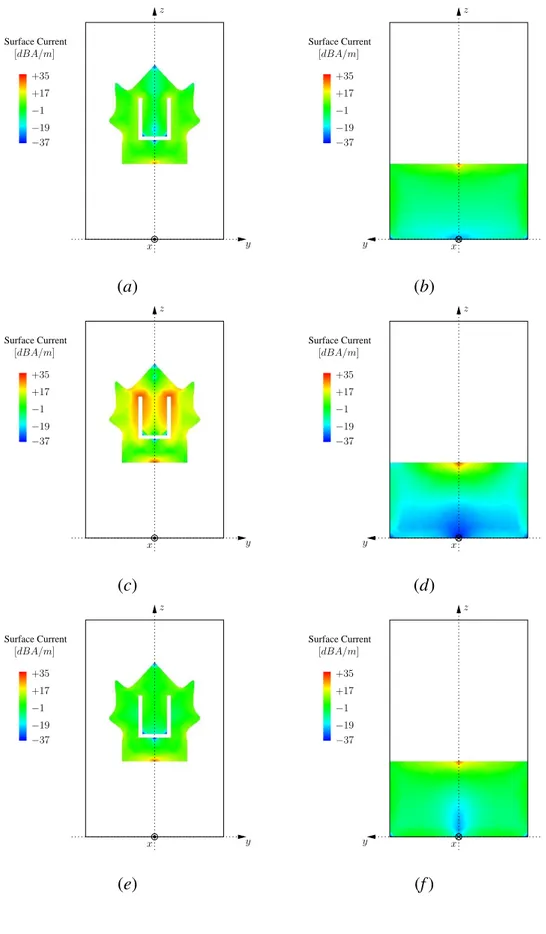
the UNII1 and UNII2 bands. This is confirmed also by the measured rejection bandwidth going from 4.95 to 5.50 GHz. On the other hand, the prototype still provides an UWB behavior thanks to the impedance matching in the remaining part of the 3 − 10 GHz range. As a matter of fact, the arising |s11| ≤ −10 dB bandwidths turn out to be 3.0 − 4.65 GHz and 5.75 − 10.5 GHz, with an adequate agreement between measured and simulated data. It is worth to notice that, while the UWB behavior is mainly due to the curvilinear shape of the metallic patch on the front side of the antenna (as confirmed by the related literature, e.g. [12]), the notched characteristic is tuned by the shape and the dimension of the slot as highlighted by the behavior of the surface current distributions simulated at f1 = 4 GHz, fnotch = 5.25 GHz, and f2 = 8 GHz (Fig. 3). The electric currents concentrate around the slot structure in correspondence with the center frequency of the unwanted band [Fig. 3(c)] pointing out the effect of the slot on the antenna performance at the notched frequency. It can be also observed that the amplitude of current is greater at the top of the two vertical arms of the slot, where the slot edges are closer to the contour of the patch. On the other hand, the currents mainly move towards the edge of the metallic patch when the operating frequency is lower [Fig. 3(a)] or higher [Fig. 3(e)] than fnotch. Weaker current values around the slot imply that the slot does not affect the impedance matching of the antenna. On the back side of the antenna, the current distribution is almost uniform over the metallic plane at f1 = 4 GHz and f2 = 8 GHz except for the feeding point (greater values) and in the bottom region (lower values) at the rejection band.
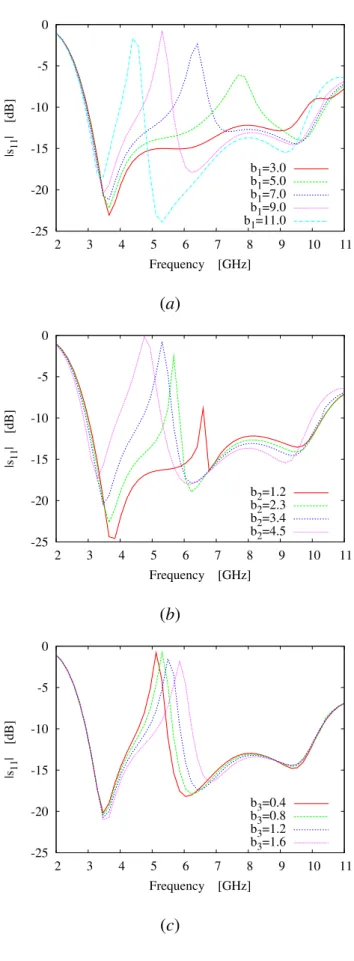
In order to better understand the effect of the slot, a parametric study on its describing parame-ters has been performed. Figure 4 shows the behavior of the magnitude of the s11parameter for different values of b1, b2, and b3. All the other antenna descriptors have been kept fixed to the optimized values. By varying b1and b2 the overall length of the slot is modified. As expected, increasing the slot length leads to the shift towards the lower frequencies of the rejection band [Figs. 4(a) and 4(b)]. On the other hand, by enlarging the thickness of the slot, the rejection band moves towards the higher frequencies [Fig. 4(c)].
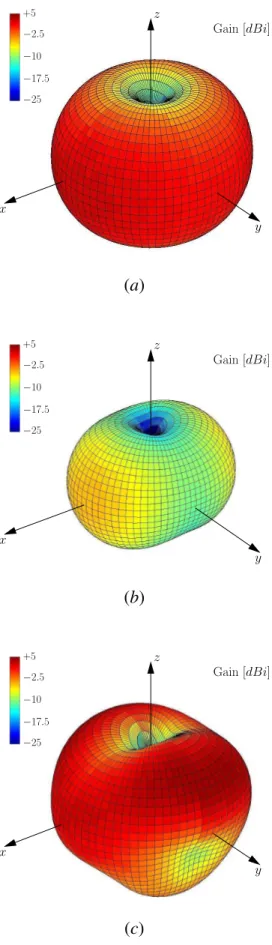
The radiation characteristics of the synthesized antenna have been analysed, as well. Figure 5 shows the three-dimensional representation of the radiation pattern at the same frequencies of the plots of the surface currents in Fig. 3. More specifically, the so-called “realized” (i.e.,
including the impedance mismatch losses) absolute gain is reported. The pattern at fnotch = 5.25 GHz [Fig. 5(b)] proves that the antenna has a much lower gain in the notched band than at the other frequencies.
It can be also noticed that the antenna behaves like a classical monopole at the lower frequencies, while some distortions appear when the operating frequency increases. Such a behavior is further pointed out in Fig. 6 where simulated and measured absolute gains of the antenna along the horizontal (θ = 90o) and vertical (φ = 90o) planes are compared when f
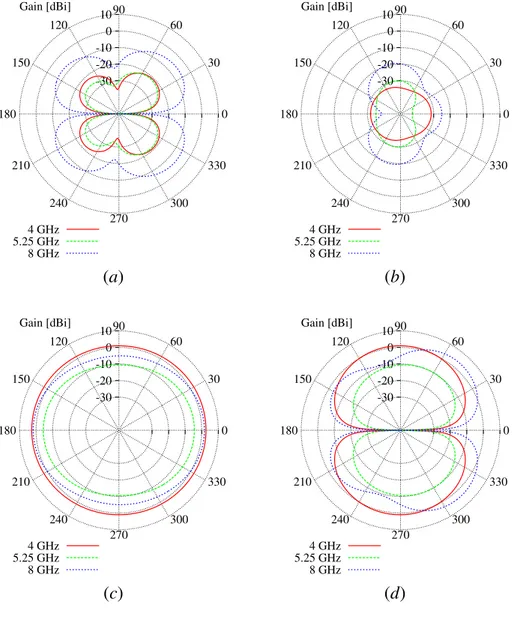
1 = 4 GHz, fnotch = 5.25 GHz, and f2 = 8 GHz. The antenna gain is almost omnidirectional in the horizontal plane whatever the frequency under analysis [Figs. 6(a), 6(c), and 6(e)], while two nulls are visible along the vertical plane at θ = 0o and θ = 180o [Figs. 6(b), 6(d), and 6(f )]. As expected and already shown in Fig. 5, the gain at the notched frequencies is almost 10 dB lower than the one exhibited around f1 = 4 GHz.
For completeness, Figure 7(a) and 7(b) show the behavior of the cross-polar gain components in the horizontal and vertical planes, respectively. It can be noticed that in the horizontal plane, the cross-polar component is very small at f1 = 4 GHz and fnotch = 5.25 GHz, while it increases just at f2 = 8 GHz. On the other hand, it turns out to be always lower than −20 dB whatever the considered frequency in the vertical plane. For the sake of comparison, the behavior of the co-polar components are also reported in Fig. 7(c) and 7(d).
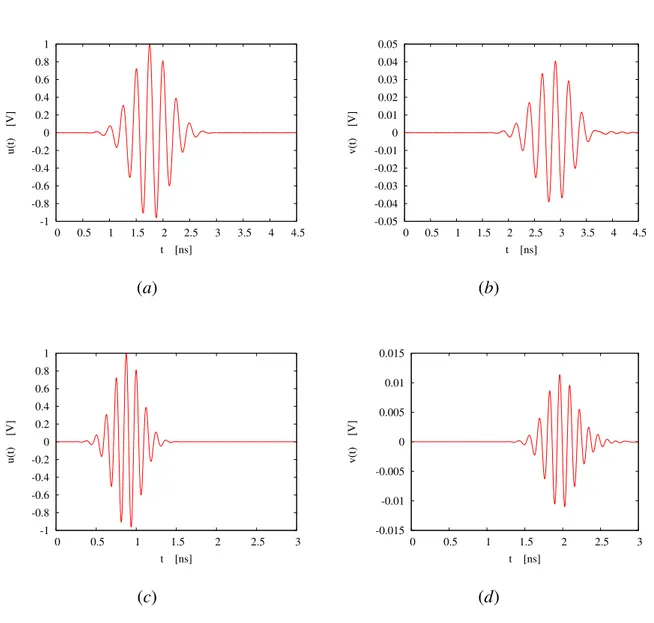
Since the antenna is intended for UWB applications, the distortion of the transmitted waveform has been finally evaluated. Towards this end, a UWB communication system has been simu-lated. Two identical copies of the antenna prototype have been placed face-to-face and separated by a distance of 25 cm [28]. Moreover, two Gaussian pulses (one with spectral content in the lower UWB band from 3 to 5 GHz [Fig. 8(a)] and the other extended over the higher UWB band from 6 to 10 GHz [Fig. 8(c)]) have been separately used as input signals of one antenna used as transmitter. Figures 8(b) and 8(d) show the received waveforms at the other antenna. Despite the low amplitudes, the shapes of the received signals are very close to the transmitted ones. The arising distortion can be quantified by means of the system fidelity
F = max τ Z +∞ −∞ e v (t − τ ) eu (t) dt (8)
defined as the maximum value of the cross-correlation between the transmitted signal and the received one [29]. In (8), both waveforms are normalized to their energy so that eu (t) , u (t) /qR−∞+∞|u (t)|2dt and ev (t) , v (t) /qR−∞+∞|v (t)|2dt. As an example, let us consider that F = 100% in correspondence with an ideal transmission without distortions. As for the case at hand, the fidelity indexes are F = 98.11% and F = 92.46% for Figs. 8(a)-8(b) and Figs. 8(c)-8(d), respectively. Such results assess the non-distortion features of the system in both UWB bands.
4 Conclusions
In this paper, the design of an UWB antenna working within the FCC released frequency spec-trum and showing rejection characteristics in the UNII1 and UNII2 sub-bands of the WLAN band has been presented. Representative results from a set of numerical and experimental ex-periments have assessed the reliability and the efficiency of the antenna prototype in terms of impedance matching, radiation properties, and non-distortion capabilities. Future works will be aimed at studying the possibility of achieving the band notched characteristic with different shapes by using the PSO.
References
[1] T. Ma and S. Wu, “Ultrawideband band-notched folded strip monopole antenna,” IEEE Trans. Antennas Propag., vol. 55, no. 9, pp. 2473-2479, 2007.
[2] Federal Communication Commission, First Report and Order, “Revision of part 15 of the commission’s rules regarding ultra-wideband transmission systems,” FCC 02-48, 2002. Available: http://hraunfoss.fcc.gov/edocs_public/attachmatch/FCC-02-48A1.pdf
[3] J. Kim, C. S. Cho, and J. W. Lee, “5.2 GHz notched ultra-wideband antenna using slot-type SRR,” Electron. Lett., vol. 42, no. 6, pp. 315-316, 2006.
[4] W. J. Lui, C. H. Cheng, Y. Cheng, and H. Zhu, “Frequency notched ultra-wideband mi-crostrip slot antenna with fractal tuning stub,” Electron. Lett., vol. 41, no. 6, pp. 294-295, 2005.
[5] N. Choi, C. Jung, J. Byun, F. J. Harackiewicz, M. Park, Y. Chung, T. Kim, and B. Lee, “Compact UWB antenna with I-shaped band-notch parasitic element for laptop applica-tions,” IEEE Antennas Wireless Propag. Lett., no. 8, pp. 580-582, 2009.
[6] A. J. Kerkhoff and H. Ling, “Design of a band-notched planar monopole antenna using genetic algorithm optimization,” IEEE Trans. Antennas Propag., vol. 55, no. 3, pp. 604-610, 2007.
[7] T. Dissanayake and K. P. Esselle, “Prediction of the notch frequency of slot loaded printed UWB antennas,” IEEE Trans. Antennas Propag., vol. 55, no. 11, pp. 3320-3325, 2007.
[8] J. Martinez-Fernandez, V. de la Rubia, J. M. Gil, and J. Zapata, “Frequency notched UWB planar monopole antenna optimization using a finite element method-based approach,” IEEE Trans. Antennas Propag., vol. 56, no. 9, pp. 2884-2893, 2008.
[9] H. J. Zhou, B. H. Sun, Q. Z. Liu, and J. Y. Deng, “Implementation and investigation of U-shaped aperture UWB antenna with dual band-notched characteristics,” Electron. Lett., vol. 44, no. 24, pp. 1387-1388, 2008.
[10] Q. Chu and Y. Yang, “A compact ultrawideband antenna with 3.4/5.5 GHz dual band-notched characteristics;” IEEE Trans. Antennas Propag., vol. 56, no. 12, pp. 3637-3644, 2008.
[11] H. Liu, C. Ku, and C. Yang, “Novel CPW-Fed planar monopole antenna for WiMAX/WLAN applications,” IEEE Antennas Wireless Propag. Lett., no. 9, pp. 240-243, 2010.
[12] L. Lizzi, F. Viani, R. Azaro, and A. Massa, “A PSO-driven spline-based shaping approach for ultrawideband (UWB) antenna synthesis,” IEEE Trans. Antennas Propag., vol. 56, no. 8, pp. 2613-2621, 2008.
[13] F. Viani, L. Lizzi, R. Azaro, and A. Massa, “Spline-shaped ultra-wideband antenna oper-ating in ECC released frequency spectrum,” Electron. Lett., vol. 44, no. 1, pp. 7-8, 2008.
[14] F. Viani, L. Lizzi, R. Azaro, and A. Massa, “A miniaturized UWB antenna for wireless dongle devices,” IEEE Antennas Wireless Propag. Lett., vol. 7, pp. 714-717, 2008.
[15] J. Robinson and Y. Rahmat-Samii, “Particle swarm optimization in electromagnetics,” IEEE Trans. Antennas Propag., vol. 52, no. 2, pp. 397-407, Feb. 2004.
[16] R. C. Eberhart and Y. Shi, “Particle swarm optimization: developments, applications and resources,” in Proc. Congress on Evolutionary Computation, Seul, Corea, 2001, pp. 81-86.
[17] M. Donelli and A. Massa, “Computational approach based on a particle swarm optimizer for microwave imaging of two-dimensional dielectric scatterers,” IEEE Trans. Microwave Theory Techn., vol. 53, pp. 1761-1776, 2005.
[18] M. Donelli, R. Azaro, F. De Natale, and A. Massa, ”An innovative computational approach based on a particle swarm strategy for adaptive phased-arrays control,” IEEE Trans. An-tennas Propag., vol. 54, no. 3, pp. 888-898, Mar. 2006.
[19] P. Rocca, M. Benedetti, M. Donelli, D. Franceschini, and A. Massa, ”Evolutionary opti-mization as applied to inverse problems,” Inverse Problems, vol. 25, doi: 10.1088/0266-5611/25/12/123003, Dec. 2009.
[20] L. Lizzi, F. Viani, and A. Massa, “Dual-band spline-shaped PCB antenna for Wi-Fi Ap-plications,” IEEE Antennas Wireless Propag. Lett., vol. 8, pp. 616-619, 2009.
[21] A. Martini, M. Donelli, M. Franceschetti, and A. Massa, “Particle density retrieval in random media using a percolation model and a particle swarm optimizer,” IEEE Antennas Wireless Propagat. Lett., vol. 7, pp. 213-216, 2007.
[22] M. Donelli, D. Franceschini, P. Rocca, and A. Massa, “Three-dimensional microwave imaging problems solved through an efficient multi-scaling particle swarm optimization,” IEEE Trans. Geosci. Remote Sens., vol. 47, no. 5, pp. 1467-1481, May 2009.
[23] M. Donelli, A. Martini, and A. Massa, ”A hybrid approach based on PSO and Hadamard difference sets for the synthesis of square thinned arrays,” IEEE Trans. Antennas Propa-gat., vol. 57, no. 8, pp. 2491-2495, Aug. 2009.
[24] L. Poli, P. Rocca, L. Manica, and A. Massa, “Handling sideband radiations in time-modulated arrays through particle swarm optimization,” IEEE Trans. Antennas Propag., vol. 58, no. 4, pp. 1408-1411, Apr. 2010.
[25] C. A. Balanis, Antenna Theory: Analysis and Design. New York: Wiley, 1982.
[26] S. Rao, D. Wilton, and A. Glisson, “Electromagnetic scattering by surfaces of arbitrary shape,” IEEE Trans. Antennas Propag., vol. 30, pp. 409-418, May 1982.
[27] T. Weiland, M. Timm, and I. Munteanu, “A practical guide to 3-D simulation,” IEEE Microw. Magazine, vol. 9, no. 6, pp. 62-75, Dec. 2008.
[28] C. R. Medeiros, J. R. Costa, C. A. Fernandes, “Compact tapered slot UWB antenna with WLAN band rejection,” IEEE Antennas Wireless Propag. Lett., vol. 8, pp. 661-664, 2009.
[29] D. Lamensdorf and L. Susman, “Baseband-pulse-antenna techniques,” IEEE Antennas Propag. Magazine, vol. 36, pp. 20-30, 1994.
FIGURE CAPTIONS
• Figure 1. Antenna prototype and descriptive parameters.
• Figure 2. Behavior of the magnitude of s11within the UWB frequency range.
• Figure 3. Plots of the surface currents at f1 = 4 GHz [(a) Front side and (b) back side], fnotch = 5.25 GHz [(c) Front side and (d) back side], and f2 = 8 GHz [(e) Front side and (f ) back side].
• Figure 4. Behavior of the magnitude of s11varying the parameters (a) b1, (b) b2, and (c) b3describing the slot.
• Figure 5. Three-dimensional representation of the absolute gain pattern at (a) f1 = 4 GHz, (b) fnotch = 5.25 GHz, and (c) f2 = 8 GHz.
• Figure 6. Behavior of the absolute gain at (a)-(b) f1 = 4 GHz, (c)-(d) fnotch = 5.25 GHz, and (e)-(f ) f2 = 8 GHz along (a)(c)(e) the horizontal (θ = 90o) and (b)(d)(f ) the vertical plane (φ = 90o).
• Figure 7. Behavior of the (a)-(b) cross-polar and (c)-(d) co-polar gain components along (a)-(c) the horizontal (θ = 90o) and (b)-(d) the vertical plane (φ = 90o) at f
1 = 4 GHz, fnotch = 5.25 GHz, and f2 = 8 GHz.
• Figure 8. Transmitted (a)(c) and received (b)(d) pulses at the frequency bands (a)(b) 3 − 5 GHz and (c)(d) 6 − 10 GHz of the UWB system composed of two identical face-to-face copies of the proposed antenna.
FIGURE CAPTIONS
y
a
2a
1a
4x
z
P
1P
2P
3P
5P
6P
7P
8b
3b
1P
4b
4b
2a
3-25 -20 -15 -10 -5 0 2 3 4 5 6 7 8 9 10 11 |s 11 | [dB] Frequency [GHz] Simulated Measured
Surface Current −37 −1 +17 +35 −19 x z [dBA/m] y Surface Current −37 −1 +17 +35 −19 z [dBA/m] x y (a) (b) Surface Current −37 −1 +17 +35 −19 x z [dBA/m] y Surface Current −37 −1 +17 +35 −19 z [dBA/m] x y (c) (d) Surface Current −37 −1 +17 +35 −19 x z [dBA/m] y Surface Current −37 −1 +17 +35 −19 z [dBA/m] x y (e) (f )
-25 -20 -15 -10 -5 0 2 3 4 5 6 7 8 9 10 11 |s11 | [dB] Frequency [GHz] b1=3.0 b1=5.0 b1=7.0 b1=9.0 b1=11.0 (a) -25 -20 -15 -10 -5 0 2 3 4 5 6 7 8 9 10 11 |s11 | [dB] Frequency [GHz] b2=1.2 b2=2.3 b2=3.4 b2=4.5 (b) -25 -20 -15 -10 -5 0 2 3 4 5 6 7 8 9 10 11 |s11 | [dB] Frequency [GHz] b3=0.4 b3=0.8 b3=1.2 b3=1.6 (c)
Gain [dBi] z +5 −2.5 −25 −10 −17.5 x y (a) Gain [dBi] z +5 −2.5 −25 −10 −17.5 x y (b) Gain [dBi] z +5 −2.5 −25 −10 −17.5 x y (c)
-30 -20 -10 0 10 Gain [dBi] 0 30 60 90 120 150 180 210 240 270 300 330 Simulated Measured -30 -20 -10 0 10 Gain [dBi] 0 30 60 90 120 150 180 210 240 270 300 330 Simulated Measured (a) (b) -30 -20 -10 0 10 Gain [dBi] 0 30 60 90 120 150 180 210 240 270 300 330 Simulated Measured -30 -20 -10 0 10 Gain [dBi] 0 30 60 90 120 150 180 210 240 270 300 330 Simulated Measured (c) (d) -30 -20 -10 0 10 Gain [dBi] 0 30 60 90 120 150 180 210 240 270 300 330 Simulated Measured -30 -20 -10 0 10 Gain [dBi] 0 30 60 90 120 150 180 210 240 270 300 330 Simulated Measured (e) (f )
-30 -20 -10 0 10 Gain [dBi] 0 30 60 90 120 150 180 210 240 270 300 330 4 GHz 5.25 GHz 8 GHz -30 -20 -10 0 10 Gain [dBi] 0 30 60 90 120 150 180 210 240 270 300 330 4 GHz 5.25 GHz 8 GHz (a) (b) -30 -20 -10 0 10 Gain [dBi] 0 30 60 90 120 150 180 210 240 270 300 330 4 GHz 5.25 GHz 8 GHz -30 -20 -10 0 10 Gain [dBi] 0 30 60 90 120 150 180 210 240 270 300 330 4 GHz 5.25 GHz 8 GHz (c) (d)
-1 -0.8 -0.6 -0.4 -0.2 0 0.2 0.4 0.6 0.8 1 0 0.5 1 1.5 2 2.5 3 3.5 4 4.5 u(t) [V] t [ns] -0.05 -0.04 -0.03 -0.02 -0.01 0 0.01 0.02 0.03 0.04 0.05 0 0.5 1 1.5 2 2.5 3 3.5 4 4.5 v(t) [V] t [ns] (a) (b) -1 -0.8 -0.6 -0.4 -0.2 0 0.2 0.4 0.6 0.8 1 0 0.5 1 1.5 2 2.5 3 u(t) [V] t [ns] -0.015 -0.01 -0.005 0 0.005 0.01 0.015 0 0.5 1 1.5 2 2.5 3 v(t) [V] t [ns] (c) (d)
Control Point Coordinates [mm] P1 P2 P3 P4 (6.8, 20.3) (6.2, 22.6) (11.0, 25.0) (7.2, 26.1) P5 P6 P7 P8 (9.1, 34.9) (6.0, 30.4) (4.1, 32.2) (0.0, 36.6) Geometric Variables [mm] a1 a2 a3 a4 45.6 14.5 6.8 15.9 b1 b2 b3 b4 9.0 3.4 0.8 4.9