Which is the Right Source for Vulnerability Studies? An
Empirical Analysis on Mozilla Firefox
Fabio Massacci
University of Trento, Italy
[email protected]
Viet Hung Nguyen
University of Trento, Italy
[email protected]
ABSTRACT
The last years have seen a major trend towards the no-tion of quantitative security assessment and the use of em-pirical methods to analyze or predict vulnerable compo-nents. Many past researches focused on vulnerability dis-covery models. The common method is to rely upon either a public vulnerability database (CVE, NVD), or vendor vul-nerability database. Some combine these databases. Most of these works address a knowledge problem: can we under-stand the empirical causes of vulnerabilities? Can we predict them? Still, if the data sources do not completely capture the phenomenon we are interested in predicting, then our predictor might be optimal with respect to the data we have but unsatisfactory in practice.
In our work, we focus on a more fundamental question: the quality of vulnerability database. How good we are at sampling? Or, with respect to the research objectives of cur-rent papers on empirical study in security, are we sampling the right data?
Categories and Subject Descriptors
H.4 [Information Systems Applications]: Miscellaneous; D.2.8 [Software Engineering]: Metrics—complexity mea-sures, performance measures
General Terms
Security
1.
INTRODUCTION
Recent years have seen a major trend towards the notion Quantitative Security Assessment : a number of books on se-curity metrics [18] and economics of sese-curity [16], a workshop on security and economics (WEIS), a practictional workshop ∗
This work is partial supported under grant of the FP7-FET-IP-SECURECHANGE project (www.securechange. eu).
Permission to make digital or hard copies of all or part of this work for personal or classroom use is granted without fee provided that copies are not made or distributed for profit or commercial advantage and that copies bear this notice and the full citation on the first page. To copy otherwise, to republish, to post on servers or to redistribute to lists, requires prior specific permission and/or a fee.
Copyright 20XX ACM X-XXXXX-XX-X/XX/XX ...$10.00. Code Base Vul. DB1 Vul. DB2 Time
SAMPLER Magic Trainer
PREDICTOR
<Si, Vi, ti>
® ® ®
Vulnerable? Yes/No
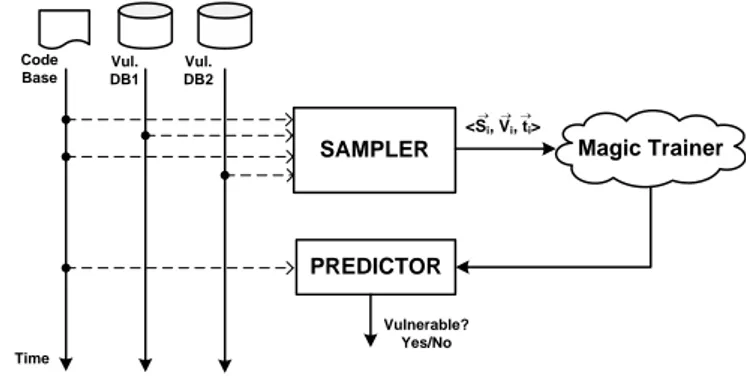
Figure 1: The Vulnerability Predictor Experimental Set-Up
at USENIX (MetriCon), a more scientific one at CCS and ESEM (QoP, now Metrisec) and a number of papers ap-pearing in journal and conferences that analyze attacks and vulnerability trends, correlated vulnerability with character-istics of components and software evolution.
Most of these works address a knowledge problem: can we understand the empirical causes of vulnerabilities? Can we predict them? For example, Meneely and Williams provide some preliminary evidence that unfocussed developers are a potential cause for the introduction of vulnerability in Linux [22].
If we can successfully attain this knowledge, then devel-opers and tester could concentrate their effort in order to reduce or eliminate vulnerability on components that are predicted to be likely vulnerable. Even if we have no expla-nation capability but at least a black-box that tells us that empirically component X is likely to be more vulnerability prone than component Y. Then we could spend our testing budget on security tests for Y.
Figure 1 illustrates the common schema for most research papers. The experimenter analyzes the code for source code metrics, ~S, and then samples one or more vulnerability databases to determine information of vulnerable code entities, ~V . The ~
S and ~V vectors are associated with timestamps, ~t. Most economics of security papers stops here and just plots data of correlating information. Other papers go a step further and feed this information to some magic box (statistical cor-relation, machine learning etc) that produces a “law of vul-nerability” i.e., a predictor. The final step is then feeding new code entities to check whether the predictor is actually accurate on new data.
These studies focus on predicting or understanding vul-nerabilities, and discuss how good they are at solving this problem but did not provide any claim about the quality of the data source they use to validate their experiments.
1.1
The Contribution of this paper
It is clear that if the data sources do not completely cap-ture the phenomenon we are interested in predicting our pre-dictor might be optimal with respect to the data we have but unsatisfactory in practice.
The preliminary study that we have done on Mozilla Fire-fox shows that there are a number of phenomena in the evolution of code and vulnerabilities that make the choice of the data source critical: the natural data source might turn out to be good for answering a research question (e.g., the time-to-discovery-time-to-fix) but totally inadequate to answer another closely related question (e.g., the total vul-nerabilities of a component).
This motivates our research question Which is the right source for the analysis of vulnerability?.
In the next section we discuss our research question more in details and how its answer can impact the “traditional” research questions in quantitative security assessment. Then we present a comprehensive description of the public Data Sources for vulnerabilities (§3) and provide a classification of the main features they possesses. This information is the stepping stone to understand on which data a number of related works in quantitative security assessment has ad-dressed their own research question (§4). We than discuss an experimental set-up that integrates these various data sources (§5) in order to see whether a broader picture can show some information on the suitability of the various data sources for one or another research question (6). It turns out that this is indeed the case. Finally we discuss the threats to the validity of our experimental findings (§7) and conclude (§8).
2.
RESEARCH QUESTION
As we have already claimed, previous work mostly follows the empirical approach which firstly collects vulnerability information from different sources, then works out on the data to find solutions for their questions, following the path of Figure 1. These research questions could be categorized in several research topics. Here after we present some of the most popular topics in the last decade.
Fact Finding (RP1). Describe the state of practice in the field [27, 29, 31, 32]. They provide data and aggregate statistics but not models for prediction. Some research questions picked from prior studies are “What is the median lifetime of a vulnerability?” [31], “Are reporting rate declining?” [31, 32].
Modeling (RP2). Find mathematical models for vulnera-bility study [1–7, 32]. Working on the topic researchers raise mathematical descriptions of the evolution of vul-nerability, and collect facts to validate their proposal. Prediction (RP3). Predict defected/vulnerable component [9, 13, 15, 19, 23, 25, 27, 29, 33–35, 39, 40]. The main con-cern of these papers is to find a metric or a set of metrics that correlate with vulnerability in order to predict vulnerable components. Based on this, several
predictor models are generated to measure the vulner-able levels of new components.
If we look at the issue of median lifetime of vulnerability, papers in the first group will produce statistics on various software and the related vulnerability lifetime. Meanwhile, papers in the second group will identify a mathematical law that describes the lifetime of a vulnerability e.g., thermo-dynamic model [7], logistics model [3]. The good papers in the group will provide experimental evidences that support the model, e.g., [2, 3, 5]. Studies on this topic aim to obtain increase the goodness-of-fit of their models, or they try to answer the question “How good does our model fit the fact?”. The last group will identify a software characteristics (or attributes) that correlate with the lifetime of the vulnerabil-ity, use this attributes to predict whether a software compo-nent will exhibit a vulnerability during its lifetime. These papers usually use statistics and machine learning methods and back up their claim with some empirical evidence. These studies focus on the attribute and the quality of prediction, and they aim to answer the question “How good we are at predicting?”
Papers in the two last areas only focused on the objectives, but did not give (or limit) any discussion about the quality of the vulnerability their researches are built on. In fact, the quality of the data sources directly affects the goodness-of-fit as well as the quality of prediction. If the mathematical model fits the data very well, and the prediction quality is very high, but the underlying vulnerability database con-tains some “unreal” data, the predictor makes no sense.
In this work, we want to discuss “How good we are at sampling?”, Or with respect to the research objective, “Are we sampling the right data?”. More concretely, we aim to identify:
• The vulnerability database.
• Which features of vulnerability are needed (useful) to answer some research questions.
• If there are aspects of the underlying evolution of soft-ware and vulnerabilities that require different features beside the natural ones to answer some research ques-tions.
3.
DATA SOURCES
There are hundreds of databases that keep track of secu-rity related issues for different software applications: just by navigating on SecurityTracker (www.securitytracker.com), we found over 157 databases and security advisories. These databases can be classified by some criteria such at free or not free, public or private, and vendor or third party. Un-fortunately, many of them lack detailed information and are out of date, which significantly restrict the choice of data sources to assess. Hereafter, we describe some of the most popular (and usable) vulnerability databases and some of the less popular ones that are related to our study.
We classify databases in three classes based on their target products, they are: multi-vendor databases, vendor databases, and others. Here, we just briefly present these databases.
The first class is the multi-vendor databases, which in-cludes:
• Bugtraq is an electronic mailing list about computer security, which publishes information about
vulnera-ID Feature Multi-vendor DB Vendor DB Misc. DB B u g traq CE R T CV E OS V DB N VD IS S / X fo rce Op e n B S D M S S ec . Bu ll eti n M F S A B u g z il la PR OM IS E M DP N VDB Ou r DB # ID/Title x x x x x x x x x x x x x R
ef. R2R1 CVE IDReporter xx x x xx x x xx x xx xx
R3 References Link x x x x x x x x x Ti me T1 Injection date x x T2 Discovery date x x x x x T3 Fixed date x x x x T4 Published Date x x x x x x x x x x
T5 Exploit publish date x
T6 Updated Date x x x x x T7 Recorded Date x x Imp a c t I1 Description x x x x x x x x x x x x I2 Classifcation/Category x x x x I3 Impact/Severity/CVSS Score x x x x x x x x I4 Solution x x x Co d e C1 Version at discovery x x x* x x
C2 First vulnerable version x x
C3 Other affected versions x x x x x x x x
C4 Non Vulnerable/Fixed versions x x x x x
C5 Reference to codebase x x x
C6 Source code metrics x x
C7 Component x x x
*: this information is depend on software vendor e.g., in RedHat Bugzilla, this feature is the software version. Meanwhile, in Mozilla Bugzilla, this feature is the branch version in source control.
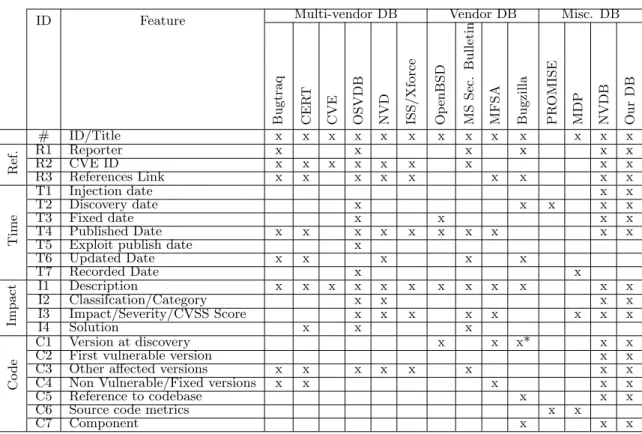
Table 1: The common features of vulnerability databases
bilities of many products, regardless of software vendor response.
• Common Vulnerabilities Exposure (CVE) is just a global identifier dictionary for vulnerability.
• National Vulnerability Database (NVD) provides ex-panded information and references to vulnerable soft-ware for CVE vulnerability.
• Open Source Vulnerability Database (OSVDB) is an-other public open vulnerability database created by and for the security community.
• ISS/XForce is another multi-target vulnerability database run by IBM. Each entry of ISS/XForce contains almost the same information as Bugtraq.
The second class includes databases maintained by soft-ware vendors, in which they announce bug and security in-formation about their product. Among of them, they are:
• OpenBSD errata bulletin is the security bulletin for OpenBSD.
• Microsoft Security bulletin is the security bulletin for many products of Microsoft e.g., Windows, Internet Explorer.
• Mozilla Foundation Security Advisories (MFSA) is the vulnerability report for Mozilla products
• Bugzilla is a web-based application that keeps track of programming bugs. In this work, we consider two instances of Bugzilla, which are Mozilla Bugzilla and RedHat Linux Bugzilla. The former is a defect database of all Mozilla products, and the later includes RedHat Linux.
The third class includes all other databases that do not belong to above. Mostly, they are sanitized defected data of anonymous applications. These databases are essential suited for testing purpose. These databases include:
• Predictor Models In Software Engineering (PROMISE) is a repository hosting many data sets used in many predictive models. PROMISE data sets are contributed by researchers in field.
• NASA IV&V Facility Metrics Data Program (MDP) is a sanitized repository that stores defected data and metrics data for several products.
• OpendBSD Vulnerability Database (NVDB) [30]: is a vulnerability database of OpenBSDB constructed for studying vulnerability discovery process.
To sum up this section, a comparison of their features is shown in Table 1.
The features fall into four groups, except the very basic ID/Title one.
The first one, Reference, describes the source of the vul-nerability or cross references to other databases. Almost
databases credit vulnerability reporters and have reference to the global dictionary, CVE.
The second group, Time, includes several features describ-ing life-cycle of vulnerabilities e.g., the time when vulnera-ble code is inserted into code base, Injection date, time when vulnerability is discovered, Discovery date. Two other addi-tional dates denote the time when a vulnerability report is recorded in the database, and the time when this report is updated i.e, new affected version is added. All these time in-formation is crucial for vulnerability analysis. For example, in vulnerability lifetime analysis, the Injection date is very important, but most databases do not provide this infor-mation. Therefore, the vulnerabilities appear younger than they are. This may bias the analysis.
The third group, Impact, depicts the impact of a vulner-ability, which are the short description, the classification, the severity and solution for the vulnerability. The impact value is not standardized. So it is not clear whether having a critical vulnerability compare with one having high im-pact and which was the underlying criteria. The existing Common Vulnerability Scoring System (CVSS) provides a list of criteria, and calculates the score for each vulnerabil-ity. However, it highly depend on human judgement and it is not truly reproducible.
The last group, Code, is about the software versions and code base related to a vulnerability. Software version data include version where a vulnerability is discovered; list of versions which are/are not vulnerable by the vulnerability, and the earliest version. Related code base data are affected component, references to source modules (e.g., classes, files) containing fix, and static code metrics of defected code. Cer-tainly, none of multi-target databases like Bugtraq, NVD provides this data since it requires access permission to the code base. These information is essentially required in any vulnerability prediction models, but may be unnecessary in other analysis.
4.
DATA USAGE BY OTHER RESEARCH
The work by Frei and others [10] can be easily described as the representative of the ethnographic and security and eco-nomics fields. It offers a detail landscape of which security vulnerabilities affect which systems and when, but do not provide a concrete answer to any of the research questions we have listed in Section 2.
The two first research topics (RP1, RP2) have a close re-lationship. Normally, researchers observe the world (finding facts) then introduce models describing observed phenom-ena and predicting the future trend.
Among of papers in these topic, Rescorla [32] focuses on the discoveries of vulnerability. Although Rescorla points out many shortcomings of of NVD, his study still heavily relies on NVD. By studying vulnerability reports of several applications in NVD, Rescorla introduces two mathemati-cal models, mathemati-called Linear model and Exponential model, to identify trends in vulnerability discovery.
Alhazmi et al. [2,3] observe vulnerabilities of Windows and Linux systems from different sources. For Windows systems, the data sources are mostly from NVD, other papers, and private source. For Linux systems, data come from CVE and Bugzilla for Linux. The authors try to model the cumula-tive vulnerabilities of these system into two models: logistic model and linear model. Based on the goodness of fit on each model, the authors give a forecast about the number
of undiscovered vulnerabilities, and emphasize the applica-bility of the new metric called vulneraapplica-bility density obtained by dividing the total of vulnerabilities by the size of the software systems. Also based on these vulnerability data, in [5] Alhazmi et al. compare their proposed models with Rescorla’s and Anderson’s [7]. The result shows that their logistic model has a better goodness of fit than others.
Ozment [30,31] points out many problems that NVD database suffered, which are chronological inconsistency, inclusion, separation of events and documentation. The chronologi-cal inconsistency refers to the inaccuracy in the versions af-fected by a vulnerability. The second problem is that NVD does not cover every vulnerability detected in a software sys-tem. In fact, only vulnerabilities that are discovered after 1999 and assigned CVE identifiers are included. The third problem refers to the duplication of vulnerability. The last problem is the lack of documentation. Many data fields of NVD are not well documented, particularly, the meaning of the data field and how the data is collected or calculated. Also, [30, 31] discuss technique to address the first problem, in which the actual bug’s birth date is obtained by analyzing the log of the source version control. As a demonstration, the authors set up a vulnerability database of OpenBSD. Based on this data, Ozment [27] conducts an experiment to test various the fitness of various vulnerability vulnerability discovery models. Moreover, in [29], the authors discuss the assumptions of existing vulnerability discover models (VDM), in which the data source of many VMDs do not meet their assumption.
Works focussing on the prediction capability (RP3) are the most frequent ones. We focus mainly on studies after 2006, and only a few in 2005. For other older studies, inter-ested reader can find more detail in the review of Cata and Diri [8].
Nagappan and Ball [24] present a prediction model using code churn for system defect density. The experiment data come from source version control log and the defected data of Windows 2003.
Neuhaus et al. [25] construct a tool called Vulture to pre-dict vulnerable components for Mozilla products with the accuracy of 50%. Vulture uses a vulnerability database for Mozilla products for training its predictor. This database is compiled upon three main different sources: MFSA, Mozilla Bugzilla and CVS archive. Vulture collects the import pat-terns and function-call patpat-terns in many known vulnera-ble modules and then applies a machine learning technique called Support Vector Machine to classify new modules.
Menzies et al. [23] claim that choosing attribute metrics is less significant than choosing how to use these metric values. In the experiment on MDP data sets, [23] ranks different metrics by using their InformationGain values to select the metrics for the predictor. The ranking value of a metric is different from projects. The accuracy of the predictor is evaluated by probability of prediction, pd, and probability of false alarm, pf. However, Zhang et al. [37] point out the assessment using precision, recall rate, which is poplular in Information Retrieval, is better than pd,pf. Zhang et al. [38] replicate work in [23], but using the combination of three function-level complexity metrics to do the prediction.
In other work, Olague et al. [26] make the comparison of prediction power of three different metric suites: CK, MOOD and QMOOD. Their experiment is conducted on six versions of Rhino, an open-source JavaScript
implemen-Research Databases Problem Papers Fac t Find ing M o d eling P redic tion Bug traq CE R T CV E OS V DB N V D ISS/ Xf or ce Op enBS D M S S ec. Bul letin M FSA Bug zilla P R O MI SE M DP N V DB Ot her so urce s Alhazmi et al. [1, 2] x T4, C1, C3 T2, C1 ? Ozment et al. [27] † x R3, T4, C3 # R3, T4, C3 T4, C1 R1, T4 T1, C2 ? Nagappan et al. [24] x ? Rescorla [32] † x x T4, C3 Manadhata et al. [21] # # # Menzies et al. [23] x C6 Neuhaus et al. [25] x R3 # Olague et al. [26] x T2, C1 Ozment et al. [28–31] x R3, T4, C3 R3, T4, C3 R3, T4, C3 R3, T4, C3 T4, C1 T1,T2,T4, C2,C4 Zhang et al. [38] x C6 Zimmerman et al. [40] x C6 Alhazmi et al. [5] x T4, C1, C3 T2, C1 ? Gegick et al. [15] x ? Jiang et al. [19] x C6 Shin et al. [33–35] x R3, C1 C5 Gegick et al. [12, 13] x ? Zimmerman et al. [39] x ? Chowhury et al. [9] x R3, C1 C5 Ours C3 T4, C4 R3, T2, C5
†: Papers that explicitly discuss about which features are used. #: Counting of total number of vulnerability reports. ?: unknown features.
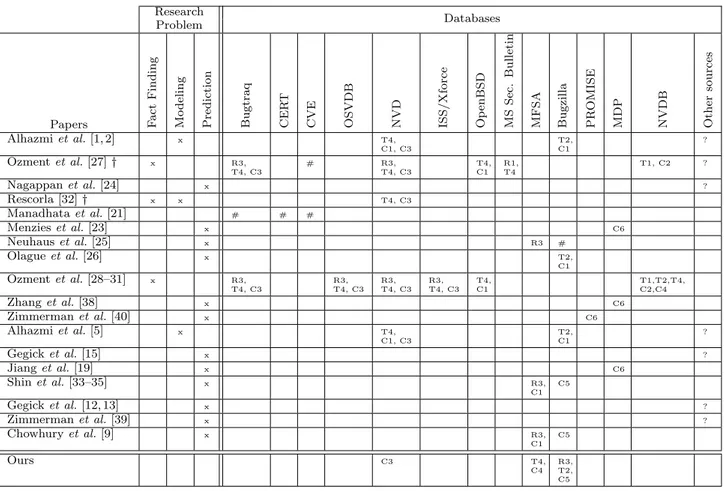
Table 2: Databases as used in recent works.
tation of Mozilla. The defect data are collected from Mozilla Bugzilla. The authors use logistic regression methods to per-form the prediction for each metric suite. In the result, CK suite is the superior prediction method for Rhino.
Zimmerman et al. [40] build a logistic regression model to predict post-release defects of Eclipse using several metrics in different levels of code base i.e., methods, classes, files and packages. The defect data are obtained by analyzing the log of the source version control. This method is detailed in [41], and used by [25]. The final dataset is put in the PROMISE repository. In an other work, Zimmerman and Nagappan [39] exploit program dependencies as metrics for their predictor. However, they did not state clearly where the defect data come from in their study.
Shin and Williams [33–35] raise a research question about the correlation between complexity and software security. In order to validate these hypotheses, the authors conduct an experiment on the JavaScript Engine (JSE) component of the Mozilla Firefox browser. They mine the code base of four JSE’s versions for complexity metric values. Mean-while, faults and vulnerabilities for these versions are col-lected from MFSA and Bugzilla. Their prediction model is based on nesting level metric and logistic regression meth-ods. Although the overall accuracy is quite high, their ex-periment still misses a large portion of vulnerabilities.
Jiang et al. [19], in their work, study the predictive power of machine learning based vulnerability discovery models.
Their experiments are based on the MDP data sets, using many metrics belonging to three categories: code level, de-sign level and combination of code and dede-sign level, as well as several machine learning methods. The experiment re-sults show that the metrics strongly impact the power of the models, while, there is not much difference among learning methods. Also, the most powerful metric is the combination of both code and design level metrics, and the design metrics are the most inferior ones.
Gegick et al. [11, 14, 15] employ automatic source anal-ysis tools (ASA) warnings, code churn and total line of code to implement their prediction model. However, the conducted experiments are based on private defected data sources. Their studies are not reproducible, and hence are less convincing.
Chowdhury and Zulkernine [9] combine complexity, cou-pling and cohesion metrics in building vulnerability predic-tion model, in which the authors analyze source code for measuring many complexity, coupling and cohesion metrics. These values are then fed to a trained classifier to deter-mine whether the source code is vulnerable. In their ex-periment, the authors conducted a vulnerability dataset for Mozilla Firefox, which is assembled from MFSA and Mozilla Bugzilla.
Table 2 summarizes papers discussed above. This table has two parts: the research problem of each paper, and the features of which database are used in each paper. The used
features are listed at the cross between database and paper. As one can see at the first right, most of the papers do not explicitly discuss the database features they use (except the ones denoted).
5.
INTEGRATING EMPIRICAL DATA
In this section we describe the method as well as the data sources that we use to conduct our experiment.
We first retrieve all advisories for Mozilla Firefox to ex-tract their features. Since these advisories are written man-ually, one HTML page for each advisory entry, they are not organized in any form of data structure. Therefore, informa-tion extracinforma-tion is done by a crawler applicainforma-tion that parses and extracts data from web pages. An MFSA entry itself does not provide much value information, but the announced date when the vulnerability goes to public and the references linking Bugzilla and CVE. Next, more detail information is extracted from the bug detail in the Bugzilla. The way to access this information is discussed in section 3. Here, the interesting features are bug identifier, CVE identifier (op-tional), status, resolution and reported date. The reported date is the discovery date in the bug life cycle.
To collect the information about affected versions, we re-lies on the NVD by the CVE identifier. Since this infor-mation may not be correct, we only use this inforinfor-mation as part of vulnerability-version mapping process. Many other information could also be found in NVD such as CVSS as-sessment, but it is not the focus of this study.
The relationship between bugs and and CVEs is obtained by two ways: automatic mapping and manual mapping. The automatic mapping is relied on the explicit CVE references in bug details, or implicit one described in the MFSA which contains only one bug and one CVE closed together. The manual mapping requires human effort to understand the links between bug and CVE, and map them together if rel-evant. These cases happen to the MFSA entries that have more than one bug and CVE.
In the following, we describe common layouts in which bugs and CVEs usually appear in an MFSA entry. To clarify, we use the term BUG to denote a link to bugzilla, and term CVE for link to CVE. If more than one similar terms appears in sequence, we use the star symbol (*) e.g., BUG*.
• BUG*: there is no reference to CVE, so we could not make the map. This layout only appears in Firefox 1.0 MFSAs1.
• BUG CVE: only one bug and one CVE. It is truly the case that this bug refers to this CVE, and the mapping is done automatically. This layout happens in most of MFSAs.
• (CVE BUG*)*: there is a CVE followed by many bugs, and then other CVE and bugs. In most cases, the CVE is applied to the following bugs, but it still needs some effort to check the details of CVE and relevant bugs. This layout is usually applied for MFSAs reported be-fore March 2008 (mostly for Firefox 1.52).
• (BUG* CVE)*: there are many bugs followed by a CVE, and the other bugs and CVE. Similar to the prior case, 1MFSA 2005-58/56/46
2
MFSA 2007-12/02/01, 2006-68/64
the CVE is usually referred by precedent bugs, but manual checking effort is still necessary. This layout is applied for MFSAs reported after March 2008 (mostly for Firfox 2.0 and higher3).
The vulnerable modules in code base can be located by mining the code archive repository, CVS - in case of Mozilla4. CVS is a source control which records all versions (a.k.a re-visions) of source files. Each source file revision (revision for short) is annotated with a committer name, date time when the revision is committed to the repository, tags and branches the revision belongs to, and a short description de-scribing the difference between this revision and its nearest ancestor. In case of bug fix, the description usually men-tions the bug identifier with some special keyword such as Fixes, Fixed, or Bug. Thank to this meaningful and serious description style, we are able to construct the bridge from a reported bug to the source modules. The approach map-ping source modules and bugs by parsing the commitment description is detailed in [36] and used in [25] to predict vulnerable software components.
The next cumbersome task is to identify the original revi-sions that introduce bugs. Obviously, to fix a bug, develop-ers have to modify one or more source files by deleting old code fragments, replacing old code fragments with new ones, or inserting new code fragments. Based on each type of code modifications, the following rules are applied to determine the original vulnerable revisions .
• Code deleted : the revision containing deleted lines are considered as the origins. These revision numbers can be achieved by analyzing the annotated version5of the revision containing fixes.
• Code replaced : as same as the previous case, the revi-sion containing replaced lines are origins.
• Code inserted : if the code is inside a method, then the original revision is the one containing the method. Otherwise we assume that the very first (1.1) revision of this file is the original revision.
The original date (a.k.a birthday) when the bug is intro-duced therefore can be determined by the committed date of the original revisions. Since a bug may have many different original revisions, we thus have to make a competition to identify the bug’s birthday. The four strategies, denoted in Figure 2, deciding the winner are as follows.
1. Optimistic strategy: The latest committed date is the bug’s birthday.
2. Pessimistic strategy : The earliest committed date is the bug’s birthday.
3. Optimistic Meantime strategy: The earliest committed date after the mean time of all committed dates is the birthday.
4. Pessimistic Meantime strategy: The latest committed date before the mean time is the birthday.
3
MFSA 2008-52/42/41/15
4Mozilla code base, cvs-mirror.mozilla.org 5
An annotated version of a revision is obtained by the CVS annotate command, in which each line of code is associated with the original revision and its author
(a) Optimistic strategy (b) Pessimistic strategy Mean time (c) Optimistic Meantime strategy Mean time (d) Pessimistic Meantime strategy
Figure 2: Four strategies for determining the birth date of a bug. The axis is the date when revisions are committed to the repository. Each circle represents to a revision that contains code introducing this bug, black circles are recognized as original revisions.
In our database, we follow all these four strategies and maintain separated fields for this birth date, since we ac-tually do not known which strategy is better than others. In addition, collecting all of them might help increasing the data accuracy.
By finding the bug’s birth date, we also found the original revisions that contain vulnerable code. Further tracking on software release tags, we are able to determine vulnerable versions of the software. Since a bug might be fixed in many modules. It probably leads to different ranges of vulnerable versions. If it is truly the case, the similar birthday-detection strategies can be employed to deal with the conflict. We then obtain a list of affected software versions, a.k.a list of vul-nerable versions, or CVS-reported vulvul-nerable list. Basically, the final vulnerable list comes from the CVS-reported one.
This CVS-reported list is then compared with one re-ported in NVD, the NVD-rere-ported list. If there is any vulnerable version reported in NVD, but not in the CVS-reported list but it exists in the potential CVS-CVS-reported list, then we include this version into the final vulnerability list. Notice that the potential CVS-reported list is exactly the CVS-reported list in which the pessimistic strategy is ap-plied.
To sum up, Figure 3 illustrates the general schema of our vulnerability database for the specific case of Mozilla Firefox. Our database is compiled based on four different sources: MFSA, Bugzilla, NVD and CVS archive logs. In the schema, the SecurityAdvisory table holds list of Firefox-related advisories. Each advisory entry maintains many links to Bugzilla and NVD, captured in the table Bug and CVE, respectively. Also, the VulnerableVersion table holds the NVD-reported vulnerable list for each CVE entry. By mining the CVS archive logs, we obtain a list of source files saved in table File (only *.h, *.cpp and *.c are considered). Each source file contains several revisions (the Revision ta-ble), which in turn point to the release tags, and branches they belong to. Each revision maintains links to its orig-inated and fixed bugs. Finally, the AffectedVersion table maintains the final vulnerable list.
6.
DATA ANALYSIS
First we look at papers predicting vulnerability compo-nents. As we mentioned, a large part of the literature stud-ied the relation of vulnerabilities and software versions, and that of vulnerabilities and vulnerable source modules.
How-Revision
(File, Branch, Tag, Change Date)
Bug
(ID, Dates, Description, Reporter)
Sec. Advisory
(ID, Vul., Fixed Date)
CVE
(ID, Impact, Date)
* * * * * * CVS * 4originates * Affected Version
(Version number, Strategy)
4fixes * * Vulnerable Version (Version number) * * BUGZILLA MFSA NVD NVD NVD, CVS
Figure 3: Simplified schema of our vulnerability
database. Rectangles denote tables; icons at the top left corner of tables denote the source database.
ever, few studies discuss the quality of the vulnerability databases upon which their findings are based.
The Table 2 shows that the data sources used in predic-tion mostly come from three different groups. Databases in the first group come from vendor bug-tracking database [9, 25, 26, 33–35], some analyze the source version control to detect source files that contain bug fixes, [25, 26]. The vul-nerability databases constructed in this way could be repro-duced by others, and thus they are able to be cross-validated. Meanwhile, the databases of the second group come from public repositories (NASA MDP, PROMISE) [23, 26, 38]. These databases are contributed by community. Some of them are reproducible, and some are not. Obviously, the quality of these databases is unknown. In the last group, the databases are obtained from private sources i.e, closed source like Microsoft [24], Cisco or private company [12,13,15]. We do not make any discussion on these sources since we do not have permission to access them.
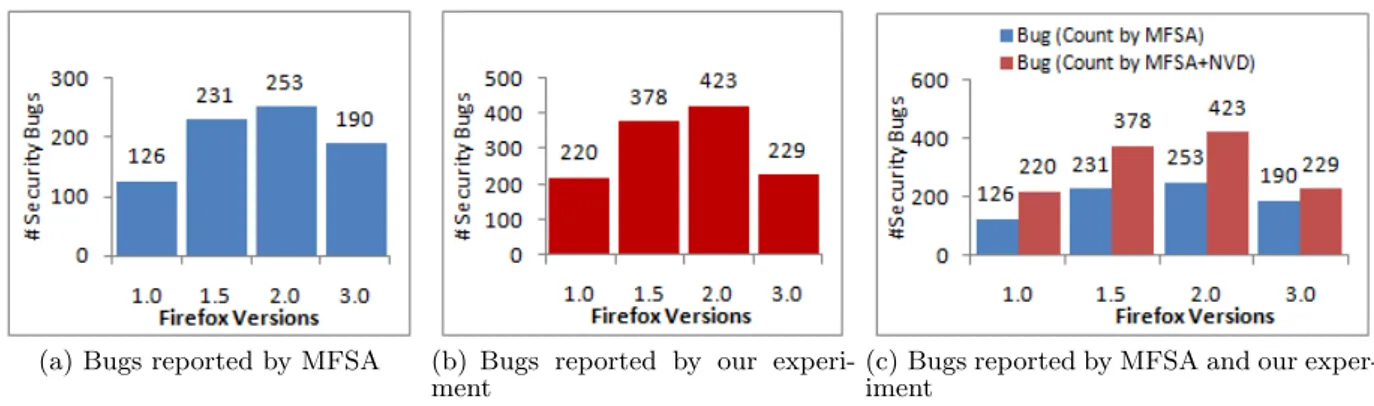
Let us examine studies that rely on Mozilla Firefox [9, 25, 34]. Figure 4(a) presents vulnerabilities reported by MFSA and Bugzilla for Firefox 1.0 to 3.0. The figure shows a big jump of the number of vulnerabilities from version 1.0 to ver-sion 1.5 (+83%). From verver-sion 1.5 to verver-sion 2.0, the number of vulnerabilities slightly increases (+9.5%) and decrease a bit (-25%) in version 3.0. On the other side, Figure 4(b) displays the vulnerabilities reported by our database. It is easy to see that the trend from version 1.0 to version 2.0 is more or less as same as one illustrated in Figure 4(a), but it shows a significant change from version 2.0 to 3.0: about a half of vulnerabilities is cut. Although more vulner-abilities of version 3.0 are probably reported in future, Fig-ure 4(b) shows the big effort from Mozilla group to improve their product in term of security so far. Figure 4(c) shows the differences of the number of vulnerabilities reported by {MFSA, Bugzilla} and our experiment for each version. The differences are approximate 68% for version 1.0 to 2.0, and 20% for version 3.0. This difference comes from the fact that MFSA and Bugzilla do not publish any information about infected versions. People can only see the fixed versions and make assumption about vulnerable versions e.g., bug fixed in version 2.0.0.8 is counted for version 2.0.0.x where x < 8. In fact, bug discovered in version 2.0.0.8 may also affect to version 1.0.x and 1.5.0.y where x <= 8, y < 12. Therefore, this bug should be counted for these version.
To better understand the cause, let us see the life cycle of Firefox 2 and the number of vulnerabilities reported for this version in Figure 5. There are have two milestones in Firefox
(a) Bugs reported by MFSA (b) Bugs reported by our experi-ment
(c) Bugs reported by MFSA and our exper-iment
Figure 4: The number of security bugs of different Firefox versions reported by MFSA, Buzilla and our experiment. 0 100 200 300 400 500
Mar/'04 Jul/'05 Nov/'06 Apr/'08 Aug/'09
N u m b e r o f Se cu ri ty B u gs Discovery time Release time Retired time Developing phase Support phase Retired phase
Figure 5: Life cycle of the Mozilla Firefox 2.0 and cumulative reported security bugs.
2 lifetime: release time, and retirement time. The former is the time the software is officially released, and the later is the time it goes beyond unsupported from the software vendor. These milestones divide the Firefox’s lifetime into three phases:
• Developing phase: vulnerabilities detected in this phase should be as much as possible. Vulnerability fixing and patching are also much easier and cost less than other phases.
• Support phase: vulnerabilities reported in this phase will be revised and fixed as soon as possible. These fixes go to end users through minor version update i.e., version 2.0.0.x where x between 1 and 20. • Retired phase: developers are no longer interested in
fixing bug for this version as well as checking whether this version is affected by any future reported vulner-abilities.
Bugzilla keeps track of all vulnerabilities event if they are not fixed, but only authorized people are able to access to them. When a vulnerability is fixed and patch is released, an entry about this vulnerability is appeared in MFSA. There-fore only vulnerabilities discovered during support phase and fixed in a patch are recorded in MFSA, other ones will not be published and are considered to be vulnerabilities of future versions (if any). This is the reason of only 253 security bugs are reported in version, meanwhile the number is actual 423 (more than 67%) and may increase.
Obviously, any prediction model which relies only on MFSA and Bugzilla will miss 68% of total vulnerabilities used to train the model. This is referred to as the Vulnerability missing phenomenon. This phenomenon describes the fact that collecting training set too early probably makes our prediction less accurate because we are going to miss some data. Meanwhile, a late data collection make no sense since the software has gone beyond support. This raise another research question that “How long should we wait for our training set to be stabilized?”.
7.
VALIDITY
In this section we discuss about both internal and external threats that can affect the validity of our study.
Bug in data collection. We collect data from various sources. Some of them, MFSA and CVS, requires parsing. The code that downloaded and parsed MFSA pages and the code that read the CVS log, parsed for history data, could contain bugs and thus might produce er-rors. However, these risks were mitigated by manually checking for a small amount of data and then correct the code. After collecting all data, a random check was carried out to validate the data. If the random check found an error, the code was then fixed. And then the collection and random check were repeated until there was no error.
Missing information in CVS. The mapping between bugs and code base relies upon conventional patterns in CVS committed messages. These patterns might be missed in some messages due to developers’ mistakes. However, we believe this phenomenon, if exists, rarely happens and can be ignored since we were able to lo-cate the corresponding code base for every fixed bug. Generality. The combination of multi-vendor databases (e.g.,
NVD) and software vendor’s databases (e.g., MFSA, Bugzilla) only works for products that the vendor main-tains a vulnerability database and is willing to publish it. Also, the source control log mining approach only works if the software vendor grant community access to the source control, and developers commit changes that fix vulnerability in a consistent, meaningful fash-ion i.e., independent vulnerabilities are fixed in differ-ent commits and each of these commits is associated
with a message that refers to a vulnerability identifier. These constraints eventually limit the application of the proposed approach.
Mapping between CVE and Bugzilla. The Bugzilla and MFSA themselves do not contain enough information about affected versions (both ”retrospective” and ”prospec-tive”). We found this data in NVD, but not all bugs refer explicitly to CVEs. The missing data is filled by manually looking at the MFSA. This task , as dis-cussed in section 5, are laborious, time consuming and may contain mistakes.
8.
CONCLUSION
In this work, we analyzed different research problems in the emerging trend towards to the quantitative security as-sessment and the use of empirical methods to analyze or predict vulnerable components. We identified the databases used in recent researches, and identified which database fea-tures are often used to answer some research questions. We setup an experiment in which we collect vulnerability data for Mozilla Firefox. This database was a stepping stone to analyze prior work. Based on it, we discussed issues that past papers may suffer, which might bias their result.
9.
REFERENCES
[1] O. Alhazmi, Y. Malaiya, and I. Ray. Security vulnerabilities in software systems: A quantitative perspective. Data and App. Sec. XIX, 3654:281–294, 2005. pages 3, 6
[2] O. Alhazmi, Y. Malaiya, and I. Ray. Measuring, analyzing and predicting security vulnerabilities in software systems. Comp. & Sec., 26(3):219–228, 2007. pages 3, 5, 6
[3] O. H. Alhazmi and Y. K. Malaiya. Modeling the vulnerability discovery process. In Proc. of the 16th IEEE Int. Symp. on Software Reliability Eng. (ISSRE’05), pages 129–138, 2005. pages 3, 5 [4] O. H. Alhazmi and Y. K. Malaiya. Quantitative
vulnerability assessment of systems software. In Proc. of RAMS’05, pages 615–620, 2005. pages 3
[5] O. H. Alhazmi and Y. K. Malaiya. Application of vulnerability discovery models to major operating systems. IEEE Trans. on Reliab., 57(1):14–22, 2008. pages 3, 5, 6
[6] R. Anderson. Why information security is hard - an economic perspective. In Proc. of ACSAC’01, 2001. pages 3
[7] R. Anderson. Security in open versus closed systems -the dance of Boltzmann, Coase and Moore. In Proc. of Open Source Soft.: Economics, Law and Policy, 2002. pages 3, 5
[8] C. Catal and B. Diri. A systematic review of software fault prediction studies. Expert Sys. with App., 36(4):7346–7354, 2009. pages 5
[9] I. Chowdhury and M. Zulkernine. Using complexity, coupling, and cohesion metrics as early predictors of vul. J. of Soft. Arch., 2010. pages 3, 6, 8
[10] S. Frei, T. Duebendorfer, and B. Plattner. Firefox (in) security update dynamics exposed. ACM SIGCOMM Comp. Comm. Rev., 39(1):16–22, 2009. pages 5
[11] M. Gegick. Failure-prone components are also attack-prone components. In Proc. of the 23rd ACM SIGPLAN Conf. on Object-Oriented Prog. , Sys. , Lang. , and Applications (OOPSLA’08), pages 917–918. ACM Press, 2008. pages 6
[12] M. Gegick, P. Rotella, and L. Williams. Toward non-security failures as a predictor of security faults and failures. Eng. Secure Soft. and Sys., 5429:135–149, 2009. pages 6, 8
[13] M. Gegick, P. Rotella, and L. A. Williams. Predicting attack-prone components. In icst-09, pages 181–190, 2009. pages 3, 6, 8
[14] M. Gegick and L. Williams. Ranking attack-prone components with a predictive model. In Proc. of the 19th IEEE Int. Symp. on Software Reliability Eng. (ISSRE’08), pages 315–316, 2008. pages 6
[15] M. Gegick, L. Williams, J. Osborne, and M. Vouk. Prioritizing software security fortification
throughcode-level metrics. In Proc. of QoP’08, pages 31–38. ACM, 2008. pages 3, 6, 8
[16] L. A. Gordon and M. P. Loeb. Managing
Cybersecurity Resources: a Cost-Benefit Analysis. McGraw Hill, 2006. pages 2
[17] IEEE. IEEE standard glossary of software engineering terminology, September 1990. pages 11
[18] A. Jaquith. Security Metrics: Replacing Fear,
Uncertainty, and Doubt. Addison-Wesley Professional, 2007. pages 2
[19] Y. Jiang, B. Cuki, T. Menzies, and N. Bartlow. Comparing design and code metrics for software quality prediction. In Proc. of the 4th PROMISE’08, pages 11–18. ACM, 2008. pages 3, 6
[20] I. V. Krsul. Software Vulnerability Analysis. PhD thesis, Purdue University, 1998. pages 11
[21] P. Manadhata, J. Wing, M. Flynn, and M. McQueen. Measuring the attack surfaces of two ftp daemons. 2006. pages 6
[22] A. Meneely and L. Williams. Secure open source collaboration: An empirical study of linus’ law. In Proc. of CCS’09, 2009. pages 2
[23] T. Menzies, J. Greenwald, and A. Frank. Data mining static code attributes to learn defect predictors. TSE, 33(9):2–13, 2007. pages 3, 5, 6, 8
[24] N. Nagappan and T. Ball. Use of relative code churn measures to predict system defect density. pages 284–292, 2005. pages 5, 6, 8
[25] S. Neuhaus, T. Zimmermann, C. Holler, and A. Zeller. Predicting vulnerable software components. In Proc. of CCS’07, pages 529–540, October 2007. pages 3, 5, 6, 7, 8
[26] H. M. Olague, S. Gholston, and S. Quattlebaum. Empirical validation of three software metrics suites to predict fault-proneness of object-oriented classes developed using highly iterative or agile software development processes. TSE, 33(6):402 ˝U419., 2007. pages 5, 6, 8
[27] A. Ozment. The likelihood of vulnerability rediscovery and the social utility of vulnerability hunting. In Proc. of 4th Annual Workshop on Economics and Inform. Sec. (WEIS’05), 2005. pages 3, 5, 6
Examining vulnerabilities with reliability growth models. In Proc. of QoP’06, 2006. pages 6
[29] A. Ozment. Improving vulnerability discovery models: Problems with definitions and assumptions. In Proc. of QoP’07, 2007. pages 3, 5, 6, 11
[30] A. Ozment. Vulnerability Discovery and Software Security. PhD thesis, University of Cambridge. Cambridge, UK, 2007. pages 4, 5, 6
[31] A. Ozment and S. E. Schechter. Milk or wine: Does software security improve with age? In Proc. of the 15th Usenix Sec. Symp. (USENIX’06), 2006. pages 3, 5, 6
[32] E. Rescorla. Is finding security holes a good idea? IEEE Sec. and Privacy, 3(1):14–19, 2005. pages 3, 5, 6 [33] Y. Shin. Exploring complexity metrics as indicators of
software vulnerability. In Proc. of the Int. Doctoral Symp. on Empirical Soft. Eng. (IDoESE’08). pages 3, 6
[34] Y. Shin and L. Williams. An empirical model to predict security vulnerabilities using code complexity metrics. In Proc. of ESEM’08, 2008. pages 3, 6, 8 [35] Y. Shin and L. Williams. Is complexity really the
enemy of software security? In Proc. of QoP’08, pages 47–50, 2008. pages 3, 6, 8
[36] J. Sliwerski, T. Zimmermann, and A. Zeller. When do changes induce fixes? In Proc. of the 2nd Int. Working Conf. on Mining Soft. Repo. MSR(’05), pages 24–28, May 2005. pages 7
[37] H. Zhang and X. Zhang. Comments on data mining static code attributes to learn defect predictors. TSE, 33(9):635– ˝U637, 2007. pages 5
[38] H. Zhang, X. Zhang, and M. Gu. Predicting defective software components from code complexity measures. In Procc. of PRDC’07, pages 93–96, 2007. pages 5, 6, 8 [39] T. Zimmermann and N. Nagappan. Predicting defects
with program dependencies. In Proc. of ESEM’09, 2009. pages 3, 6
[40] T. Zimmermann, R. Premraj, and A. Zeller. Predicting defects for eclipse. In Proc. of the 3th PROMISE’07, page 9. IEEE Computer Society, 2007. pages 3, 6
[41] T. Zimmermann and P. WeiSSgerber. Preprocessing cvs data for fine-grained analysis. In Proc. of the 1st Int. Working Conf. on Mining Soft. Repo. MSR(’04), pages 2–6, May 2004. pages 6
APPENDIX
A.
TERMINOLOGY
In this work, we use standard software engineering terms as [29] used. In which, the basic terms are failure, fault, mistake, error and vulnerability.
A failure is the ”inability of a system or component to perform its required functions within specified performance requirements” [17].
A fault is an ”incorrect step, process, or data definition in a computer program” [17]. Failures are consequence of faults, but not all fault always produce failures. Faults are also know as ’bugs’ or ’flaws’ [29].
A mistake is ”a human action that produces an incorrect result” [17].
An error is ”the difference between a computed, observed,
or measured value or condition and the true, specified, or theoretically correct value or condition. For example, a dif-ference of 30 meters between a computed result and the correct result” [17].
A vulnerability is “an instance of [a mistake] in the specifi-cation, development, or configuration of software such that its execution can violate the [explicit or implicit] security policy” [20].