DISI ‐ Via Sommarive 14 ‐ 38123 Povo ‐ Trento (Italy)
http://www.disi.unitn.it
RESULTS OF THE
ONTOLOGY ALIGNMENT
EVALUATION INITIATIVE 2009
Jérôme Euzenat, Alfio Ferrara, Laura
Hollink, Antoine Isaac, Cliff Joslyn,
Véronique Malaisé, Christian Meilicke,
Andriy Nikolov, Juan Pane, Marta
Sabou, François Scharffe, Pavel Shvaiko,
Vassilis Spiliopoulos, Heiner
Stuckenschmidt, Ondˇrej Šváb-Zamazal,
Vojtˇech Svátek, Cássia Trojahn, George
Vouros, and Shenghui Wang
January 2010
Results of the
Ontology Alignment Evaluation Initiative 2009
?Jérôme Euzenat1, Alfio Ferrara7, Laura Hollink2, Antoine Isaac2, Cliff Joslyn10, Véronique Malaisé2, Christian Meilicke3, Andriy Nikolov8, Juan Pane4, Marta
Sabou8, François Scharffe1, Pavel Shvaiko5, Vassilis Spiliopoulos9, Heiner Stuckenschmidt3, Ondˇrej Šváb-Zamazal6, Vojtˇech Svátek6, Cássia Trojahn1, George
Vouros9, and Shenghui Wang2
1 INRIA & LIG, Montbonnot, France
{Jerome.Euzenat,Francois.Scharffe,Cassia.Trojahn}@inrialpes.fr
2 Vrije Universiteit Amsterdam, The Netherlands
{laurah,vmalaise,aisaac,swang}@few.vu.nl
3
University of Mannheim, Mannheim, Germany {christian,heiner}@informatik.uni-mannheim.de
4
University of Trento, Povo, Trento, Italy [email protected]
5
TasLab, Informatica Trentina, Trento, Italy [email protected]
6
University of Economics, Prague, Czech Republic {svabo,svatek}@vse.cz
7
Universita degli studi di Milano, Italy [email protected]
8
The Open university, UK {r.sabou,a.nikolov}@open.ac.uk
9 University of the Aegean, Greece
{vspiliop,georgev}@aegean.gr
10 Pacific Northwest National Laboratory, USA
Abstract. Ontology matching consists of finding correspondences between on-tology entities. OAEI campaigns aim at comparing onon-tology matching systems on precisely defined test cases. Test cases can use ontologies of different nature (from expressive OWL ontologies to simple directories) and use different modal-ities, e.g., blind evaluation, open evaluation, consensus. OAEI-2009 builds over previous campaigns by having 5 tracks with 11 test cases followed by 16 partici-pants. This paper is an overall presentation of the OAEI 2009 campaign.
1
Introduction
The Ontology Alignment Evaluation Initiative1 (OAEI) is a coordinated international initiative that organizes the evaluation of the increasing number of ontology matching
?
This paper improves on the “Preliminary results” initially published in the on-site proceedings of the ISWC workshop on Ontology Matching (OM-2009). The only official results of the campaign, however, are on the OAEI web site.
systems [10]. The main goal of OAEI is to compare systems and algorithms on the same basis and to allow anyone for drawing conclusions about the best matching strategies. Our ambition is that from such evaluations, tool developers can learn and improve their systems. The OAEI campaign provides the evaluation of matching systems on consen-sus test cases.
Two first events were organized in 2004: (i) the Information Interpretation and In-tegration Conference (I3CON) held at the NIST Performance Metrics for Intelligent Systems (PerMIS) workshop and (ii) the Ontology Alignment Contest held at the Eval-uation of Ontology-based Tools (EON) workshop of the annual International Semantic Web Conference (ISWC) [23]. Then, unique OAEI campaigns occurred in 2005 at the workshop on Integrating Ontologies held in conjunction with the International Con-ference on Knowledge Capture (K-Cap) [2], in 2006 at the first Ontology Matching workshop collocated with ISWC [9], in 2007 at the second Ontology Matching work-shop collocated with ISWC+ASWC [11], and in 2008, OAEI results were presented at the third Ontology Matching workshop collocated with ISWC [4]. Finally, in 2009, OAEI results were presented at the fourth Ontology Matching workshop collocated with ISWC, in Chantilly, Virginia USA2.
We have continued previous years’ trend by having a large variety of test cases that emphasize different aspects of ontology matching. This year we introduced two new tracks that have been identified in the previous years:
oriented alignments in which the reference alignments are not restricted to equiva-lence but also comprise subsumption relations;
instance matching dedicated to the delivery of alignment between instances as neces-sary for producing linked data.
This paper serves as an introduction to the evaluation campaign of 2009 and to the results provided in the following papers. The remainder of the paper is organized as follows. In Section 2 we present the overall testing methodology that has been used. Sections 3-10 discuss in turn the settings and the results of each of the test cases. Sec-tion 11 evaluates, across all tracks, the participant results with respect to their capacity to preserve the structure of ontologies. Section 12 overviews lessons learned from the campaign. Finally, Section 13 outlines future plans and Section 14 concludes the paper.
2
General methodology
We first present the test cases proposed this year to OAEI participants. Then, we de-scribe the three steps of the OAEI campaign and report on the general execution of the campaign. In particular, we list participants and the tests they considered.
2.1 Tracks and test cases
This year’s campaign has consisted of 5 tracks gathering 11 data sets and different evaluation modalities.
The benchmark track (§3): Like in previous campaigns, a systematic benchmark se-ries has been produced. The goal of this benchmark sese-ries is to identify the areas in which each matching algorithm is strong and weak. The test is based on one partic-ular ontology dedicated to the very narrow domain of bibliography and a number of alternative ontologies of the same domain for which alignments are provided. The expressive ontologies track offers ontologies using OWL modeling capabilities:
Anatomy (§4): The anatomy real world case is about matching the Adult Mouse Anatomy (2744 classes) and the NCI Thesaurus (3304 classes) describing the human anatomy.
Conference (§5): Participants are asked to find all correct correspondences (equiv-alence and/or subsumption) and/or ‘interesting correspondences’ within a col-lection of ontologies describing the domain of organizing conferences (the do-main being well understandable for every researcher). Results are evaluated a posteriori in part manually and in part by data-mining techniques and logi-cal reasoning techniques. They are also evaluated against reference alignments based on a subset of the whole collection.
The directories and thesauri track proposes web directories, thesauri and generally less expressive resources:
Fishery gears: This test case features four different classification schemes, ex-pressed in OWL, adopted by different fishery information systems in FIM di-vision of FAO. An alignment performed on this 4 schemes should be able to spot out equivalence, or a degree of similarity between the fishing gear types and the groups of gears, so as to enable a future exercise of data aggregation across systems.
Directory (§6): The directory real world case consists of matching web sites direc-tories (like open directory or Yahoo’s). It is more than 4 thousand elementary tests.
Library (§7): Three large SKOS subject heading lists for libraries have to be matched using relations from the SKOS vocabulary. Results are evaluated on the basis of (i) a partial reference alignment (ii) using the alignments to re-index books from one vocabulary to the other.
Oriented alignments (benchmark-subs §8) :
This track focuses on the evaluation of alignments that contain other relations than equivalences.
Instance matching (§9): The instance data matching track aims at evaluating tools able to identify similar instances among different datasets. It features Web datasets, as well as a generated benchmark:
Eprints-Rexa-Sweto/DBLP benchmark (ARS) three datasets containing in-stances from the domain of scientific publications;
TAP-Sweto-Tesped-DBpedia three datasets covering several topics and struc-tured according to different ontologies;
IIMB A benchmark generated using one dataset and modifying it according to various criteria.
Very large crosslingual resources (§10): The purpose of this task (vlcr) is to match the Thesaurus of the Netherlands Institute for Sound and Vision (called GTAA) to two other resources: the English WordNet from Princeton University and DBpedia.
Table 1 summarizes the variation in the results expected from these tests.
For the first time this year we had to cancel two tracks, namely Fishery and TAP-Sweto-Tesped-DBpedia due to the lack of participants. This is a pity for those who have prepared these tracks, and we will investigate what led to this situation in order to improve next year.
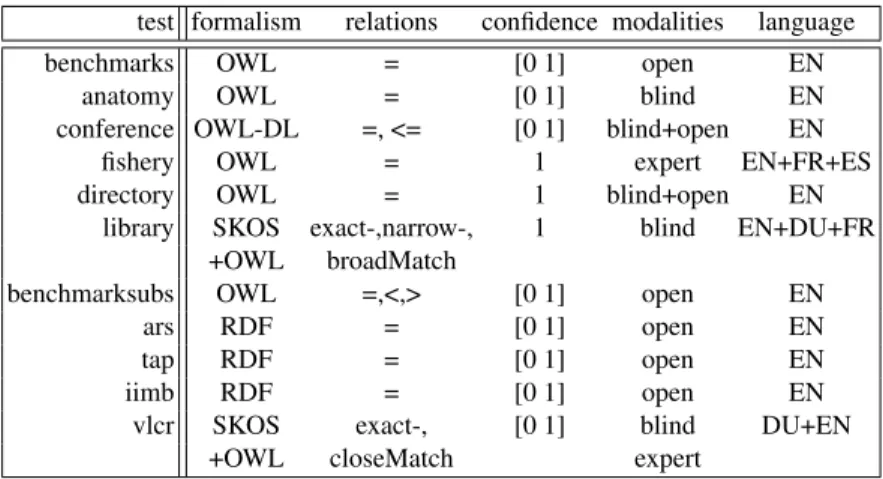
test formalism relations confidence modalities language
benchmarks OWL = [0 1] open EN
anatomy OWL = [0 1] blind EN
conference OWL-DL =, <= [0 1] blind+open EN
fishery OWL = 1 expert EN+FR+ES
directory OWL = 1 blind+open EN
library SKOS exact-,narrow-, 1 blind EN+DU+FR
+OWL broadMatch
benchmarksubs OWL =,<,> [0 1] open EN
ars RDF = [0 1] open EN
tap RDF = [0 1] open EN
iimb RDF = [0 1] open EN
vlcr SKOS exact-, [0 1] blind DU+EN
+OWL closeMatch expert
Table 1. Characteristics of test cases (open evaluation is made with already published reference alignments, blind evaluation is made by organizers from reference alignments unknown to the participants, consensual evaluation is obtained by reaching consensus over the found results).
2.2 Preparatory phase
Ontologies to be matched and (where applicable) reference alignments have been pro-vided in advance during the period between June 1stand June 22nd, 2009. This gave potential participants the occasion to send observations, bug corrections, remarks and other test cases to the organizers. The goal of this preparatory period is to ensure that the delivered tests make sense to the participants. The final test base was released on July 6th. The data sets did not evolve after this period.
2.3 Execution phase
During the execution phase, participants used their systems to automatically match the ontologies from the test cases. Participants have been asked to use one algorithm and the same set of parameters for all tests in all tracks. It is fair to select the set of parameters that provide the best results (for the tests where results are known). Beside parameters, the input of the algorithms must be the two ontologies to be matched and any general purpose resource available to everyone, i.e., no resource especially designed for the test. In particular, participants should not use the data (ontologies and reference alignments) from other test cases to help their algorithms. In most cases, ontologies are described in OWL-DL and serialized in the RDF/XML format. The expected alignments are pro-vided in the Alignment format expressed in RDF/XML [8]. Participants also propro-vided the papers that are published hereafter and a link to their systems and their configuration parameters.
2.4 Evaluation phase
The organizers have evaluated the alignments provided by the participants and returned comparisons on these results.
In order to ensure that it is possible to process automatically the provided results, the participants have been requested to provide (preliminary) results by September 1st. In the case of blind tests only the organizers did the evaluation with regard to the withheld reference alignments.
The standard evaluation measures are precision and recall computed against the reference alignments. For the matter of aggregation of the measures we use weighted harmonic means (weights being the size of the true positives). This clearly helps in the case of empty alignments. Another technique that has been used is the computation of precision/recall graphs so it was advised that participants provide their results with a weight to each correspondence they found. New measures addressing some limitations of precision and recall have also been used for testing purposes as well as measures compensating for the lack of complete reference alignments.
2.5 Comments on the execution
After a decreased number of participants last year, this year the number increased again: 4 participants in 2004, 7 in 2005, 10 in 2006, 17 in 2007, 13 in 2008, and 16 in 2009.
The number of covered runs has slightly increased: 53 in 2009, 50 in 2008, and 48 in 2007. This may be due to the increasing specialization of tests: some systems are specifically designed for instance matching or for anatomy.
We have had not enough time to systematically validate the results which had been provided by the participants, but we run a few systems and we scrutinized some of the results.
The list of participants is summarized in Table 2. Similar to previous years not all participants provided results for all tests. They usually did those which are easier to run, such as benchmark, anatomy, directory, and conference. The variety of tests and the short time given to provide results have certainly prevented participants from considering more tests.
The sets of participants is divided in two main categories: those who participated in the instance matching track and those who participated in ontology matching tracks. Only a few systems (DSSim and RiMOM) participated in both types of tracks.
The summary of the results track by track is provided in the following sections.
3
Benchmark
The goal of the benchmark tests is to provide a stable and detailed picture of each algorithm. For that purpose, the algorithms are run on systematically generated test cases.
System aflood AgrMak er AMExt AR OMA ASMO V
DSSim FBEM GeRoMe GG2WW HMatch kosimap Lily MapPSO RiMOM SOBOM TaxoMap Total=16
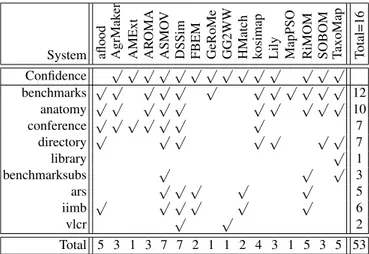
Confidence √ √ √ √ √ √ √ √ √ √ √ √ √ √ benchmarks √ √ √ √ √ √ √ √ √ √ √ √ 12 anatomy √ √ √ √ √ √ √ √ √ √ 10 conference √ √ √ √ √ √ √ 7 directory √ √ √ √ √ √ √ 7 library √ 1 benchmarksubs √ √ √ 3 ars √ √ √ √ √ 5 iimb √ √ √ √ √ √ 6 vlcr √ √ 2 Total 5 3 1 3 7 7 2 1 1 2 4 3 1 5 3 5 53
Table 2. Participants and the state of their submissions. Confidence stands for the type of result returned by a system: it is ticked when the confidence has been measured as non boolean value.
3.1 Test data
The domain of this first test is Bibliographic references. It is based on a subjective view of what must be a bibliographic ontology. There may be many different classifications of publications, for example, based on area and quality. The one chosen here is common among scholars and is based on publication categories; as many ontologies (tests #301-304), it is reminiscent to BibTeX.
The systematic benchmark test set is built around one reference ontology and many variations of it. The ontologies are described in OWL-DL and serialized in the RDF/XML format. The reference ontology is that of test #101. It contains 33 named classes, 24 object properties, 40 data properties, 56 named individuals and 20 anony-mous individuals. Participants have to match this reference ontology with the variations. Variations are focused on the characterization of the behavior of the tools rather than having them compete on real-life problems. They are organized in three groups: Simple tests (1xx) such as comparing the reference ontology with itself, with another
irrelevant ontology (the wine ontology used in the OWL primer) or the same ontol-ogy in its restriction to OWL-Lite;
Systematic tests (2xx) obtained by discarding features from some reference ontology. It aims at evaluating how an algorithm behaves when a particular type of informa-tion is lacking. The considered features were:
– Name of entities that can be replaced by random strings, synonyms, name with different conventions, strings in another language than English;
– Comments that can be suppressed or translated in another language; – Specialization hierarchy that can be suppressed, expanded or flattened; – Instances that can be suppressed;
– Properties that can be suppressed or having the restrictions on classes dis-carded;
– Classes that can be expanded, i.e., replaced by several classes or flattened. Four real-life ontologies of bibliographic references (3xx) found on the web and left
mostly untouched (there were added xmlns and xml:base attributes).
Since the goal of these tests is to offer some kind of permanent benchmarks to be used by many, the test is an extension of the 2004 EON Ontology Alignment Contest, whose test numbering it (almost) fully preserves.
The tests are roughly the same as last year. We only suppressed some correspon-dences that rendered the merged ontologies inconsistent (in 301 and 304) since an in-creasing number of systems were able to test the consistency of the resulting alignments. The kind of expected alignments is still limited: they only match named classes and properties, they mostly use the "=" relation with confidence of 1. Full description of these tests can be found on the OAEI web site.
3.2 Results
Twelve systems participated in the benchmark track of this year’s campaign (see Ta-ble 2). Three systems that had participated last year (CIDER, SAMBO, and SPIDER) did not participate this year.
Table 3 shows the results, by groups of tests. The results of last year are also pro-vided. We display the results of participants as well as those given by some simple edit distance algorithm on labels (edna). The computed values are real precision and recall and not an average of precision and recall. The full results are on the OAEI web site.
As shown in Table 3, two systems are ahead: Lily and ASMOV, with aflood and RiMOM as close followers (with GeRoME, AROMA, DSSim, and AgreementMaker – which is referred as AgrMaker in the tables and figures – having intermediary perfor-mance). Last year, ASMOV, Lily and RiMOM had the best performance, followed by AROMA, DSSim, and aflood. No system had strictly lower performance than edna.
Looking for each group of tests, in simple tests (1xx) all systems have similar per-formance, excluding SOBOM and TaxoMap. Each algorithm has its best score with the 1xx test series. For systematic tests (2xx), which allows to distinguish the strengths of algorithms, Lily and ASMOV are again ahead of the other systems. Finally, for real cases (3xx), AgreementMaker and aflood provide the best results, with Lily, RiMOM, ASMOV, AROMA, and DSSim as followers. There is no a unique best system for all group cases.
Looking for improvements in the systems participating both this year and in the last campaign, GeRoMe and MapPSO have significantly improved their results both in terms of precision and recall, while aflood provides better recall and AROMA improves its results in real cases.
The results have also been compared with the symmetric measure proposed in [7]. It is a generalisation of precision and recall in order to better discriminate systems that slightly miss the target from those which are grossly wrong. This measure slightly improves traditional precision and recall, which are displayed in Table 3 (“Symmetric relaxed measures”). This year, MapPSO has significantly better symmetric precision and recall than classical precision and recall, to the point that it is at the level of the best
system ref align edna aflood AgrMak er AR OMA ASMO V DSSim GeRoMe k osimap Lily MapPSO RiMOM SOBOM T axoMap test Prec. Rec. Prec. Rec. Prec. Rec. Prec. Rec. Prec. Rec. Prec. Rec. Prec. Rec. Prec. Rec. Prec. Rec. Prec. Rec. Prec. Rec. Prec. Rec. Prec. Rec. Prec. Rec. 2009 1xx 1.00 1.00 0.96 1.00 1.00 1.00 0.98 0.98 1.00 1.00 1.00 1.00 1.00 1.00 1.00 1.00 0.99 0.99 1.00 1.00 1.00 1.00 1.00 1.00 0.98 0.97 1.00 0.34 2xx 1.00 1.00 0.41 0.56 0.98 0.74 0.98 0.60 0.98 0.69 0.96 0.85 0.97 0.62 0.92 0.71 0.94 0.57 0.97 0.86 0.73 0.73 0.93 0.81 0.97 0.46 0.90 0.23 3xx 1.00 1.00 0.47 0.82 0.90 0.81 0.92 0.79 0.85 0.78 0.81 0.82 0.94 0.67 0.68 0.60 0.72 0.50 0.84 0.81 0.54 0.29 0.81 0.82 0.92 0.55 0.77 0.31 H-mean 1.00 1.00 0.43 0.59 0.98 0.80 0.99 0.62 0.94 0.69 0.95 0.87 0.97 0.66 0.91 0.73 0.91 0.59 0.97 0.88 0.63 0.61 0.93 0.82 0.98 0.44 0.86 0.26 Symmetric relax ed measures H-mean 1.00 1.00 0.73 1.00 0.99 0.81 0.99 0.62 0.98 0.72 0.99 0.90 1.00 0.67 0.92 0.74 0.99 0.64 0.99 0.89 0.99 0.96 0.99 0.88 1.00 0.44 0.99 0.30 2008 1xx 1.00 1.00 0.96 1.00 1.00 1.00 1.00 1.00 1.00 1.00 1.00 1.00 0.96 0.79 1.00 1.00 0.92 1.00 1.00 1.00 1.00 0.34 2xx 1.00 1.00 0.41 0.56 0.96 0.69 0.96 0.70 0.95 0.85 0.97 0.64 0.56 0.52 0.97 0.86 0.48 0.53 0.96 0.82 0.95 0.21 3xx 1.00 1.00 0.47 0.82 0.95 0.66 0.82 0.71 0.81 0.77 0.90 0.71 0.61 0.40 0.87 0.81 0.49 0.25 0.80 0.81 0.92 0.21 H-mean 1.00 1.00 0.43 0.59 0.97 0.71 0.95 0.70 0.95 0.86 0.97 0.67 0.60 0.58 0.97 0.88 0.51 0.54 0.96 0.84 0.91 0.22 T able 3. Means of results obtained by participants on the benchmark test case (corresponding to harmonic means). The symmetric relax ed measure corresponds to the relax ed precision and recall measures of [7 ].
systems. This may be due the kind of algorithm which is used, that misses the target, but not by far.
Figure 2 shows the precision and recall graphs of this year. These results are only relevant for the results of participants who provide confidence measures different from 1 or 0 (see Table 2). This graph has been drawn with only technical adaptation of the technique used in TREC. Moreover, due to lack of time, these graphs have been com-puted by averaging the graphs of each of the tests (instead to pure precision and recall).
recall precision refalign edna aflood AgrMaker aroma ASMOV DSSim GeRoMe kosimap Lily MapPSO RiMOM SOBOM TaxoMap
Fig. 1. Each point expresses the position of a system with regard to precision and recall. This shows that most of the systems favor precision over recall.
These results and those displayed in Figure 1 single out the same group of systems, Lily, ASMOV, aflood, and RiMOM which seem to perform these tests at the highest level of quality. Of these, Lily and ASMOV have slightly better results than the two others. So, this confirms the leadership that we observed on raw results.
Like in the three previous campaigns, there is a gap between these systems and their followers (GeRoME, AROMA, DSSim, and AgreementMaker).
recall 0. 1. 0. pr ecision 1.
refalign edna aflood
AgrMaker AROMA ASMOV
DSSim GeRoMe kosimap
Lily MapPSO RiMOM
SOBOM TaxoMap
Fig. 2. Precision/recall graphs for benchmarks. The results given by the participants are cut under a threshold necessary for achieving n% recall and the corresponding precision is computed. Sys-tems for which these graphs are not meaningful (because they did not provide graded confidence values) are drawn in dashed lines.
4
Anatomy
Within the anatomy track we confront existing matching technology with real world ontologies. Currently, we find such real world cases primarily in the biomedical domain, where a significant number of ontologies have been built covering different aspects of medical research. Due to the complexity and the specialized vocabulary of the domain, matching biomedical ontologies is one of the hardest alignment problems.
4.1 Test data and experimental setting
The ontologies of the anatomy track are the NCI Thesaurus describing the human anatomy, published by the National Cancer Institute (NCI)3, and the Adult Mouse Anatomical Dictionary4, which has been developed as part of the Mouse Gene Ex-pression Database project. Both resources are part of the Open Biomedical Ontologies (OBO). A detailed description of the data set has been given in the context of OAEI 2007 [11] and 2008 [4].
As proposed in 2008 the task of automatically generating an alignment has been divided into four subtasks. Task #1 is obligatory for participants of the anatomy track, while task #2, #3 and #4 are optional tasks.
– For task #1 the matcher has to be applied with standard settings to obtain a result that is as good as possible with respect to the expected F-measure.
– In task #2 / #3 an alignment has to be generated that favors precision over recall and vice versa. Systems configurable with respect to these requirements will be more useful in particular application scenarios.
– In task #4 we simulate that a group of domain experts created an incomplete refer-ence alignment Rp. Given both ontologies as well as Rp, a matching system should be able to exploit the additional information encoded in Rp.
Due to the harmonization of the ontologies applied in the process of generating a reference alignment (see [3] and [11]), a high number of rather trivial correspondences (61%) can be found by simple string comparison techniques. At the same time, we have a good share of non-trivial correspondences (39%). The partial reference align-ment used in subtrack #4 is the union of all trivial correspondences and 54 non-trivial correspondences.
4.2 Results
In total, ten systems participated in the anatomy track (in 2007 there were eleven participants, in 2008 nine systems participated). An overview is given in Table 4. While the number of participants is stable, we find systems participating for the first time (SOBOM, kosimap), systems re-entering the competition after a year of absence (AgreementMaker, which is referred to as AgrMaker in the tables) and systems contin-uously participating (ASMOV, DSSim, Lily, RiMOM, TaxoMap).
3http://www.cancer.gov/cancerinfo/terminologyresources/
System 2007 2008 2009 aflood - √ √ AgrMaker √ - √+ AROMA - √ √ AOAS √+ - -ASMOV √ √ √ DSSim √ √ √ Falcon-AO √ - -kosimap - - √ Lily √ √ √ Prior+ √ - -RiMOM √ √+ √ SAMBO √+ √+ -SOBOM - - √+ TaxoMap √ √ √ X-SOM √ - -avg. F-measure 0.598 0.718 0.764
Table 4. Overview on anatomy participants from 2007 to 2009, a√-symbol indicates that the system participated, + indicates that the system achieved an F-measure ≥ 0.8 in subtrack #1.
In Table 4 we have marked the participants with an F-measure ≥ 0.8 with a + symbol. Unfortunately, the top performers of the last two years do not participate this year (AOAS in 2007, SAMBO in 2008). In the last row of the table the average of the obtained F-measures is shown. We observe significant improvements over time. How-ever, in each of the three years the top systems generated alignments with F-measure of ≈ 0.85. It seems that there is an upper bound which is hard to exceed.
Runtime Due to the evaluation process of the OAEI, the submitted alignments have been generated by the participants, who run the respective systems on their own ma-chines. Nevertheless, the resulting runtime measurements provide an approximate basis for a useful comparison. In 2007, we observed significant differences with respect to the stated runtimes. Lily required several days for completing the matching task and more than half of the systems could not match the ontologies in less than one hour. In 2008 we already observed increased runtimes. This year’s evaluation revealed that only one system still requires more than one hour. The fastest system is aflood (15 sec) followed by AROMA, which requires approximately 1 minute. Notice that aflood is run with a configuration optimized for runtime efficiency in task #1, it requires 4 minutes with a configuration which aims at generating an optimal alignment used for #2, #3, and #4. Detailed information about runtimes can be found in the second column of Table 5.
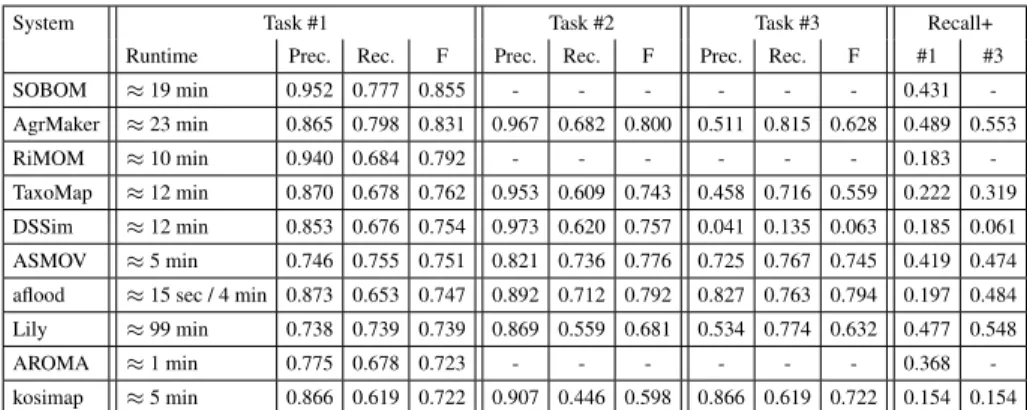
Results for subtracks #1, #2 and #3 Table 5 lists the results of the participants in descending order with respect to the F-measure achieved for subtrack #1. In the first two rows we find SOBOM and AgreementMaker. Both systems have very good results and distance themselves from the remaining systems. SOBOM, although participating for the first time, submitted the best result in 2009. The system seems to be optimized
System Task #1 Task #2 Task #3 Recall+
Runtime Prec. Rec. F Prec. Rec. F Prec. Rec. F #1 #3
SOBOM ≈ 19 min 0.952 0.777 0.855 - - - 0.431 -AgrMaker ≈ 23 min 0.865 0.798 0.831 0.967 0.682 0.800 0.511 0.815 0.628 0.489 0.553 RiMOM ≈ 10 min 0.940 0.684 0.792 - - - 0.183 -TaxoMap ≈ 12 min 0.870 0.678 0.762 0.953 0.609 0.743 0.458 0.716 0.559 0.222 0.319 DSSim ≈ 12 min 0.853 0.676 0.754 0.973 0.620 0.757 0.041 0.135 0.063 0.185 0.061 ASMOV ≈ 5 min 0.746 0.755 0.751 0.821 0.736 0.776 0.725 0.767 0.745 0.419 0.474
aflood ≈ 15 sec / 4 min 0.873 0.653 0.747 0.892 0.712 0.792 0.827 0.763 0.794 0.197 0.484
Lily ≈ 99 min 0.738 0.739 0.739 0.869 0.559 0.681 0.534 0.774 0.632 0.477 0.548
AROMA ≈ 1 min 0.775 0.678 0.723 - - - 0.368
-kosimap ≈ 5 min 0.866 0.619 0.722 0.907 0.446 0.598 0.866 0.619 0.722 0.154 0.154
Table 5. Participants and results with respect to runtime, precision, recall, recall+ and F-measure.
for generating a precise alignment, however, the submitted alignment contains also a number of non trivial correspondences (see the column Recall+ for subtrack #1).5
AgreementMaker generates a less precise alignment, but manages to output a higher number of correct correspondences. None of the other systems detected a higher number of non-trivial correspondences for both subtrack #1 and #3 in 2009. However, it cannot top the SAMBO submission of 2008, which is known for its extensive use of biomedical background knowledge.
The RiMOM system is slightly worse with respect to the achieved F-measure com-pared to its 2008 submission. The precision has been improved, however, this caused a loss of recall and in particular a significant loss of recall+. Unfortunately, RiMOM did not participate in subtask #3, so we cannot make statements about its strength in detecting non-trivial correspondences based on a different configuration.
The systems listed in the following columns achieve similar results with respect to the overall quality of the generated alignments (F-measures between 0.72 and 0.76). However, significant differences can be found in terms of the trade-off between preci-sion and recall. All systems except ASMOV and Lily favor precipreci-sion over recall. Notice that a F-measure of 0.755 can easily be achieved by constructing a highly precise align-ment without detecting any non-trivial correspondences. At the same time it is relatively hard to generate an alignment with a F-measure of 0.755 that favors recall over preci-sion. Thus, the results of ASMOV and Lily have to be interpreted more positively than indicated by the F-measure.
The observation that it is not hard to construct a highly precise alignment with ac-ceptable recall is supported by the results of subtask #2, where we find relatively sim-ilar results for all participants. In particular, it turned out that some systems (ASMOV, DSSim) have their best F-measure in track #2. The evaluation results for aflood require some additional explanations. aflood is run for track #1 with a configuration which re-sults in a significant reduction of the runtime (15 sec), while for track #2 and #3 the
5
Recall+ is defined as recall restricted to the subset of non trivial correspondences in the refer-ence alignment. A detailed definition can be found in the results paper of 2007 [11].
system required approximately 4 minutes due to different settings. Therefore, aflood creates better alignments as solutions to subtask #2 and #3.
In 2007 we were surprised by the good performance of the naive label compari-son approach. Again, we have to emphasize that this is to a large degree based on the harmonization of the ontologies that has been applied in the context of generating the reference alignment. Nevertheless, the majority of participants was able to top the re-sults of the trivial string matching approach this year.
Results for subtrack #4 In the following we refer to an alignment generated for task #1 resp. #4 as A1resp. A4. This year we have chosen an evaluation strategy that differs from the approach of the last year. We compare A1∪Rpresp. A4∪Rpwith the reference alignment R. Thus, we compare the situation where the partial reference alignment is added after the matching process has been conducted against the situation where the partial reference alignment is available as additional resource used within the matching process. The results are presented in Table 6.
System ∆-Precision ∆-Recall ∆-F-Measure
SAMBOdtf2008 +0.0200.837→0.856 +0.0030.867→0.870 +0.0110.852→0.863
ASMOV +0.0340.759→0.792 −0.0180.808→0.790 +0.0090.782→0.791
aflood#3 +0.0050.838→0.843 +0.0030.825→0.827 +0.0040.831→0.835
TaxoMap +0.0190.878→0.897 −0.0260.732→0.706 −0.0080.798→0.790
AgrMaker +0.1280.870→0.998 −0.1810.831→0.650 −0.0630.850→0.787
Table 6. Changes in precision, recall and F-measure based on comparing A1∪Rp, resp. A4∪Rp,
against reference alignment R.
Four systems participated in task #4. These systems were aflood, AgreementMaker, ASMOV and TaxoMap. In Table 6 we additionally added a row that displays the 2008 submission of SAMBOdtf, which had the best results for subtrack #4 in 2008. For aflood we used A3instead of A1to allow a fair comparison, due to the fact that A1was generated with runtime optimization configuration.
A first look at the results shows that all systems use the partial reference align-ment to increase the precision of their systems. Most of them them have slightly better values for precision (between 0.5% and 3.4%), only AgreementMaker uses the addi-tional information in a way which has a stronger impact in terms of a significantly increased precision. However, only three correspondences have been found that have not been in the partial reference alignment previously6. Only SAMBOdtf and aflood profit from the partial reference alignment by a slightly increased recall, while the other systems wrongly filter out some correct correspondences. This might be based on two specifics of the dataset. On the one hand the major part of the reference alignment con-sists of trivial correspondences easily detectable by string matching algorithms, while the unknown parts share a different characteristic. Any approach which applies ma-chine learning techniques to learn from the partial reference alignment is thus bound to fail. On the other hand parts of the matched ontologies are incomplete with respect to
subsumption axioms. As pointed out in [16], the completeness of the structure and the correct use of the structural relations within the ontologies has an important influence on the quality of the results. For these reasons it is extremely hard to use the partial reference alignment in an appropriate way in subtask #4.
4.3 Conclusions
Although it is argued that domain related background knowledge is a crucial point in matching biomedical ontologies (see for example [1; 20]), the results of 2009 raise some doubts about this issue. While in 2007 and 2008 the competition was clearly dominated by matching systems heavily exploiting background knowledge (UMLS), this years top performer SOBOM uses none of these techniques. However, the strong F-measure of SOBOM is mainly based on high precision. Comparing the alignments generated by SAMBO in 2008 and SOBOM in 2009 it turns out that SAMBO detected 136 correct correspondences not found by SOBOM, while SOBOM finds 36 correct correspondences not detected by SAMBO. Unfortunately, SOBOM did not participate in subtrack #3. Thus, it is hard to assess its capability for detecting non-trivial corre-spondences. The results of subtask #4 are disappointing at first sight. Since this kind of task has been introduced in 2008, we expected better results in 2009. However, it turned out again that only minor positive effects can be achieved. But, as already argued, the task of subtrack #4 is hard and systems with acceptable results in subtrack #4 might obtain good results under better conditions.
5
Conference
The conference test set introduces matching several more-or-less expressive ontologies. Within this track the results of participants are evaluated using diverse evaluation meth-ods. First, classical evaluation wrt. the reference alignment was made, for the ontology pairs where this alignment is available. Second, posterior manual evaluation was made for all ontology pairs using even sampling across all matchers. Third, the complete results were submitted to a data mining tool for discovery of association hypotheses, taking into account specific mapping patterns. Fourth, alignment incoherence was anal-ysed with the help of a logical reasoner.
5.1 Test data
The collection consists of fifteen ontologies in the domain of organizing conferences. Ontologies have been developed within the OntoFarm project7. In contrast to last year’s conference track, we alsoconsidered subsumption results in evaluation.
The main features of this test set are:
– Generally understandable domain. Most ontology engineers are familiar with or-ganizing conferences. Therefore, they can create their own ontologies as well as evaluate the alignment among their concepts with enough erudition.
– Independence of ontologies. Ontologies were developed independently and based on different resources, they thus capture the issues in organizing conferences from different points of view and with different terminologies.
– Relative richness in axioms. Most ontologies were equipped with DL axioms of various kinds, which opens a way to use semantic matchers.
Ontologies differ in numbers of classes, of properties, in their DL expressivity, but also in underlying resources. Ten ontologies are based on tools supporting the task of organizing conferences, two are based on experience of people with personal par-ticipation in conference organization, and three are based on web pages of concrete conferences.
Participants were to provide all correct correspondences (equivalence and/or sub-sumption) and/or “interesting correspondences” within a collection of ontologies de-scribing the domain of organizing conferences.
This year, results of participants are evaluated by four different methods of evalu-ation: evaluation based on reference alignment, manual labeling, data mining method, and logical reasoning. In addition, we extended the reference alignment from the pre-vious year. Now we have 21 alignments, which correspond to the complete alignment space between 7 ontologies from the data set. Manual evaluation produced statistics such as precision and will also serve as input into evaluation based on data mining and will help in the process of improving and building a reference alignment. Results of participants are checked with regard to their incoherency. These evaluation methods are concisely described at the track result page.
5.2 Results
We had seven participants: aflood, AgreementMaker (AgrMaker), AMExt (an extended version of AgreementMaker), AROMA, ASMOV, DSSim, and kosimap. Here are some basic data, besides evaluations:
– All participants delivered all 105 alignments, except for aflood, which delivered 103 alignments.
– Two participants (ASMOV and DSSim) delivered not only equivalence correspon-dences but also subsumptions.
– aflood and DSSim matchers delivered “certain” correspondences; other matchers delivered correspondences with confidence values between 0 and 1.
Evaluation based on reference alignment We evaluated the results of participants against a reference alignment. In the case of ASMOV and DSSim we filtered out sub-sumptions. It includes all pairwise combinations of different 7 ontologies (21 align-ments).
In Table 7, there are traditional precision, recall, and F-measure computed for three different thresholds of certainty factor (0.2, 0.5, and 0.7).
For better comparison we established the confidence threshold which provides the highest average F-measure (Table 8). Precision, Recall, and F-measure are given for this optimal confidence threshold. The dependency of F-measure on confidence threshold
t=0.2 t=0.5 t=0.7 Prec. Rec. FMeas. Prec. Rec. FMeas. Prec. Rec. FMeas.
aflood 48% 61% 52% 48% 61% 52% 48% 61% 52% AgrMaker 45% 61% 50% 45% 61% 50% 6% 55% 56% AMExt 30% 60% 39% 30% 60% 39% 41% 53% 46% AROMA 37% 49% 41% 38% 49% 42% 40% 19% 25% ASMOV 58% 40% 47% 22% 3% 4% 5% 1% 1% DSSim 15% 51% 22% 15% 51% 22% 15% 51% 22% kosimap 18% 56% 27% 41% 43% 41% 70% 23% 33%
Table 7. Recall, precision and F-measure for three different confidence thresholds.
matcher confidence threshold Prec. Rec. FMeas.
aflood * 48% 61% 52% AgrMaker 0.75 69% 51% 57% AMExt 0.75 54% 50% 51% AROMA 0.53 39% 48% 42% ASMOV 0.23 68% 38% 47% DSSim * 15% 51% 22% kosimap 0.51 52% 42% 45%
Table 8. Confidence threshold, precision and recall for optimal F-measure for each matcher.
can be seen from Figure 3. There are two asterisks in the column of confidence threshold for matchers which did not provide graded confidence.
In conclusion, the matcher with the highest average F-measure (.57) is that of AgreementMaker at .75. However we should take into account that this evaluation has been made over small part of all alignments (one fifth).
Comparison with previous year We evaluated the results of participants of OAEI 2008 (ASMOV, DSSim and Lily) against the new reference alignments. For these three matchers from OAEI 2008, we found an optimal confidence threshold in terms of high-est average F-measure, see Table 9. In the case of DSSim there is an asterisk because this matcher did not provide graded confidence.
In conclusion, the matcher with the highest average F-measure (0.49) was the DSSim. However we should take into account that this evaluation has been made over small part of all alignments (one fifth). We can also compare performance of partici-pants of both years ASMOV and DSSim. While in terms of highest average F-measure ASMOV improved from 43% to 47%, DSSim declined from 49% to 22%. We can also see that ASMOV matcher from OAEI 2009 delivered more correspondences with lower confidence than in OAEI 2008.
matcher confidence threshold Prec. Rec. FMeas.
ASMOV 0.22 48% 39% 43%
DSSim * 48% 56% 49%
Lily 0.25 43% 52% 45%
Table 9. Confidence threshold, precision and recall for optimal F-measure for each matcher.
Restricted semantic precision and recall Furthermore, we computed restricted seman-tic precision and recallusing a tool from University of Mannheim [12]. We took into account matchers which delivered correspondences with subsumption relations, i.e., ASMOV and DSSim. In Table 10 there are two different semantics variants (natural and pragmatic) of restricted semantic precision and recall computed for confidence thresh-old 0.238.
natural pragmatic matcher Prec. Rec. Prec. Rec.
ASMOV 83% 65% 86% 68%
DSSim 1.7% 94% 2% 95%
Table 10. Restricted semantic precision and recall for a confidence threshold of 0.23.
In conclusion, from Table 10 we can see that considering correspondences with subsumption relations ASMOV has better performance in both precision and recall, whereas DSSim has much better recall at expense of lower precision.
8
This an optimal confidence threshold in terms of highest F-measure for ASMOV. DSSim does not have graded confidence.
Evaluation based on posterior manual labeling This year we take the most secure, i.e., with highest confidence, correct correspondences as a population for each matcher. It means we evaluate 150 correspondences per matcher randomly chosen from all cor-respondences of all 105 alignments with confidence 1.0 (sampling). Because AROMA, ASMOV and kosimap do not have enough correspondences with 1.0 confidence we take 150 correspondences with highest confidence. In the case of AROMA it was not possible to distinguish between all 153 correspondences so we sampled over its popu-lation.
In table 11 you can see approximated precisions for each matcher over its popu-lation of best correspondences. N is a popupopu-lation of all the best correspondences for one matcher. n is a number of randomly chosen correspondences so as to have 150 best correspondences for each matcher. TP is a number of correct correspondences from the sample, and P* is an approximation of precision for the correspondences in each popu-lation; additionally there is a margin of error computed as:
√ (N/n)−1
√
N based on [24].
matcher aflood AgrMaker AMExt AROMA ASMOV DSSim kosimap
N 1779 326 360 153 150 5699 150
n 150 150 150 150 150 150 150
TP 74 120 103 83 127 9 144
P* 49% 80% 69% 55% 85% 6% 96%
±7.8% ±6% ±6.2% ±1.1% ±8.1%
Table 11. Approximated precision for 150 best correspondences for each matcher.
From table 11 we can conclude that kosimap has the best precision (.96) over its 150 more confident correspondences.
Evaluation based on data mining supported with mapping patterns (based on [19]). As opposed to ontology design patterns9, which usually concern one ontology, mapping patterns deal with (at least) two ontologies. Mapping patterns reflect the inter-nal structure of ontologies as well as correspondences across the ontologies.
We recognise nine mapping patterns:
– MP1 (“Parent-child triangle”): it consists of an equivalence correspondence be-tween classes A and B and an equivalence correspondence bebe-tween A and a child of B, where A and B are from different ontologies.
– MP2 (“Mapping along taxonomy”): it consists of simultaneous equivalence corre-spondences between parents and between children.
– MP3 (“Sibling-sibling triangle”): it consists of simultaneous correspondences be-tween class A and two sibling classes C and D where A is from one ontology and C and D are from another ontology.
– MP4: it is inspired by the ’class-by-attribute’ correspondence pattern, where the class in one ontology is restricted to only those instances having a particular value for a a given attribute/relation.
– MP5: it is inspired by the “composite” correspondence pattern. It consists of a class-to-class equivalence correspondence and a property-to-property equivalence correspondence, where classes from the first correspondence are in the domain or in the range of properties from the second correspondence.
– MP6: it is inspired by the “attribute to relation” correspondence pattern where a datatype and an object property are aligned as an equivalence correspondence. – MP7: it is the variant of the MP5 “composite pattern”. It consists of an equivalence
correspondence between two classes and an equivalence correspondence between two properties, where one class from the first correspondence is in the domain and the other class from that correspondence is in the range of equivalent properties, except the case where domain and range is the same class.
– MP8: it consists of an equivalence correspondence between A and B and an equiv-alence correspondence between a child of A and a parent of B where A and B are from different ontologies. It is sometimes referred to as criss-cross pattern. – MP9: it is the variant of MP3, where the two sibling classes C and D are disjoint.
MP4, MP5, and MP6 are inspired by correspondence patterns from [21]. In princi-ple, it is not possible to tell which mapping pattern is desirable or not desirable. This must be decided on the basis of an application context or possible alternatives. How-ever, we could roughly say that while MP2 and MP5 seems to be desirable, MP7, MP8, and MP9 indicate incorrect correspondences related to inconsistency.
In Table 12 there are numbers of occurrences of mapping patterns in results of participants of OAEI 2009. We already see that some patterns are more typical for some systems than for other. Proper quantification of this relationship as well as its combination with other characteristics of correspondences is however the task for a mining tool. System MP1 MP2 MP3 MP4 MP5 MP6 MP7 MP8 MP9 aflood 0 168 0 272 158 108 6 4 0 AgrMaker 0 127 0 272 81 209 22 2 0 amext 0 128 0 346 112 419 25 4 0 AROMA 238 206 6 442 35 61 13 12 0 asmov 0 350 0 393 0 0 0 0 0 dssim 479 74 964 962 47 410 24 47 295 kosimap 38 233 159 815 392 62 10 4 22
Table 12. Occurrences of mapping patterns in OAEI 2009 results.
For the data-mining analysis we employed the 4ft-Miner procedure of the LISp-Minerdata mining system10for mining of association rules. We found several interest-ing association hypotheses: t1 to t6 are related to confidence or underlyinterest-ing resources of ontologies (see Table 13) and m1 to m10 are related to mapping patterns (see Table 14). In total there were 21117 correspondences in the data matrix. We can interpret some of these hypotheses as follows:
Antecedent Succedent Values System Confidence Resource1 Resource2 Result Supp AvgDff
t1 AgrMaker > 0.9 * * + 0.01 2.876 t2 ASMOV < 0.3 * * + 0.01 2.546 t3 kosimap < 0.3; 0.6) * * + 0.01 2.497 t4 DSSim * i w - 0.01 2.287 t5 kosimap < 0.3; 0.6) * t + 0.01 2.267 t6 kosimap * * i - 0.02 1.215
Table 13. Hypotheses for tasks 1 and 2.
Antecedent Succedent
Values-System ResultMP Supp AvgDff
m1 ASMOV MP2 0.02 3.418 m2 AROMA MP1 0.01 2.434 m3 DSSim MP3 0.05 2.164 m4 AMExt MP6 0.02 1.481 m5 ASMOV MP4 0.02 0.874 m6 kosimap MP5 0.02 0.874 m7 DSSim MP9 0.01 2.448 m8 DSSim MP8 0.002 1.386 m9 AgrMaker MP7 0.001 1.266 m10 AMExt MP7 0.001 0.879
– Hypothesis t1: Correspondences that are produced by system AgreementMaker and have high confidence values (higher than 0.9) are by 287%, i.e. almost four times, more often correct than correspondences produced by all systems with all confi-dence values (on average).
– Hypothesis t4: Correspondences that are produced by system DSSim where ontol-ogy 1 is based on expert knowledge and ontolontol-ogy 2 is based on web are by 228%, i.e., more than three times, more often incorrect than correspondences produced by all systems for all types of ontologies (on average).
– Hypothesis m1: Correspondences that are produced by matcher ASMOV are by 341%, i.e., more than four times, more often part of MP2 than correspondences produced by all systems (on average).
– Hypothesis m4: Correspondences that are produced by matcher AMExt are by 148%, i.e., more than twice, more often part of MP6 than correspondences pro-duced by all systems (on average).
– Hypothesis m7: Correspondences that are produced by matcher DSSim are by 244%, i.e., more than three times, more often part of MP9 than correspondences produced by all systems (on average).
– Hypothesis m9: Correspondences that are produced by matcher AgreementMaker are by 126%, i.e., more twice, more often part of MP7 than correspondences pro-duced by all systems (on average).
In conclusion, regarding the first three hypotheses we could say that Agreement-Maker is more sure about correspondences with high values than other matchers, AS-MOV is suprisingly more correct about correspondences with low confidence values than other matchers and kosimap is more correct for correspondences with medium confidence values. According to next three hypotheses we could say that kosimap works better with ontologies based on tool than web. Further DSSim has problems with align-ing “expert’ ontologies” and “web” ontologies.
Regarding the three first mapping patterns, ASMOV found MP2, AROMA MP1, and DSSim MP3. Furthermore, AMExt found MP6 as simple correspondence, which is discutable. Maybe it could be better to find instead of datatype property to object property “property-chain” which would allow mapping between datatype property to datatype property via object property as an intermediate mapping element. ASMOV found some correspondences where one class is restricted over certain property’s value (MP4) and kosimap found composite pattern (MP5). Finally, some occurrences of the last three mapping patterns were found over the results of DSSim, AgreementMaker, and AMExt. However these related hypotheses had low support except for DSSim and MP9. Anyway we can say that these matchers could be improved if they check the consistency of their results.
Evaluation based on alignment coherence In 2008 we evaluated for the first time the coherence of the submitted alignments. Again, we picked up the same evaluation approach using the maximum cardinality measure mt
card proposed in [17]. The m t card measure compares the number of correspondences that have to be removed to arrive at a coherent subset against the number of all correspondences in the alignment. The resulting number can be considered as the degree of alignment incoherence. A number
of 0% means, for example, that the alignment is coherent. In particular, we use the pragmatic alignment semantic as defined in [18] to interpret the correspondences of an alignment.
In our experiments we focused on equivalence correspondences and removed sub-sumption correspondences from the submitted alignments prior to our evaluation. We applied our evaluation approach to the subset of those matching tasks where a reference alignment is available. We used the Pellet reasoner to perform our experiments and ex-cluded the Iasted ontology, which caused reasoning problems in combination with some of the other ontologies.
Results are presented in Table 15. For all systems we used the alignments after ap-plying the optimal confidence threshold (see subscript), and the systems marked with * are those systems that did not deliver a graded confidence. Comparing the correspond-ing results, the ASMOV system clearly distances itself from the remaincorrespond-ing participants. All of the generated alignments were coherent and thus we measured 0% degree of in-coherence. However, the thresholded ASMOV alignments contain only few correspon-dences compared to the alignments of the other systems, which makes it more probable to construct coherent alignments. Thus, we also included the untresholded ASMOV alignments (no subscript) in our analysis: We measured a degree of incoherence of 1.8%, a value that is still significantly lower compared to the other systems. These re-sults also concide with the rere-sults presented in Table 14 related to the occurrence of the MP7 to MP9 mapping patterns.
While the verification component built into ASMOV detects most incoherences, none of the other systems uses similar strategies. We have to conclude that logical aspects play only a subordinate role within the approaches implemented in the other matching systems. Additionally, we analyzed what happens when the verification com-ponent of ASMOV is turned off.11The results are presented in the ASMOVxrow. No-tice that the measured values are now similar to the coherence characteristics of the other systems.
In conclusion, these observations also offer an explanation for the significant dif-ference between DSSim and ASMOV with respect to restricted semantic precision and recall (see again Table 10). Computing restricted semantic precision and recall of an alignment A requires to compute the closure of A with respect to derivable subsump-tion correspondences. Suppose now that A is incoherent and a large fracsubsump-tion of concepts C1, ..., Cnin O1and D1, ..., Dmin O2becomes unsatisfiable. It follows that A entails each correspondence of the type ... w Ciwith i = 1 . . . n, respectively Dj v ... with j = 1 . . . m. A highly incoherent alignment will thus entail a huge amount of incorrect correspondences. This is the explanation for DSSim’s low precision of approximately 2%. These considerations also indicate that the degree of incoherence might have a strong effect on any application that requires to exploit an alignment in a reasoning context.
11
We would like to thank Yves R. Jean-Mary for providing us with the corresponding set of alignments.
System Correspondences Incoherent Alignments mt card-mean ASMOV.23 140 0 0.0% ASMOV 233 3 1.8% kosimap.51 189 6 10.6% ASMOVx 316 13 14.7% AgrMaker.75 173 12 15.0% aflood∗ 288 15 19.8% AROMA.53 264 13 20.1% AMExt.75 236 13 20.3% DSSim∗ 789 15 > 42.2%
Table 15. Number of evaluated correspondences, number of coherent alignments (15 alignments have been analyzed), mean of the maximum cardinality measure. Subscripts refer to the appli-cation of a confidence threshold, ASMOVx refers to ASMOV with the semantic verification
component turned off.
6
Directory
The directory test case aims at providing a challenging task for ontology matchers in the domain of large directories to show whether ontology matching tools can effectively be applied for the integration of “shallow ontologies”. The focus of this task is to evaluate performance of existing matching tools in real world taxonomy integration scenario.
6.1 Test set
As in previous years [9; 11; 4], the data set exploited in the directory matching task was constructed from Google, Yahoo and Looksmart web directories following the method-ology described in [13]. The data set is presented as taxonomies where the nodes of the web directories are modeled as classes and classification relation connecting the nodes
is modeled as anrdfs:subClassOfrelation.
The key idea of the data set construction methodology is to significantly reduce the search space for human annotators. Instead of considering the full matching task which is very large (Google and Yahoo directories have up to 3 ∗ 105nodes each: this means that the human annotators need to consider up to (3∗105)2= 9∗1010correspondences), it uses semi automatic pruning techniques in order to significantly reduce the search space. For example, for the data set described in [13], human annotators consider only 2265 correspondences instead of the full matching problem.
The specific characteristics of the data set are:
– More than 4.500 node matching tasks, where each node matching task is composed from the paths to root of the nodes in the web directories.
– Reference alignment for all the matching tasks.
– Simple relationships, in particular, web directories contain only one type of rela-tionships, which is the so-called classification relation.
– Vague terminology and modeling principles, thus, the matching tasks incorporate the typical real world modeling and terminological errors.
6.2 Results
In OAEI 2009, 7 out of 16 matching systems participated on the web directories test case, while in OAEI-2008, 7 out of 13, in OAEI 2007, 9 out of 18, in OAEI 2006, 7 out of 10, and in OAEI 2005, 7 out of 7 did it.
Precision, recall and F-measure results of the systems are shown in Figure 4. These indicators have been computed following the TaxMe2 [13] methodology, with the help of the Alignment API [8], version 3.4.
Fig. 4. Matching quality results.
We can observe from Table 16, that in general the systems that participated in the directory track in 2008 (DSSim, Lily and TaxoMap), have either maintained or de-creased their precision and recall values. The only system that inde-creased its recall value is ASMOV. In fact, ASMOV is the system with the highest F-measure value in 2009.
Table 16 shows that in total 24 matching systems have participated in the directory track during the 5 years (2005 – 2009) of the OAEI campaigns. No single system has participated in all campaigns involving the web directory dataset (2005 – 2009). A total of 16 systems have participated only one time in the evaluation, only 3 systems have participated 2 times, and 5 systems have participated 3 times.
As can be seen in Figure 5 and Table 16, there is an increase in the average precision for the directory track up to 2008, remaining constant in 2009. The average recall in 2009 increased in comparison to 2008, but the highest average recall remains that of 2007. Considering F-measure, results for 2009 show the highest average in the 4 years (2006 to 2009). Notice that in 2005 the data set allowed only the estimation of recall, therefore Figure 5 and Table 16 do not contain values of precision and F-measure for 2005.
A comparison of the results in 2006, 2007, 2008 and 2009 for the top-3 systems of each year based on the highest values of the F-measure indicator is shown in Figure 6. The key observation here is that even though two of the top-3 systems of 2008 (Lily and DSSim) participated in the directory task this year, they did not manage to get into the top-3, indicating an overall increase of performance by the total set of participating
System Recall Precision F-Measure Year → 2005 2006 2007 2008 2009 2006 2007 2008 2009 2006 2007 2008 2009 aflood 0.40 0.57 0.47 ASMOV 0.44 0.12 0.65 0.59 0.64 0.60 0.50 0.20 0.63 automs 0.15 0.31 0.20 CIDER 0.38 0.60 0.47 CMS 0.14 COMA 0.27 0.31 0.29 ctxMatch2 0.09 DSSim 0.31 0.41 0.41 0.60 0.60 0.60 0.41 0.49 0.49 Dublin20 0.27 Falcon 0.31 0.45 0.61 0.41 0.55 0.43 0.58 FOAM 0.12 HMatch 0.13 0.32 0.19 kosimap 0.52 0.62 0.56 Lily 0.54 0.37 0.33 0.57 0.59 0.57 0.55 0.46 0.42 MapPSO 0.31 0.57 0.40 OCM 0.16 0.33 0.21 OLA 0.32 0.84 0.62 0.71 OMAP 0.31 OntoDNA 0.03 0.55 0.05 Prior 0.24 0.71 0.34 0.56 0.28 0.63 RiMOM 0.40 0.71 0.17 0.39 0.44 0.55 0.40 0.55 0.26 SOBOM 0.42 0.59 0.49 TaxoMap 0.34 0.34 0.59 0.59 0.43 0.43 X-SOM 0.29 0.62 0.39 Average 0.22 0.26 0.50 0.30 0.44 0.35 0.57 0.59 0.59 0.29 0.49 0.39 0.50 # 7 7 9 7 7 7 9 7 7 7 9 7 7
Table 16. Summary of submissions by year (no precision was computed in 2005). The Prior line covers Prior+ as well and the OLA line covers OLA2as well.
systems this year. As can be seen in Table 16, DSSim maintained its performance of 2008, having the same F-measure as SOBOM (a newcomer and 3rd place of 2009), only 1% less of recall than SOBOM, but 1% more of precision. ASMOV increased its F-measure, presenting the highest value for this year directory track, and in overall in its 3 years of participation. The second place corresponds to kosimap, also a newcomer. The quality of the best F-measure result of 2009 (0.63) achieved by ASMOV is higher than the best F-measure of 2008 (0.49) demonstrated by DSSim and higher than that of 2006 by Falcon (0.43), but still lower than the best F-measure of 2007 (0.71) by OLA2. The best precision result of 2009 (0.62) achieved by kosimap is lower than the best precision value of 2008 (0.64) demonstrated by ASMOV and equal to the results obtained in 2007 by both OLA2and X-SOM. Finally, for what concerns recall, the best result of 2009 (0.65) achieved by ASMOV is higher than the best value of 2008 (0.41) demonstrated by DSSim and the best value in 2006 (0.45) by Falcon, but still lower than the best result obtained in 2007 (0.84) obtained by OLA2.
Fig. 6. Comparison of matching quality results in 2006, 2007, 2008 and 2009.
Partitions of positive and negative correspondences according to the system results are presented in Figures 7 and 8, respectively.
Figure 7 shows that the systems managed to discover only 68% of the total number of positive correspondences (Nobody = 32%). Only 26% of positive correspondences were found by all seven participating systems. The percentage of positive correspon-dences found by the systems this year is higher than the values of 2008, when 54% of the positive correspondences where found. Figure 8 shows that more than half (56%) of the negative correspondences were not found by the systems (correctly) in comparison to 66% not found in 2008. Figure 8 also shows that all participating systems found 17% of the negative correspondences, i.e., mistakenly returned them as positive. The last two observations suggest that the discrimination ability of the dataset remains still high as in previous years.
Let us now compare partitions of the system results in 2006, 2007, 2008 and 2009 on positive and negative correspondences, see Figures 9 and 10, respectively. Figure 9
Fig. 7. Partition of the system results on positive correspondences.
shows that 32% of positive correspondences have not been found by any of the matching systems this year. This value is better that the values of 2006 (43%) and 2008 (46%). In 2007 all the positive correspondences have been collectively found; these results (2007) were exceptional because the participating systems all together had a full coverage of the expected results and very high precision and recall. Unfortunately, the best systems of 2007 did not participate this year (nor in 2008) and the other systems do not seem to cope with the results of 2007.
Fig. 9. Comparison of partitions of the system results on positive correspondences in 2006, 2007, 2008 and 2009.
Fig. 10. Comparison of partitions of the system results on negative correspondences in 2006, 2007, 2008 and 2009.
Figure 10 shows that this year 56% of the negatives correspondences were correctly not found. There is a decrease in comparison to the value of 2008, when 66% of the negatives correspondences where not found, being the best value in all years (2006 to 2009). This year 17% of the negative correspondences were mistakenly found by all
the (7) participating systems, being the best value that of last year (1%). An interpre-tation of these observations could be that the set of participating systems in 2009 have a more cautious strategy than in 2007 and 2006, but still a little bit more brave than in 2008. In 2007, we can observe that the set systems showed the most brave strategy in discovering correspondences of all the yearly evaluation initiatives, when the set of positive correspondences was fully covered, but covering mistakenly also 98% of the negative correspondences. This year the behavior of the overall systems is more similar (but better) to the behavior of the overall set of participating systems in 2008.
6.3 Comments
This year the average performance of the systems (given by F-measure in Figure 5) is the best of all 4 years (2006 to 2009). This suggests that the set of participating systems have found a balance between a brave and cautious behavior for discovering correspon-dences. However, the value for the F-measure (0.51) indicates that there is still room for further improvements. Finally, as partitions of positive and negative correspondences in-dicate (see Figure 7 and Figure 8), the dataset still retains a good discrimination ability, i.e., different sets of correspondences are still hard for the different systems.
7
Library
This task, organized in the context of the TELplus12project, focuses on a case for which the MACS13project established a (partial) manual reference alignment. Participants of this task had to create pairwise alignments between three large subject heading lists in different languages. The required alignments links were SKOS relations. This task is similar, from a methodological perspective, to the OAEI 2008 Library track. It uses however a different dataset.
7.1 Test data
The vocabularies to match are:
– LCSH, the Library of Congress Subject Headings, available as linked data at http://id.loc.gov. Contains around 340K concepts, including 250K gen-eral subjects.
– RAMEAU, the heading list used at the French National Library, available as linked data at http://stitch.cs.vu.nl/rameau. Contains around 150K con-cepts, including 90K general subjects.
– SWD, the heading list used at the German National Library. Contains 800K con-cepts, including 160K general subjects.
12
http://www.theeuropeanlibrary.org/telplus
The concepts from the three vocabularies are used as subjects of books. For each concept, the usual SKOS lexical and semantic information is provided: preferred labels, synonyms and notes, broader and related concepts, etc. The three subject heading lists have been represented according to the SKOS model, but an OWL version has also been made available. Note that even though two of these vocabularies are available online as RDF data, we have provided dumps for the convenience of participants.
We have also made available a part of the MACS manual correspondences between these vocabularies, which can be used as a learning set. However, none of the partici-pants asked for it.
7.2 Evaluation and results
Only one team handed in final results: TaxoMap, which produced results as listed in Table 17.
Type of relation LCSH-RAMEAU RAMEAU-SWD LCSH-SWD
exactMatch 5,074 1,265 38
broadMatch 116,789 17,220 0
narrowMatch 48,817 6,690 0
relatedMatch 13,205 1,317 0
Table 17. Taxomap results.
We have followed the dual evaluation approach of the previous 2008 Library Track, which featured a “thesaurus merging” evaluation (based on a post-hoc partial reference alignment) and a “re-indexing” one (assessing the use of correspondences for translat-ing subject annotations from one thesaurus to another). The main difference is that the first evaluation method has now been replaced by comparing to an already existing par-tial reference alignment (the MACS one), avoiding to manually assess the participant’s results.
Comparing with partial reference alignment (MACS) As no participant used the training set we provided, we use the complete MACS correspondences as reference alignment. In the version we received (MACS is still currently adding manual corre-spondences to this reference set), this reference alignment comprised 87,183 LCSH-RAMEAU correspondences, 13,723 LCSH-RAMEAU-SWD correspondences, and 12,203 LCSH-SWD correspondences.
Table 18 shows the results when taking into account all correspondences that belong to a certain relation selection. For a given relation selection, the token “–” means that no extra relation was provided at that level, hence the results are identical to the ones of the previous selection level. Cov. refers to the coverage, that is, the percentage of MACS correspondences which were found in the evaluated alignment.
Table 19 shows the results obtained when selecting only the “best” available corre-spondences for one concept (that is, the one with the highest confidence measure), and discarding the others.
TaxoMap links evaluated LCSH-RAMEAU RAMEAU-SWD LCSH-SWD
Prec. Cov. Prec. Cov. Prec. Cov.
exactMatch 72.1 5.7 27.1 1.4 44.4 0.03
eM + broadMatch 3.6 6.9 2.3 1.9 – –
eM + bM + narrowMatch 2.8 7.3 1.8 2.0 – –
all relations 2.7 7.5 1.9 2.2 – –
Table 18. Results for comparison with MACS (percentage) – using all correspondences.
TaxoMap links evaluated LCSH-RAMEAU RAMEAU-SWD LCSH-SWD
Prec. Cov. Prec. Cov. Prec. Cov.
exactMatch 78.7 5.7 39.5 1.4 44.4 0.03
eM + broadMatch 22.0 6.0 13.5 1.6 – –
eM + bM + narrowMatch 14.4 5.9 10.8 1.6 – –
all relations 13.4 5.8 10.9 1.7 – –
Table 19. Results for comparison with MACS (percentage) – using only the best correspondences for each concept.
Results for the re-indexing scenario The second usage scenario is based on an an-notation translationprocess supporting the re-indexing of books indexed with one vo-cabulary, using concepts from the mapped vocabulary (see [14]). Here we use book annotations from the British Library (using LCSH), the French National Library (using RAMEAU) and the German National Library (using SWD), see Table 19(a).
For each pair of vocabularies A-B, this scenario interprets the correspondences as rules to translate existing book annotations with A into equivalent annotations with B. In the case at hand, the book collections have a few books in common (cf. Table 19(b)), which are therefore described according to two vocabularies. Based on the quality of the results for those books for which we know the correct annotations, we can assess the quality of the initial correspondences.
(a) Collections and books with subject anno-tations.
Collection Books with subject annotation
English 2,448,050
French 1,457,143
German 1,364,287
(b) Common books between differ-ent collections.
Collection pair Common books French–English 182,460 German–English 83,786
German–French 63,340
Table 20. Data on collections.
Evaluation settings and measures. For each pair of vocabularies A-B, the simple concept-to-concept correspondences sent by participants were transformed into more complex mapping rules that associate one concept from A with a set of concepts from B – as some concepts are involved in several correspondences.