DURING A TIME OF CRISIS
by Francesca Bartolacci, Antonella Paolini, Ermanno Zigiotti
1. Innovation and performance
Innovation and performance are general terms with varying definitions in economic research. As a result, there is no one generally accepted defi-nition.
With reference to innovation, many have questioned the meaning of an “innovative company” and, specifically, whether a company can be defi-ned as “innovative” when it initiates product and/or process innovation. Put differently, our inquiry centers around the question of whether inno-vation refers only to the technology embedded in products/services (un-der a traditional interpretation) or can it be consi(un-dered as a new way of developing different improvement activities across all corporate processes and functions, such as: selling and marketing with original marketing tech-niques; developing a new business model without necessarily changing the typical characteristics of the product; or adjusting the organization to improve efficiency at a global level, etc.
Moreover, the metrics used for a quantitative determination of a com-pany’s innovation rate is another important issue. Some generally accep-ted indicators are Research and Development (hereinafter, “R&D”) costs, a firm’s ability to register patents, trademarks and produce know-how, as well as other indicators created from time to time in specific cases.
A further topic is the relationship between innovation and sector: i.e., can innovation be measured by the same indicators in different industri-es? In other words, is the distinction between high-tech sectors (such as pharmaceutical, biotechnological, IT, mechanical, automation, domotics, electronics, chemicals) and other sectors a preliminary and/or necessary analytical condition? There is a universal definition for company perfor-mance: actual vs. expected results. The solutions for methodologies used to calculate performance are more controversial: along with traditional ac-counting indicators, such as the various indexes, many have measured a company’s performance by its market value or by using proxy variables, i.e., indicators of the company’s value growth.
The goal of this research was to increase our understanding of business innovation through empirical research by examining a group of Italian li-sted companies using innovation and performance indicators as further described below.
Given this premise, the goal of our work was to find a relationship between business innovation (expressed as number of patents registered) and financial results achieved (expressed in terms of turnover and ROI). The statistical research report was performed over a long enough period to cover the global financial crisis (2008-2012). Performance analysis was thus used to understand whether innovative companies have better results than non-innovative companies during an financial crisis.
With reference to structure, paragraph 2 analyzes the domestic and in-ternational literature; paragraph 3 spells out our overall objective as stated above, through three hypotheses-research questions; paragraph 4 descri-bes our research methodology; paragraph 5 presents results and related commentary; the final paragraph presents a summary of our conclusions and some consideration about directions for future research.
2. Literature review
The literature demonstrates significant evidence of the foregoing. We have thus undertaken a short, non-exhaustive survey of the international and domestic literature in order to highlight the most significant issues in theoretical and applied research. The relationship between innovation and performance has been the subject of several investigations in the interna-tional literature with different (sometimes contradictory) results, depen-ding on which of the various measures of innovation and performance are used. Such studies arise from various disciplines in terms of content and methodological approach.
Table 1, below, sets forth main contentions of the authors we reviewed with respect to the relationship between innovation (patents and/or R&D), and performance.
In most cases there is a positive relationship between innovation and performance albeit with different methodological determinations and si-gnificant variations across countries and sectors. The available application studies have found no significant relationship between the two terms, in some cases, even identifying a negative relationship.
Tab. 1: relationship between innovation and performance: the authors’ positions positive relationship
Brenner and Rushton (1989)
Sougiannis (1994)
Roberts (1999)
Martin and Mykytyn (2009) (1999)
Ernst (2001)
Cho and Pucik (2005)
Liang and Yan (2006)
Xu and Tang (2010)
Zhu and Huang (2012)
Dave et al. (2013)
negative relationship
Lantz and Sahut (2005)
unclear relationship
Artz et al. (2010)
Sohn et al. (2010)
Hsu et al. (2013)
Source: our processing
Artz et al. (2010) investigate the impact of R&D expenses on product innovation and the number of registered patents, as well as on the rela-tionship between these items and performance. The analysis shows a nega-tive relationship between patents and profitability – measured with ROA: return-on-assets (net profit/total assets) – as well as a negative relationship between patents and sales growth. The authors conclude that a positive re-lationship exists in only a limited number of sectors and larger companies (and not at all for SMEs). Specifically, they confirm a positive relationship between R&D costs and firm size and between the latter and the number of registered patents: firm size was also positively related to sales growth, although not to ROA.
A negative relationship between profitability and R&D intensity (R&D/ sales) is also found by Lantz and Sahut (2005). The authors show that most innovative companies record double risk indexes on average and, conver-sely, almost half the profitability with respect to companies with lower R&D in investments.
Last, Sohn et al. (2010) analyzed the effects of R&D costs and patents on the performance of Korean high-tech companies, with partially contradic-tory results. The analysis shows that R&D is positively correlated to sales growth, but leads to no significant profitability increase.
As mentioned above, a relevant number of studies identify – albeit with some weaknesses – a positive relationship between innovation and perfor-mance, using different interpretations in both concept and metrics.
The study performed by Roberts (1999) on the pharma sector in the Uni-ted States validates the hypothesis that a high innovation rate contributes to higher income, with respect to the average value of the sector, measured in terms of ROA (calculated as indicated above). Cho and Pucik (2005) con-firm that company innovativeness is directly related to growth and profi-tability. The positive relationship between patents and sales is confirmed by Ernst (2001).
Martin and Mykytyn (2009) investigate a specific patent category registe-red at the USPTO (US Patent and Trademark Office), comparing profitability of higher-ranking companies – in terms of number of registered patents – with their major competitors. The analysis begins from the year of registra-tion of the patent and extends for 3 years thereafter, confirming the hypo-thesis that, at least at average profitability level, these companies’ recorded ROA trends higher than average. However, no strong evidence for the other three profitability indicators (ROS = Net Profit/Sales; OI/A = Operating In-come/Total Assets and OI/S = Operating Income/Sales) was found.
Dave et al. (2013) studied the IT companies in the S&P 500, investigating the impact of R&D costs on performance and confirming a positive rela-tionship between innovation and performance (sales and ROA).
Zhu and Huang (2012) investigated Chinese IT listed companies and analysed the relationship between R&D intensity and ROA with a 1-year lag; they identified a positive relationship between the two variables for 2007-2009. Brenner and Rushton (1989) found a positive relationship between R&D costs and sales growth, as well as a positive relationship between R&D costs and net profit in Sougiannis (1994). Specifically as re-lates to Chinese companies, Liang and Yan (2006) identified a positive rela-tionship between R&D and ROA (1- and 2-year lag) for 2001-2003. Xu and Tang (2010) analysed a sample of Chinese listed companies in 2002-2006, and also confirmed a positive relationship.
Finally, Hsu et al. (2013) studied a sample of Taiwanese high-tech com-panies from 2000 to 2011, and found that the higher the R&D costs and the number of patents, the greater the positive effect on sales and market quo-tation, although with time delay. The study showed a negative relationship for Operating Income because, in many instances, R&D costs are included in the Income Statement for the year in which they arose, thus negatively affecting Operating Income.
There are still questions about the effects of innovation on performance during an financial crisis. It is not clear whether innovative companies also have higher results during a crisis, and whether innovation can be a useful tool in the face of a recession.
As we explained above (see paragraph 1), the performance analysis is applied to understand whether innovative companies have better results than non-innovative companies during an financial crisis.
Table 2 below plots the main positions of the authors we examined who studied the possible effects of the global financial crisis with respect to the relationship between innovation/performance.
Tab. 2: relationship between innovation and performance during crisis. Authors’ positions positive relationship
Antonioli (2010)
Horta et al. (2012)
Geroski and Machin (2013)
Madrid-Gujarro (2013)
Bong Choi and Williams (2013)
Makkonen et al. (2014)
unclear relationship
Xin (2008)
Source: our processing
The relationship between innovation and performance is controversial: on the one hand, changes may generate uncertainties and risks, which are exacerbated by the crisis (Xin et al., 2008). On the other hand, changes can favour flexibility and a company’s capacity to adapt to its environment and introduce technological innovations (Geroski and Machin, 2013). In particular, Madrid-Guijarro et al. (2013) identified a positive relationship between innovation and performance for Spanish SMEs, highlighting the importance of investing in innovation even during a crisis.
Other investigators believe that innovation is an effective strategy to achieve a competitive advantage in times of recession (Makkonen et al., 2014) and could mitigate negative effects (Antonioli et al., 2010). Neverthe-less, performance is strongly conditioned by macro-economic trends and only those companies that maintain a high innovation level for a long time may show increased profitability (Horta et al., 2012).
Bong Choi and Williams (2013) confirmed the importance of innovation in companies operating in emerging economies. The study highlighted the benefits – in terms of better performance (ROA and sales growth, calcula-ted with 1 year lagged) – of innovation for Korean and Chinese companies. In a study devoted to Latin American companies, Paunov (2012) exami-ned the relationship between innovation/performance/crisis from a diffe-rent perspective. He confirmed that the effects of the crisis largely depend on a company proclivity for innovation and its tendency to interrupt the innovation processes.
A review of the literature shows that research does exist on the rela-tionship between innovation and business performance. There are few stu-dies of the issue if one examines SMEs; similarly, works that investigate the effects of the financial crisis on innovative investments and subsequent financial results are also scarce.
Hanel (2006) showed that European SMEs are less inclined to register patents compared to larger companies. Arundel (2001) found that firms of all sizes consider secrecy to be a more effective means of appropriation than patents, but that small business value secrecy more than large firms; this is presumably due to their lack of financial resources needed to protect their patents from infringement. Thus, the SME’s behaviour makes it dif-ficult to detect find innovation, especially if the markers used are patents. 3. Hypotheses and goals
The purpose of this analysis is to investigate the relationship between innovation and performance, in light of the financial crisis in Europe and thus also in Italy.
Given the conclusions of the last paragraph, we decided to consider only listed companies, working with the assumption that they are the com-panies who are most inclined to patent their innovations; this assumption has also been adopted by Dave et al. (2013) in his study.
The following hypotheses were examined:
h1: a positive relationship between the number of registered patents and
the sales variation;
h2: a positive relationship between the number of registered patents and
Return On Investment (ROI);
h3: a positive relationship between the number of registered patents, the
performance and the financial crisis of 2008-2012.
Based on these hypotheses we believe that the following objectives can be achieved:
1. confirmation of a relationship between the number of patents regi-stered by the surveyed companies and their financial performance (sales variation and ROI);
2. confirmation of a relationship between the number of patents registe-red by the surveyed companies and the effect of the financial crisis.
4. Methodology
This survey addresses the issues relating to the observed variables’ me-trics: innovation and performance parameters, examined companies, and time periods of the analysis.
4.1 The innovation and performance parameters
The number of patents registered by a company in a specific time period is used as an index for innovation. This was determined after an in-depth study of the numerous alternatives, as well of the above-referenced litera-ture survey.
While no generally accepted parameters exist to measure innovation, we note that the two metrics used most often are R&D costs and the num-ber of registered patents (Danguy et al., 2014).
During review of the metrics, we identified more critical aspects in R&D costs and ultimately decided to use the patent parameter for the fol-lowing reasons.
First, patents are generally used as indicators in evaluating a company’s innovative activities in the sense of new technologies, new processes, and new products (Acs and Audretsch, 1990; Aspden, 1983; Bresman et al., 2010; Napolitano and Sirilli, 1990; Danguy et al., 2014). In some studies, the number of registered patents and the number of reported patents correlate positively with performance (Hagedoorn and Cloodt, 2003; Stuart, 2000), but not always (Rosenkopf and Nerkar, 2001). However, even investigators who are critical of the use of patents as product indicators – Arundel and Kabla (1998) and Mansfield (1986) – recognize that patents can be an ap-propriate indicator for numerous high-tech sectors.
Many studies use R&D costs as input indicators or patents as output indicators (Pianta and Vaona, 2007). R&D costs are certainly a natural pa-rameter with which to measure innovation. It is no coincidence that they are used in many studies as a direct variable affecting the innovation rate (Lichtenberg and Siegel, 1991; Hall and Mairesse, 1995, Mairesse and Mohnen, 2005; Marsili and Salter, 2006; Parisi et al. 2006). Nevertheless, using R&D costs correctly is not easy, given that accounting procedures may differ from one company to another and, especially, from one country to another according to the accounting principles followed by various ac-counting systems.
We decided not to use R&D costs as innovation parameters for the fol-lowing reasons:
- there is no clear definition of R&D costs in accounting systems based on cost classification “by nature” (tacitly including “allocation” of purchases of goods and services, work activities, etc., in the scope of
the investigation). Clearly, therefore, companies operating in diffe-rent sectors and located in diffediffe-rent countries may classify the same kinds of costs differently;
- R&D costs can be allocated in an Income Statement as operating costs or, conversely, they can be capitalized and included as intangible as-sets in the Financial Statement (with subsequent depreciation). Such a lack of procedural uniformity has been partially ameliorated by large-scale adoption of the IAS/IFRS international accounting prin-ciples, although numerous differences still exist in the accounting processes across different countries and activity sectors;
- many companies do not exhaustively represent actual R&D costs in their Financial Statements; as a result, this figure is not easy traceable. For investigations using the information collected in the most popu-lar international databases, a serious risk thus exists that no specific indicator for such an item will be found (in compiling a database this means also entering a null value when R&D expenses have accrued but are not accounted for in the Financial Statement).
For these reason we have chosen a more objective innovation parameter, at least in terms of measurement, represented by the number of patents registered in the reference period.
While recognizing the natural functional relation between the two terms, many studies have shown that a company with a high number of registered patents is not necessarily an innovative one (Danguy et al., 2014; Mazzucato and Tancioni, 2012).
On the other hand, many companies patent minor modifications to a product/process (even in the absence of real innovation) merely for de-fensive purposes to protect themselves from competitors. In the IT sector especially, so-called patent-troll companies specialize in patenting without the slightest intent of producing the goods/services set forth in the patent, with the mere speculative purpose of legally attacking the sector’s main stakeholders.
Moreover, the number of registrations is also a function of the procedu-res adopted for new patent grants by the main world agencies (EPO (Euro-pean Patent Office); USPTO (US Patent and Trademark Office)). Therefore, in countries with less restrictive procedures both the number of registered patents and the innovation indicator would be affected.
In light of the foregoing, despite the methodological limitations of using the number of registered patents as an innovation indicator, we believe it to be the best choice among available options.
With reference to performance measures, we used profitability indica-tors inferred from the Financial Statement, specifically the sales variation and ROI (Return on Investment) as the ratio between Operating Income and Total Assets.
We’ve provided a brief description of the characteristics of these indica-tors to illustrate their significance.
Accounting indicators are largely used in specialized studies, as con-firmed by the literature. Therefore, our investigation follows well-settled international studies on performance indicators (Hart and Ahuja, 1996; Mokhtar et al., 2005; Hunton et al., 2003).
The sales indicator is a “pure value” that is unaffected by the distortions caused by opportunistic accounting policies. Moreover, some studies em-phasize variations in sales rather than their absolute value, thus presenting a dynamic profile in performance analysis to assess sales growth to inno-vation rate. Following this approach, we’ve adopted the variation in an-nual sales and relate it to an additional dynamic hypothesis consolidated in surveys: a time delay of 1 and 2 years from the patent registration date.
With respect to the other performance indicator, we found Operating Income to be the optimal measure of performance (hence the ROI), to pre-vent financial, extraordinary, and tax-related components from impacting the company’s operating profitability (Ferrero and Dezzani, 1979; Carami-ello, 1993; Teodori, 2008; Sostero et al., 2014). Nevertheless, a company’s accounting policy selection impacts this configuration, as well as, especial-ly, the estimates (depreciations, accruals, and stocks) made by Financial Statement preparers. We chose the configuration of total assets as the de-nominator, as it is essentially a neutral parameter. Unfortunately, it inclu-des investments unrelated to operating investments, that were not easy to extract based on the available data.
4.2 Examined companies
Our base hypothesis is that the number of registered patents is a signi-ficant indicator of company innovation and that the latter has positive ef-fects on performance (albeit with time delay). The general hypothesis that there is a direct relationship between the variables seems confirmed by the international literature, at least at a methodological level.
We verified the existence of patents through the corresponding Euro-pean database, following Martin & Mykytyn (2009) (as noted in section 2, they used the USPTO – US Patent and Trademark Office).
We extracted a list of Italian listed companies that successfully registe-red patents during the relevant period – between 2004 and 2010 – from the EPO (PATSTAT) database.
This list was then used to identify the same companies in the OSIRIS da-tabase containing the annual Consolidated Financial Statements of Italian listed companies. Our reference period was 2005-2012 for the reasons we explain below.
except for a few cases in which they were not legally requirement and so individual Financial Statements were used. This led us to exclude a con-siderable number of companies for two main causes: absence of Financial Statements for the period (i.e., some years were missing) and cessation, merger, or transformation of some companies during the period.
This preliminary data crossing yielded 63 companies. This number re-presents our survey population: listed companies with Consolidated Fi-nancial Statements that registered patents in 2004-2010, according to the EPO database.
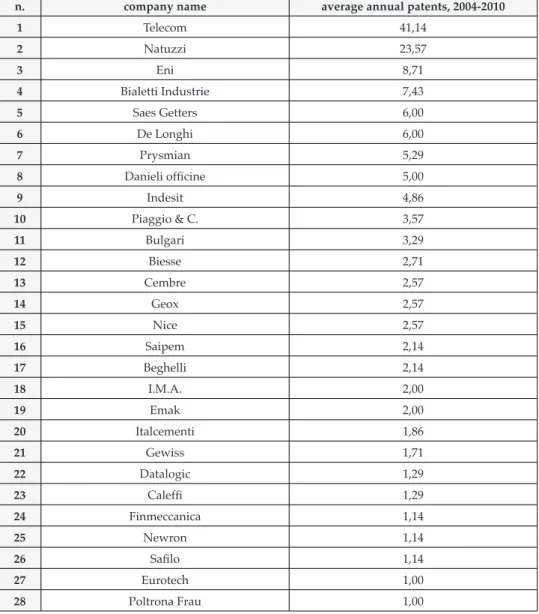
Tab. 3: subject company grouping
n. company name average annual patents, 2004-2010
1 Telecom 41,14 2 Natuzzi 23,57 3 Eni 8,71 4 Bialetti Industrie 7,43 5 Saes Getters 6,00 6 De Longhi 6,00 7 Prysmian 5,29 8 Danieli officine 5,00 9 Indesit 4,86 10 Piaggio & C. 3,57 11 Bulgari 3,29 12 Biesse 2,71 13 Cembre 2,57 14 Geox 2,57 15 Nice 2,57 16 Saipem 2,14 17 Beghelli 2,14 18 I.M.A. 2,00 19 Emak 2,00 20 Italcementi 1,86 21 Gewiss 1,71 22 Datalogic 1,29 23 Caleffi 1,29 24 Finmeccanica 1,14 25 Newron 1,14 26 Safilo 1,14 27 Eurotech 1,00 28 Poltrona Frau 1,00
29 Bioxell/Cosmo 0,71 30 Isagro 0,57 31 Ansaldo STS 0,57 32 Molecular 0,57 33 Prima Industria 0,43 34 GiorgioFedon 0,43 35 El.En. 0,43 36 Gentium 0,43 37 Gefran 0,43 38 Cobra 0,43 39 Pininfarina 0,29 40 Brembo 0,29 41 Dada 0,29 42 Trevi 0,29 43 Carraro 0,29 44 Elica 0,29 45 Bolzoni 0,29 46 Acta 0,29 47 Screen Service 0,29 48 B&C Speakers 0,29 49 Recordati 0,14 50 Montefibre 0,14 51 VincenzoZucchi 0,14 52 Sabaf 0,14 53 Pirelli & C. 0,14 54 Edison 0,14 55 Hera 0,14 56 Socotherm 0,14 57 Save 0,14 58 Zignago 0,14 59 Landi Renzo 0,14 60 Diasorin 0,14 61 Tesmec 0,14 62 Manuli Rubber 0,14 63 Permasteelisa 0,14
As indicated in the previous paragraph, we extracted the accounting data to populate the sales variations and the Financial Statement index.
The list of companies resulting from cross-referencing the two databases is positively characterized by data reliability, although it is not particularly large. Public agencies publish the number of patents and we extracted the accounting data from audited Financial Statements.
Evidently, the analysed population is not fully representative. It is small and limited to listed companies, a fact which could diminish its significan-ce. It might have been better to include all companies, even unlisted ones, starting from a turnover class to test the study’s hypotheses for (almost) all companies included in the patent database. On the other hand, such a decision would have been hindered by the lower quality accounting data (given that Financial Statements are not always audited).
A second limitation is the fact that all the companies are Italian, althou-gh most studies included in our literature survey followed the same in-vestigation path (with just a few cases of international comparisons). The third limitation is that the companies operate in the most diverse industri-es, and the intrinsic innovation rate of some industries is inherently higher than others. We eliminated companies in the financial sector (banking, bro-kerage, insurance, etc.) to avoid distortions. Therefore, the companies we surveyed are mainly manufacturing and non-financial services firms. 4.3 Analysis time periods
The hypotheses/objectives of the investigation also include the rela-tionship between innovation and performance in a specific period of time, i.e., a geographically extended financial crisis (hypothesis h3, objective 2).
The following criteria were used to determine the reference period se-lection. Based on the assumption – to be proven – that patents have a de-layed effect on performance (both the literature and empirical tests would seem to agree on this), we decided to analyse the economic-financial per-formance of innovations contained in the previous 2 years of patents.
We started from the OSIRIS database’s most recent Financial Statements – 2012 – when the effects of the financial crisis that “hit” Italy in 2008 were still severe. Then, working backwards, we isolated a lengthy period before the financial crisis, from 2005 to 2008; the effects of the crisis were presu-mably delayed (the last months of 2008 Financial Statements include the negative events); finally, the period of the crisis itself (from 2009 to 2012).
Examining two types of time delay, we analysed innovation and perfor-mance in two blocks of time considered significant in terms of trends.
Before the crisis (from 2005 to 2008):
- the number of patents in 2004-2007 with sales variations and ROI in 2005-2008 (1-year delay);
- the number of patents in 2004-2006 with sales variations and ROI in 2006-2008 (2-year delay).
- During the crisis (from 2009 to 2012): the number of patents in 2008-2010 with sales variations and ROI in 2009-2011 (1-year delay); - the number of patents in 2007-2010 with sales variations and ROI in
2009-2012 (2-year delay). 5. Data analysis and initial results
The analysis is organized as follows: a universal section on the patent and sales trend with respect to population and time periods; comments on patent ranking-sales variation crossing for the entire time period (with 1 and 2-year delay) and for the time before and during the crisis; comments on the patent-ROI rankings crossing calculated for the whole time period (with 1 and 2-year delays) and for the periods before and during the crisis. 5.1 The patent trend
We took 2009 as the separation year between the time before the cri-sis (throughout 2008) and the period that saw its initial effects. Because of this, we presented the two periods separately to highlight any variations in performance. The columns of Table 4 were constructed in light of this criterion, and the main indicators of the descriptive statistics have been calculated for each row. The trend of the number of patents shows a consi-derable general decrease in the selected periods.
Tab. 4: registered patents
1-year delay 2-year delay
before crisis during crisis before crisis during crisis 2004-2007 2008-2010 2004-2006 2007-2010 Average 3.79 0.69 4.47 0.96 Minimum value 0.00 0.00 0.00 0.00 Maximum value 71.00 18.00 91.67 19.50 Median 1.00 0.00 1.00 0.25 Variance 93.84 5.50 148.42 6.62 Standard deviation 9.69 2.34 12.18 2.57 Source: our processing
The companies drastically reduced the number of registered patents. The reduction in the average number of patents and in the range, i.e. the distance between the minimum value and the maximum value, were recorded
toge-ther with a corresponding reduction of the standard deviation. This means that the values approach the average, which has dropped significantly. The-refore, the phenomenon affects the entire population uniformly.
This may be because of the companies’ reduced appetite for investing in innovation and/or on decreased interest in patenting the innovations they produce; however, should the second explanation prevail (fewer patents), companies could still continue their R&D activities, like investments, which do not result in patent registration.
5.2 Sales trend
Table 5 shows the sales variation trend as recorded in the periods before and during the crisis, taking into account the performance indicators’ 1- and 2-year delay.
Tab. 5: sales Variations
1-year delay 2-year delay
before crisis during crisis before crisis during crisis var. % 2005-2008 2009-2011 2006-2008 2009-2012 Average 0.44 0.12 0.31 0.19 Minimum value - 0.10 - 0.51 - 0.09 - 0.20 Maximum value 14.32 6.47 4.33 5.85 Median 0.12 0.01 0.14 0.08 Variance 3.39 0.69 0.51 0.56 Standard deviation 1.84 0.83 0.71 0.75 Source: our processing
In light of the results for patents and sales variations, and taking into account the distinction between the two periods before and during the cri-sis, a corresponding trend emerges: the reduction in the number of patents, on one hand, and the reduction of the sales variations, on the other hand. 5.3 Patent numbers and sales variations ranking throughout entire period
To achieve a more in-depth analysis the two variables – average number of patents and sales variations – were correlated to identify converging trends in the population in addition to average values.
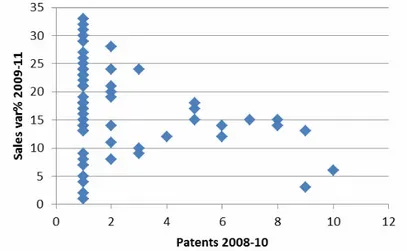
The analysis used the ranking calculation represented by a dispersion chart. The 63 population companies were listed by increasing number of registered patents and sales variations to combine each of them with two ranking values. Figures 1 and 2 show the ranking values for the individual
companies, respectively with 1- and 2-year delay. The 63 points of the chart represent the companies; their position in the Cartesian diagram depends on the intersection of the patent ranking (X axis) with the sales variations ranking (Y axis). Each point describes the position of the individual com-pany in the two rankings in increasing order (the “patent/sales variation” ranking increases as the “patent/sales variation” average value increases).
Fig. 1: patents and sales variation ranking (1-year delay)
Source: our processing
Fig. 2: patents and sales variation ranking (2-year delay)
Source: our processing
The diffused dispersion prevents identification of a univocal trend tra-ceable with a straight line to identify a possible relationship. Nevertheless, upon closer observation, some considerations emerge.
The first is the similarity of the two figures, demonstrating that a 1 or 2-year delay does not make a material difference for the analysis of the re-lationship between patents and sales variations for the sample population. The dispersion of points represented by the chart is very diffused. It occupies the majority of the quadrant and does not follow a precise trend. In order to simplify the analysis, we divided the population into two main groups. The first is positioned on the left side of the diagram and is composed of 35 companies with a low number of patents (conventionally ranking up to 5 on the X-axis) and very different positions in the sales variations ranking (ranking from 1 to 63 on the Y-axis). Although they re-gister few patents, these companies record very different sales variations, which are very high in some cases. For these companies, the innovation level, at least the one expressed as number of patents, has no significant impact on sales trend. The position of the remaining 28 companies is ra-ther diffused and does not follow a precise trend. Moreover, the absence of points in the top right quadrant demonstrates the impossibility of ve-rifying high sales variations in case of high patent rankings (except in 3 cases). Moreover, this demonstrates the absence of a positive relationship between innovation and sales variation, contrary to the results reported by a major portion of the literature on this point (Sohn et al., 2010; Dave et al., 2013; Hsu et al., 2013).
5.4 The patent number and sales variations ranking before and during the crisis As mentioned earlier, we address the relationship between patents and sales by dividing the total period in half, in order to test whether the finan-cial crisis affected the relationship between the two variables1.
Some differences become apparent upon comparing the shape of the two dispersions (Figs. 3 and 4). First, there is greater diffusion of points contained in Fig. 3 for the period before the crisis compared with Fig. 4, which shows a higher vertical alignment of the points and a reduction in the breadth of the patent ranking from 23 to 10 positions.
It is notable that (by number of registered patents) there are more com-panies during the crisis in the ranking’s highest positions (Fig. 4). This is already the situation in Figs. 1 and 2 for the entire period, but to a greater extent: the first 34 companies of the first 5 rankings in Fig. 3 (these are not visible in Fig. 2 because they refer to overlapped points that correspond to patent ranking 2 and 3) become 55 in Fig. 4 (14 points are not visible in Fig. 4 because they refer to coinciding coordinate values with patent ranking
1 For brevity’s sake, we included only those charts showing a 1- year delay between patent re-gistration and sales. The figures we obtained with a 2-year delay do not evidence any material differences.
equal to 1). This means that, with the advent of the crisis a significant por-tion of populapor-tion moved to the chart’s left, occupying the ranking’s first three positions (and especially the first); this demonstrates, once again, that companies manifest lower patent activity before or during a crisis. These companies also showed a variable sales level, just as for the total period.
Fig. 3: patents and sales variation ranking before the crisis (1-year delay)
Source: our processing
It is clear that the number of companies in subsequent rankings is consi-derably lower. In addition, in this case, we cannot confirm the positive re-lationship between the two variables (a higher number of patents does not result in higher sales variations). Therefore, the theories of several scholars who consider innovation to be a valid tool to address the crisis cannot be confirmed (Geroski and Machin, 2013; Madrid-Guijarro et al., 2013; Makko-nen et al., 2014; Antonioli et al., 2010).
Source: our processing
Moreover, the companies that achieved positive sales variations during the crisis in spite of the low number of registered patents would seem to controvert Horta’s (2012) hypothesis, according to which only companies that can maintain a high innovation level can achieve better results. A com-pany’s performance cannot but suffer, along with general economic trends (Bong Choi and Williams, 2013). As already mentioned by Paunov (2012) and as confirmed in this survey, when the crisis approached, many compa-nies stopped registering patents, presumably interrupting any innovation processes in progress. This is potentially one of the most feared effects of a crisis in terms of impact on performance in the medium and long term. 5.5 The ROI trend
Table 6 shows the ROI trend for the periods before and during the crisis. The analysis assumes a 1- and 2-year performance indicator delay.
Tab. 6: the ROI
1-year delay 2-year delay before crisis during crisis before crisis during crisis % 2005-2008 2009-2011 2006-2008 2009-2012 Average 0.06 0.04 0.06 0.04 Minimum value - 0.52 - 0.39 - 0.60 - 0.45 Maximum value 0.41 0.33 0.39 0.31 Median 0.07 0.04 0.08 0.04 Variance 0.02 0.01 0.03 0.01 Standard deviation 0.15 0.11 0.16 0.11 Source: our processing
The ROI trend shows a decrease that is sufficiently in line with the re-duction in the average number of patents for the entire period. The ROI
shows an essentially constant trend, suggesting that the reduction in the average affects the entire population uniformly.
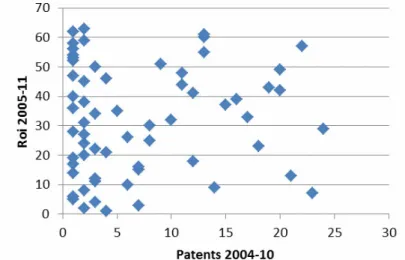
5.6 The patent number and ROI ranking throughout the entire period
As with the previous variable, to arrive at the ROI we calculated the company ranking together with each companies’ position in number of patents. The results show a ranking from the least to the most innovati-ve company and from lowest to highest ROI. More specifically, the values used to construct the ranking are the patents and the ROI averages in the misaligned time intervals. Each point on the dispersion charts represents a pair of rankings that describes the position of the individual company in the two rankings in ascending order (the average patent/ROI number increases with the patent/ROI ranking). Figs. 5 and 6 show that no simila-rity (i.e., uniform trends) exists for the entire population between the ROI ranking and the patent ranking. One of the companies with a lowest num-ber of patents (with x-axis ranking of 2) has a very high ROI value calcula-ted with a 1-year and 2-year delay (y-axis ranking of 63).
The diffused dispersion prevents the identification of a univocal trend traced with a straight line to identify a possible relation.
The first significant aspect is the two figures’ similarity. This demon-strates that, for the relationship between patents and ROI for the sample population, a 1- or 2-year delay does not make a material difference.
Fig. 5: patents and ROI ranking (1-year delay)
Fig. 6: patents and sales variation ranking (2-year delay)
Source: our processing
The dispersion of the points as seen in the chart can be interpreted by dividing the population in two main groups of companies. The companies with modest patent activity in the left side of the diagram (with patent ranking up to 5) occupy very different positions in the ROI ranking (from lowest to highest values).
In some cases, a small number of patents are combined with high ROI values, completely refuting the hypothesis of positive relationship betwe-en the two variables.
This is subject to a two-fold interpretation: companies in a high ROI value sector and a very low average patent number are characterized by in-novation that produces few patents; or, at the opposite extreme, the level of originality of a single patent is such that it drives exponential development of activities and profitability.
In any event, we noted the absence of a positive correlation between the high number of patents and ROI in the first group.
The results are not in contradiction with the findings of those who found a negative relationship between both patents and ROA – return on assets – and sales growth (Artz et al., 2010). Others (Lantz and Sahut, 2005) found a negative relationship between R&D investments, on the one hand, and net income, return and risk, on the other hand, showing in some cases the difficulties related to change-generated uncertainties (Xin et al., 2008). No converging trends emerge with respect to the companies with a higher patent activity (ranking higher than 5).
The dispersion of companies in the central and right-hand section of the Figures suggests the absence of a relationship between the two variables. In fact, it is not possible to trace an interpolating line to imagine a
conver-gence. For our population, the absence of a convergence indicates that the relationship is not positive as imagined in hypothesis h1, but it is also not
negative, as confirmed by the authors of the aforementioned works and more specific investigations (Artz et al., 2010): their analysis shows a nega-tive relationship between patents and profitability measured by the ROA – Return On Assets, after tax return on total assets.
The authors confirm that a positive relationship can only be found in a limited number of sectors and the size of the company (no positive rela-tionship was found for small firms).
5.6 The patent number and ROI ranking before and during the crisis
For the two “special” time intervals we repeated the calculations with the above assumption, i.e., that it would be useful to assess the ROI trend with 1- and 2-year delay (before and during the crisis).
Figs. 7 and 8 only represent the first survey (1-year delay) since the trends calculated with the 2-year delay show no significant difference that could result in a different interpretation.
Fig. 7: patents and ROI ranking before the crisis (1-year delay)
Source: our processing
In the period immediately before the crisis of Fig. 7, we find 30 compa-nies with a limited patent activity (with average patent ranking up to 5), of 34 existing companies (given 4 overlapped positions), with a high ROI dispersion. We observed some over-crowding in the central area of the ROI ranking for companies with higher patent activity.
X-axis numbering to show that, given the high reduction in the number of patents affecting 52 out of 63 companies (82.5% of the companies with a very low average patent number), there was over-crowding of companies between 0 and 2, rather than between 0 and 5 as in the previous Figures. Our observation with respect to the significant of patents should not be related to ROI reduction, although the latter is high: even the companies with fewer patents than previously show dispersed indexes between high and low ROI values.
The remaining companies that continued to patent during the crisis show equally dispersed ROI.
Fig. 8: patents and ROI ranking during the crisis (1-year delay)
Source: our processing
6. Conclusions and future research
Our analysis of the relationship between patents and performance in a population of Italian listed companies has not shown uniform trends with a clear meaning that would allow us to draw final conclusions on the rela-tionship between the two variables.
The study shows that the relationship between innovation and perfor-mance is quite different regardless of the metric used to measure the per-formance (sales variation and ROI).
The financial crisis and the study of the trends for the two variables separately for the period immediately before and during the crisis do not change the picture. Firstly, the analysis has shown a considerable reduction
in the average number of patents affecting the entire population, with an increasing annual trend when the crisis approached. However, this clear trend traced by the patents was unconfirmed by performance.
Specifically, this analysis of the patent/sales revenue relationship in a population of Italian listed companies has highlighted some trends in the companies’ inclination to innovate and the effects on sales variations du-ring a crisis. The dispersion diagram permitted us to deepen the analysis, graphically showing the relationship between patents and sales variations. As mentioned above, no existence of a relationship between the two varia-bles was found. Accordingly, hypothesis h1 (there is a positive relationship
between the number of patents and the trend of the sales revenues) and objective 1 (to verify the existence and type of relationship between the number of patents registered by the company population and their econo-mic-financial performance) have not been confirmed.
A significant portion of the population has a lower patent activity and achieves very variable sales levels; for these companies – following Artz et al. (2010) – we rule out that innovation can have a significant influence on sales trends.
The analysis of the relationship between patents and ROI in a popula-tion of Italian listed companies has not shown mutual trends and effects. In other words, the propensity toward innovation does not appear to lead to a clearly positive or negative return on operating profitability. Hypothesis h2 (there is a positive relationship between the number of patents and the
return on the invested capital) found no confirmation and objective 1 (to verify the existence and the kind of relationship between the number of pa-tents registered by the company population and their economic-financial performance) was not achieved. This corresponds with the conclusions of Lantz and Sahut’s (2005) and Sohn et al. (2010).
Trend analysis of the variables whose results we compared yielded some unexpected results, namely, a sharp decline of patents and consistent average ROI in the first years of the financial crisis. Hypothesis h3 (there is
a positive relationship between number of patents, performance, and the financial crisis for 2008-2012) was not confirmed and objective 2 (to verify the existence and the kind of relationship between the number of patents registered by the population companies and the effect of the financial cri-sis) was not achieved.
In fact, in our case, the advent of the crisis shifted some companies from the most to the least innovative groupings, and innovation seems to have caused no significant effect.
The results obtained with our group of companies do not allow us to establish a clear and direct relationship between innovation and perfor-mance in times of crisis; we cannot, therefore, confirm the results achieved by some of the research listed above (see Table 2).
To further validate our hypotheses, in addition to grouping companies based on the number of patents, the analysis should consider ranking by industry and company size. Longer periods and larger company popula-tions should be examined in order to process a higher number of data, using additional analytical tools.
Francesca Bartolacci, Università degli Studi di Macerata,
[email protected] Antonella Paolini, Università degli Studi di Macerata,
[email protected] Ermanno Zigiotti, Università degli Studi di Macerata, [email protected]
References
Acs, Z.J., & Audretsch, D.B. (1990). The determinants of small-firm growth in US manufacturing. Applied Economics, 22(2), 143-153.
doi: 10.1080/00036849000000058
Antonioli, D., Mazzanti, M., & Pini, P. (2010). Productivity, innovation strategies and industrial relations in SMEs. Empirical evidence for a local production system in northern Italy.
International Review of Applied Economics, 24(4), 453-482. doi: 10.1080/02692171.2010.483790
Artz, K.W., Norman, P.M., Hatfield, D.E., & Cardinal, L.B. (2010). A Longitudinal Study of the Impact of R&D, Patents, and Product Innovation on Firm Performance. Journal of
Production Innovation Management, 27(5), 725-740. doi: 10.1111/j.1540-5885.2010.00747
Arundel, A. (2001). The relative effectiveness of patents and secrecy for appropriation.
Research Policy, 30(4). 611-624.
doi: 10.1016/S0048-7333(00)00100-1
Arundel, A., & Kabla, I. (1998). What percentage of innovations are patented? Empirical estimates for European firms. Research Policy, 27(2), 127-141. doi: 10.1016/S0048-7333(98)00033-X
Aspden, H. (1983). Patent statistics as a measure of technological vitality. World Patent
Information, 5(3), 170-173. doi: 10.1016/0172-2190(83)90137-0
Birkinshaw, J., Bresman, H., & Nobel, R. (2010). Knowledge transfer in international acquisitions: A retrospective. Journal of International Business Studies, 41(1), 21-26. doi: 10.1057/jibs.2009.71
Bong, Choi, S., & Williams, C. (2013). Innovation and firm performance in Korea and China: a cross-context test of mainstream theories. Technology Analysis & Strategic
Management, 25(4), 423-444. doi: 10.1080/09537325.2013.774346
Brenner, M.S., & Rushton, B.M. (1989). Sales growth and R&D in the chemical industry.
Research Technology Management, 32(2), 8-15. doi: 10.1080/08956308.1989.11670580
Bresman, H., Birkinshaw, J., Nobel, R. (2010). Knowledge transfer in international acquisitions. Journal of International Business Studies, 41(1), 5-20.
Caramiello, C. (1993). Indici di bilancio: strumenti per l’analisi della gestione aziendale. Milano: Giuffrè.
Cho, H., & Pucik, V. (2005). Relationship between innovativeness, quality, growth, profitability and market value. Strategic Management Journal, 26(6), 555–575. doi: 10.1002/smj.461.
Crépon, B., Duguet, E., & Mairesse, J. (1998). Research, innovation and productivity: an econometric analysis at the firm level. Economics of Innovation and New Technology, 7(2), 115-158. doi: 10.1080/10438599800000031
Danguy, J., De Rassenfosse, G., & van Pottelsberghe de la Potterie, B. (2014). On the origins of the worldwide surge in patenting: an industry perspective on the R&D–patent relationship. Industrial & Corporate Change, 23(2), 535-572. doi: 10.1093/icc/dtt042
Dave, P., Wadhwa, V., Aggarwal, S., & Seetharaman, A. (2013). The Impact of Research and Development on the Financial Sustainability of Information Tech- nology (IT) Companies Listed on the S&P 500 Index. Journal of Sustainable De- velopment, 6(11), 122-138. doi:10.5539/jsd.v6n11p122
Ernst, H. (2001). Patent applications and subsequent changes of performance: evidence from time-series cross-section analyses on the firm level. Research Policy, 30(1), 143-157. doi: 10.1016/S0048-7333(99)00098-0
Ferrero, G., & Dezzani, F. (1979). Manuale delle analisi di bilancio. Milano: Giuffrè. Geroski, P., & Machin, S. (2013). Think again. Do innovating firms outperform non-innovators?. Business Strategy Review, 24(2), 82-86. doi: 10.1111/j.1467-8616.2013.00959.
Hagedoorn, J., & Cloodt, M. (2003). Measuring innovative performance: is there an advantage in using multiple indicators? Research Policy, 32 (8), 1365-1379. doi: 10.1016/ S0048-7333(02)00137-3.
in French manufacturing firms. Journal of Econometrics, 65(1), 263- 293. doi: 10.1016/0304-4076(94)01604-X
Hanel, P. (2006). Intellectual Property Rights Business Management Practices: A Survey of the Literature. Technovation, 26, 895-931. doi: 10.1016/j.technovation.2005.12.001
Hart, S.L., & Ahuja, G. (1996). Does it pay to be green? An empirical examination of the relationship between emission reduction and firm performance. Business Strategy and the
Environment. 5(1). 30-37. doi: 10.1002/(SICI)1099- 0836(199603)5:1
Horta, I.M., Camanho, A.M.S., & Moreira da Costa, J. (2012). Performance assessment of construction companies: A study of factors promoting financial soundness and innovation in the industry. International Journal of Production Economics, 137 (1), 84-93. doi: 10.1016/j. ijpe.2012.01.015
Hsu, F-J., Chen, M.-Y., Chen, Yu-C., & Wang, W.-C. (2013). An Empirical Study on the Relationship between R&D and Financial Performance. Journal of Applied Finance & Banking, 3(5), 107-119.
Hunton, J.E., Lippincott, B., & Reck, J.L. (2003). Enterprise resource planning systems: comparing firm performance of adopters and non-adopters. International Journal of
Accounting Information Systems, 4(3), 165-184. doi: 10.1016/S1467-0895(03)00008-3
Lanjouw, J.O., & Schankerman, M. (2004). Patent quality and research produc- tivity: Measuring innovation with multiple indicators. The Economic Journal, 114, 441-465. doi: 10.1111/j.1468-0297.2004.00216.x
Lantz, J.S., & Sahut, J.-M. (2005). R&D Investment and the Financial Performance of Technological Firms. International Journal of Business, 10(3), 251-269.
Liang, L., & Yan, S. (2006). Empirical Research on R&D Expenditure and Its Economic Effect of Listed Companies. Science of Science and Management of S&T, 7, 34-38.
Lichtenberg, F.R., & Siegel, D. (1991). The Impact of R&D Investment on Productivity: New Evidence using Linked R&D-LRD Data. Economic Inquiry, 29(2), 203-228. doi: 10.1111/ j.1465-7295.1991.tb01267.x
Madrid-Guijarro, A., García-Pérez-de-Lema, D., & Van Auke, H. (2013). An Investigation of Spanish SME Innovation during Different Economic Conditions. Journal of Small Business
Management, 51(4), 578-601. doi: 10.1111/jsbm.12004
Mairesse, J., & Mohnen, P. (2005). The Importance of R&D for Innovation: A Reassessment Using French Survey Data. The Journal of Technology Transfer, 30 (1-2), 183-197.
Makkonen, H., Pohjola, M., Olkkonen, R., & Koponen, A. (2014). Dynamic ca- pabilities and firm performance in a financial crisis. Journal of Business Re- search, 67(1), 2707-2719. doi: 10.1016/j.jbusres.2013.03.020
Mansfield, E. (1986). Patents and Innovation: An Empirical Study. Management Science, 32(2), 173-181. doi: 10.1287/mnsc.32.2.173
Marsili, O., & Salter, A. (2006). The dark matter of innovation: design and inno- vative performance in Dutch manufacturing. Technology Analysis & Strategic Management, 18 (5), 515-534. doi: 10.1080/09537320601019628
Martin, N.L., & Mykytyn, P.P. (2009). Evaluating the Financial Performance of Business Method Patent Owners. Information Systems Management, 26(3), 285- 301. doi: 10.1080/10580530903017484
Mazzucato, M., & Tancioni, M. (2012). R&D. patents and stock return volatility. Journal
of Evolutionary Economics, 22(4), 811-832. doi: 10.1007/s00191-012- 0289-x
Mokhtar, M.Z., Karbhari, Y., & Naser, K. (2005). Company Financial Perfor- mance and ISO 9000 Registration: Evidence from Malaysia. Asia Pacific Busi- ness Review, 11(3), 349-367. doi: 10.1080/13602380500068441
Napolitano, G., & Sirilli, G. (1990). The patent system and the exploitation of in- ventions: results of a statistical survey conducted in Italy. Technovation, 10(1), 5- 16. doi: 10.1016/0166-4972(90)90038-L
Parisi, M.L., Schiantarell,. F., & Sembenelli, A. (2006). Productivity, innovation and R&D: micro evidence for Italy. European Economic Review, 50 (8), 2037- 2061. doi: 10.1016/j.
euroecorev.2005.08.002
Paunov, C. (2012). The global crisis and firms’ investments in innovation. Research
Policy, 41(1), 24-35. doi: 10.1016/j.respol.2011.07.007
Petroni, G. (1993). Gli investimenti in ricerca e sviluppo: gli effetti della ricerca industriale nella dinamica dell’impresa. Padova: Cedam.
Pianta, M., & Vaona, A. (2007). Innovation and Productivity. European Indus- tries.
Economics of Innovation and New Technology, 16(7), 485-499. doi: 10.1080/10438590600914569
Roberts, P.W. (1999). Product innovation. product-market competition and per- sistent profitability in the U.S. pharmaceutical industry. Strategic Management Journal. 20(7). 655-670. doi: 10.1002/(SICI)1097-0266(199907)20:73.0.CO;2-P
Rosenkopf, L., & Nerkar, A. (2001). Beyond local search: Boundary-spanning. exploration and impact in the optical disc industry. Strategic Management Journal, 22 (4), 287-306. doi: 10.1002/smj.160
Sohn, D.-W., Hur, W., & Kim, H.J. (2010). Effects of R&D and patents on the financial performance of Korean venture firms. Asian Journal of Technology In- novation, 18(2), 169-185. doi: 10.1080/19761597.2010.9668697
Sostero, U., Ferrarese, P., Mancin, M., & Marcon, C. (2014). L’analisi economico finanziaria dei bilanci. Milano: Giuffrè.
Sougiannis, T. (1994). The accounting based valuation of corporate R&D. The Accounting
Review, 69(1), 44-68.
Stuart, T.E. (2000). Interorganizational alliances and the performance of firms: A study of growth and innovation rates in a high-technology industry. Strategic Management Journal, 21 (8), 791-811. doi: 10.1002/1097-0266(200008)21:8<791::AID-SMJ121>3.0.CO;2-K
Teodori, C. (2008). L’analisi di bilancio. Torino: Giappichelli.
Xin, J.Y. Yeung, A.C.L., Cheng, T.C.E. (2008). Radical innovations in new product development and their financial performance implications: An event study of US manufacturing firms. Operation Management Research. 1(2). 119-128. doi: 10.1007/s12063-009-0017-3
Xu, X., & Tang, Q. (2010). The impact of R&D activities and innovation patents on firm value. A study on Chinese listed companies. R&D Management, 22(4), 20-29.
Zhu, Z., & Huang, F. (2012). The Effect of R&D Investment on Firm’s Financial Performance: Evidence from the Chinese Listed IT Firms. Modern Economy, 3(8), 915-919. doi: 10.4236/me.2012.38114
Abstract
This work analyses the relationship between innovation and performance in a population of Italian listed companies, with special reference to the period before and during the financial crisis. We examine the relationship between the number of patents registered and performance indicator trends, such as turnover and return on invested capital (ROI), with 1- and 2- year delay. Although the results do not identify a precise trend for the entire sample, pattern behaviours emerge: with the approaching crisis, significant reduction in the average number of patents and worse performance were recorded. Nevertheless, with reference to these trends, we did not identify a relationship between the two variables.
Riassunto
Il presente lavoro analizza il rapporto fra innovazione e performance aziendali in una popolazione di società quotate italiane, nel periodo precedente e concomitante la crisi economico-finanziaria. L’analisi ha esaminato le relazioni fra la numerosità dei brevetti registrati e l’andamento di indicatori di performance quali il fatturato e la redditività del capitale investito (ROI), con 1 e 2 anni di ritardo. I risultati ottenuti non individuano una precisa tendenza per l’intera popolazione, tuttavia si rilevano talune regolarità: con l’avvento della crisi il numero dei brevetti tende a diminuire e si registrano performance peggiori. Tuttavia, con riferimento a questi andamenti, non si riscontra una relazione positiva evidente fra la numerosità dei brevetti e gli indicatori di performance.
JEL Classification: M19