Università Politecnica delle Marche
Scuola di Dottorato di Ricerca in Ingegneria dell’Informazione Curriculum in Ingegneria biomedica, elettronica e delle telecomunicazioni
Optofluidic microlasers based on
femtosecond micromachining for
LAB-ON-CHIP technology
Ph.D. Dissertation of:
Paolo Spegni
Advisor:
Prof. Francesco Simoni
Curriculum supervisor:
Prof. Francesco Piazza
Acknowledgements
First and foremost I want to thank my supervisor Francesco Simoni for providing me the opportunity to complete this Ph.D. at Department of Sciences and Engineering of Matter, of Environment and Urban Planning (SIMAU) at the Polytechnic University of Marche. It has been an honour to work in a dynamic and creative group composed by heterogeneous group of students, technicians, researchers and professors. Your hard work and passion has always been an example and an inspiration in this three-year period.
It was a great honour to collaborate with Dott. Luigino Criante and the staff of the FemtoFab laboratory at the Centre for NanoScience and Technology of the Italian Institute of Technology (CNST-IIT) in Milan, where several powerful facilities are present and great guys such as Silvio Bonfadini who realized all the characterized samples and whom a close friendship is growing with.
The final thanks to the COST action MP1205 that allowed me to attend two great and interesting Summer schools, and allowed me to meet visiting students, but also to visit the Institute for Optics and Nanophotonics (IONAS) at the Karlsruhe University of Applied Science in Germany and the Department of Micro and Nanotechnology at the Technological University of Denmark where clever Professors and students have increased the desire for working in science and maintain international friendship.
Abstract
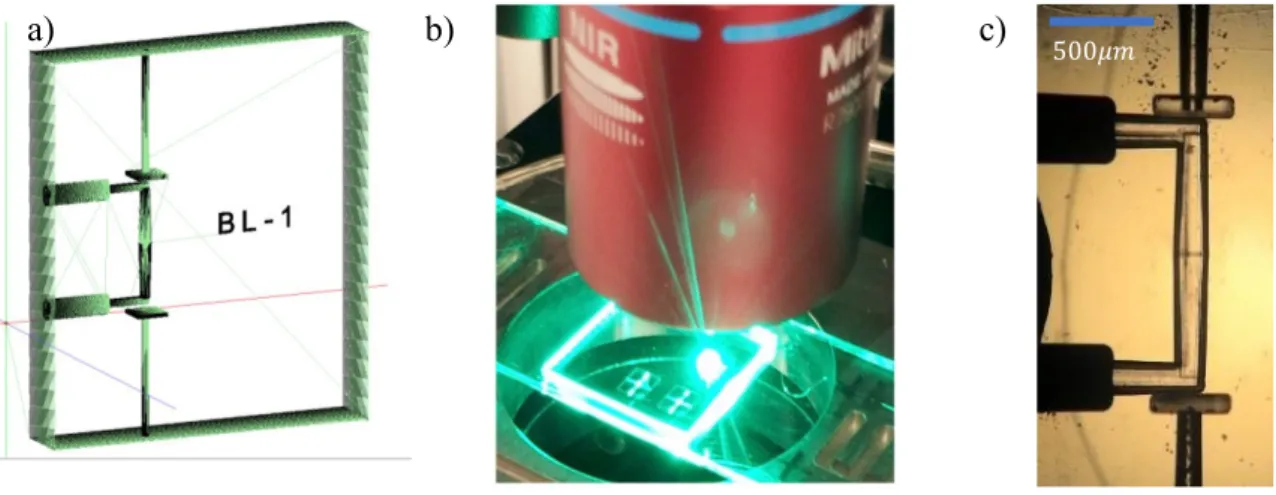
In this thesis work I report the realization and characterization of different optofluidic microlasers based on Fabry-Perot and hemispherical cavity fabricated by exploiting two fabrication techniques: the femtosecond laser micromachining and the inkjet printing technology.
In this way a standard Fabry-Perot cavity has been integrated into an optofluidic chip. The microlasers were tested with different laser dyes such as Rhodamine 6G, Pyrromethene and DCM. The best result was an emission bandwidth below ~0.6 nm and a quality factor 𝑄~ measured when using Rhodamine 6G dissolved in ethanol at concentration of 5mMol as active medium. Laser emission was detected at a threshold energy density as low as .8 𝜇𝐽/𝑚𝑚 about one order of magnitude lower than state-of-the-art optofluidic lasers. These performances and mechanical and chemical robustness of these devices fully embedded in glass make them promising for future development in optofluidic chips to be exploited in biosensing applications.
Contents
Introduction
1
1. Background on lasers:
3
1.1. Laser oscillator ... 4
1.2. Fabry-Perot resonator ... 4
1.3. Output power of laser ... 8
1.4. Optical resonator stability ... 9
1.5. Dye as active media ... 11
2. Fabrication technology in Optofluidics:
14
2.1. Soft lithography ... 142.2. Replicant methods ... 16
2.2.1 Electron-Beam Lithography and Nano Imprinting Lithography (NIL) ... 17
2.3. Femtosecond Laser Micromachining Technology ... 18
3. Design and fabrication of the optofluidic resonators:
24
3.1. Mirror fabrication by Ink-Jet technology ... 243.2. Connection of the samples ... 27
4. Optofluidic microlaser realized by FMT:
28
4.1. Previous works ... 284.2. Our cavity design ... 31
4.2.2 Longitudinal cavity ... 32
4.2.3 Hemispherical cavity design ... 33
4.2.4 Cavity with control channel ... 34
5. Device characterization:
28
5.1. Experimental set-up ... 35 5.2. Results of measurements ... 37 5.2.1. Transversal cavity ... 37 5.2.2. Longitudinal cavity ... 39 5.2.3. Hemispherical cavity ... 435.2.4. Cavity with control channel ... 48
5.2.5. Use of different solvents ... 49
Conclusion
50
References
53
Appendix A
55
Visiting periods spent in other University ... 55Activity at IONAS ... 56
Activity at DTU Nanotech ... 58
Appendix B
62
Publication in international journals ... 631
Introduction
The lab-on-chip technology is growing very quickly because of the wide range applications in the biomedical area and sensing for environment control and security. In this frame, it is a challenge to realize a complete optical lab in a single chip. This chip should contain the optical source (laser), the optical control elements (waveguides, lenses, polarizers, etc.), the sample analysis channels and the light detector. The advantages of developing of such technology will be to get high sensitivity, use of low testing volumes, low cost and device portability. In order to get these results, it is important to develop a suitable microfluidic laser that acts as a light source in this optical lab in a chip.
The first microfluidic laser has been realized at the Technical University of Denmark by Anders Kristensen and coworkers using a transversal Fabry-Perot (F-P) resonator of with a Rhodamine 6G solution in ethanol at concentration of . After this demonstration several different devices were developed using DFB (Distributed Feedback) to get narrow light emission. Fabry-Perot resonators have also been proposed and tested with cavity mirrors coated either on optical fiber surfaces or on the side of microfluidic channels. Most of the proposed microfluidic lasers were fabricated in polymeric materials thus presenting lack robustness and mechanical stability. The motivation of the present work is to overcome these problems realizing an optofluidic laser full embedded in glass chip with state of the art performances.
This work has been carried out in collaboration with the group led by Dott. Luigino Criante at the Center for Nano Science and Technology at Italian Institute of Technology (CNST-IIT). We have designed different cavities in collaboration with the IIT group where devices were fabricated. All the measurements and tests of the characteristics of the devices were performed at the SIMAU Department of the Polytechnic University of Marche.
This presentation is organized as follows. In chapter 1 a background of laser properties has reported according with the main books in the field. Some details are also given on the laser dyes which have been used in this work. In the second chapter the different fabrication techniques for microfluidic chips are described with particular emphasis on
2 the Femtosecond Micromachining technology that has been exploited to fabricated the devices used here. Chapter 3 deal with design and fabrication of our devices describing the different resonator geometries which have been characterized in chapter 4. The chapter 5 reports the experimental details and the results obtained for the different tested devices. After a short conclusion the appendix presents a report of the activities performed during the stages in the group of Prof. Christian Karnutsch at the Institute of Optofluidics and Nanophotonic (IONAS) of the Applied Science University (Karlsruhe, Germany November 2015) and in the group of Prof. Anders Kristensen at the Department of Micro and Nanotechnology (DTU Nanotech) at the Technical University of Denmark (Lyngby, Denmark, August-September 2016 and September 2017). These activities concerned the development of technologies correlated to the main subject of this work and more in general to the area of microfluidic devices. Finally a copy of the published papers is reported.
3
1 Background on lasers
In this chapter the basic concepts describing the laser emission will be summarized. They are important both for a proper design of the laser cavity and to better understand the behaviour of the optofluidic microlasers characterized in this thesis.
The word ‘Lasers' is the acronym for Light Amplification by Stimulated Emission of Radiation. It is an oscillator at optical frequencies realized coupling a positive feedback to an amplifying medium. Many books deal with the physics of lasers, among them I refer to “Principle of Lasers” by O. Svelto and “Optical Electronics” by Amnon Yariv. The light amplification is the consequence of stimulated emission. It is the process occurring when one electron is stimulated by an incident photon to make a downward transition from a high-energy state to a low-energy state. The result is the emission of a photon with the same characteristics of the incident one, that is coherent with it. Coupling this process with the feedback mechanism produced by the optical cavity laser radiation is generated with a high degree of coherence that is shown by the typical collimated monochromatic beam.
The achievement of the amplification condition in the medium requires a population inversion between the two energy levels involved in the process, since under thermal equilibrium the electron population in the low energy state is higher than in the high energy state. Therefore, it is necessary to provide energy to the medium through a pumping mechanism. Different pumping methods are found for different types of active media. The most common are electrical and optical methods. In this work Rhodamine 6G is used as active medium and it is optically pumped with external lasers. More information about Rhodamine 6G and pumping method are given in section 1.5. A basic element of lasers is the optical cavity that provides the positive feedback mechanism necessary to get oscillations. The simplest optical resonator is realized by two highly reflecting flat and parallel mirrors. In this case the light travels orthogonal of them. Photons bounce from and back in the cavity and every time the electromagnetic wave passes through the active medium it increases the intensity. Increasing the pumping energy the population inversion increases until the optical amplification compensates the losses, thus achieving the oscillation condition.
4
1.1 Laser oscillator
The basic scheme of a laser (the electromagnetic oscillator at optical frequency) is depicted in Figure 1.1
The oscillator is made by an active medium located inside an optical resonator. Active medium means: a medium where a population inversion is achieved my providing energy through a pumping mechanism. Under these conditions the material acts as optical amplifier. If a suitable method of feedback is provided, the amplifier may turn into an oscillator. Feedback is given by the optical cavity, that can be simply realized by two parallel flat mirrors (Fabry-Perot cavity). It is useful to recall the basic oscillation conditions for the mentioned Fabry-Perot resonator.
1.2 Fabry-Perot resonator
As already mentioned this oscillator is realized by a couple of flat mirrors with an active medium of length located in between. One mirror is semi-transparent, so that a small part of the incident field can come out from the cavity, while the reflected part traveling through the active medium is amplified. Starting from the incoming field 𝐸𝑖 we
calculate the transmitted electric field 𝐸 considering the multiple reflections and the phase contribution of the active media. Defining as: , and , the beam transmission and reflection coefficients for the field of the two mirrors; −𝑖𝑘′ the propagation factor corresponding to a cavity transit, where ′ is the complex
wavevector that takes into account both gain and losses. Pumping light
Active medium
Optical resonator mirrors
Figure 1.1 - Basic scheme of a laser: gain medium where population inversion take place by a pumping effect, and the optical cavity that allow that the part of the emetted light remain in the cavity
5 The complex constant propagation can be written as:
′ 𝜔 = + χ′ ω
n − 𝑖
𝜒′′ 𝜔
− 𝑖𝛼 .
Where − 𝑖𝛼⁄ is the propagation constant of the medium at frequencies well removed from that of the laser transition in which 𝛼 accounts for the distributed passive losses of the medium and 𝜒 𝜔 = 𝜒′ 𝜔 − 𝑖𝜒′′ 𝜔 is the complex dielectric susceptibility at the
considered resonance [2].
The total outgoing wave is the sum of all the partial waves that come out from the semitransparent mirror after each round trip of the wave in the cavity; looking at Figure 1.2 the transmitted field 𝐸 is easily calculated as:
𝐸 = 𝐸𝑖 −𝑖𝑘′ [ + −𝑖 𝑘′ + −𝑖 𝑘′ + ⋯ ] .
The term inside square brackets is a well-known geometric series, therefore:
𝐸 = 𝐸𝑖[ −𝑖𝑘′ − −𝑖𝑘′ ] = 𝐸𝑖[ −𝑖 𝑘+Δ𝑘 𝛾−𝛼 ⁄ − −𝑖 𝑘+Δ𝑘 𝛾−𝛼 ] . where ′= + Δ + 𝑖 𝛾 + 𝛼 ⁄ with [2] Δ = 𝜒′ 𝜔 .
Figure 1.2- Model used to analyse a laser oscillator. Gain material with inverted atomic population and complex propagation constant k'() located between two reflecting mirrors
6
𝛾 = − 𝜒′′ 𝜔 = −
𝜋 .
Under population inversion > then 𝛾 > the denominator of (1.3) decreases by increasing the power gain |𝐸 𝐸⁄ | . This ratio becomes infinite when the 𝑖 denominator of (1.3) becomes zero:
−𝑖 𝑘+Δ𝑘 𝛾−𝛼 = .
This corresponds to a finite transmitted wave 𝐸 with a zero incicent wave, 𝐸𝑖 = and
represents the case of a wave that, after a round trip, keeps the same amplitude and the same phase excepts for some integral multiple of 𝜋. In fact, from (1.6) we get two separate conditions. From the real part we can take out the gain condition:
𝛾 𝜔 −𝛼 = .
Therefore, the threshold gain is:
𝛾 𝜔 = 𝛼 − ln .
Combining (1.5) and (1.8) it is possible write the population inversion density at threshold:
≡ − = 𝜋 (𝛼 − ln ) .
Where the lineshape represents the a priori probability for a given spontaneous emission with photons whose frequency is ; indicate the spontaneous emission lifetime [1, 2]. The expression (1.9) is also often written in a different form:
= 𝜋 𝜏 .
where 𝜏 is the cavity decay constant which takes into account both the average losses and reflectance of mirrors [2].
7 The physical meaning of this condition is very simple: after each round trip in the cavity gain must compensate the energy losses, thus making possible the stable oscillation of a wave with constant amplitude.
From the imaginary part of (1.6) we get the condition for the phase of the oscillating wave. By neglecting the small correction Δ , we have:
= 𝜋 = , , , … .
Therefore, the wavelength of the oscillating modes must fulfil the condition:
= 𝑤𝑖 ℎ = , , , … .
Then we can write the cavity modes in the frequency domain:
= 𝑤𝑖 ℎ = , , , … .
being n the refractive index of the medium. Therefore the distance between two modes is:
Δ = + − = .
That can be also written in term of wavelength as:
Δλ = 𝜆 . Cavity length [ ] 𝚫 ( ) 2 0.7 700 0.15 1550 0.07
8 In the table below is shown the calculation of this parameter for different cavity lengths in the range of interest for our optofluidic laser, by taking as central emission
wavelength = .
1.3 Output power of laser
The emitted power of laser strongly depends on the energy level structure of the active medium. For our optofluidic system, the active medium is given by a dye solution in ethyl alcohol or other fluids. This laser medium provides a four levels system as depicted in Figure 1.3.
As described above, a threshold population inversion is required for the laser emission. This is achieved by optical pumping. An external light source excite electrons from the ground state 0 to some excited state 3 from where they decay by nonradiative emission to the upper laser level 2, in this way it is possible to get the necessary population inversion between the levels 2 and 1. Due to stimulated or spontaneous emission electrons transit from level 2 to level 1 by emission of a photon with frequency . Finally fast and nonradiative emission from level 1 to the ground state 0 allow keeping negligible population of level 1. As a consequence, the population inversion is Δ =
− ≈
By solving the rate equations for this four-level system is possible to get the emitted power written as [2]
= ( − ) .
9 The equation indicates the total power generate by stimulated emission, when the pumping rate is higher then the threshold pumping rate defined as = 𝜔 ; 𝑆 indicates the power going into spontaneous emission at threshold. The equation 1.16 is plotted in Figure 1.4
It usually represents the signature of the onset of the laser action where the characteristic threshold behaviour is made clear by the sudden change of the slope of the emission power versus R.
The curve shows how the weak linear rise of the emitted power below threshold (spontaneous emission) and a sudden change in the growth of the emitted power as the threshold condition, is reached due to the prevalence of the stimulated emission. The change of the slope is combined with the narrowing of the emitted spectrum in favour of one mode or a reduced set of modes selected by the cavity. As mentioned above, the spontaneous emission process generates photons with any frequency of the characteristic emission spectrum of the material and random phase, while during the stimulated emission, photons are emitted with the same frequency and same phase of the electromagnetic wave that stimulated the transition.
1.4 Optical resonator stability
The oscillation condition has been found for the Fabry-Perot cavity under the approximation of ideal flat and parallel mirrors with an infinite number of reflections of the oscillating field. From a geometrical point of view, this is possible only for a ray travelling in a direction orthogonal to the mirror surface. In facts, any other ray would exit from the cavity after some reflections. From this geometrical point of view, the stability of the cavity can be discussed in a more general way by taking into account Figure 1.4 - Plot of typical output power versus pumping rate.
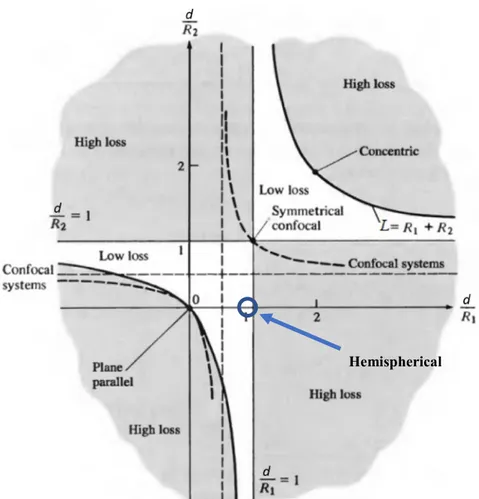
10 both the curvature radius of the mirror surface and the distance between the mirrors. In this way, it is possible to work out a stability condition for optical cavities made by two mirrors with curvature radii and located at a distance . Stability is achieved if the following condition is fulfilled [2]
≤ ( − ) ( − ) ≤ .
The stability condition is presented by the curved plotted in Figure 1.5. The shaded areas indicate the high losses where the stability condition (1.17) is violated and the clear areas are those where it is fulfilled.
It is observed that Fabry-Perot cavity falls on the edge of the stability curve. Use of curved mirror may provide less critical stability conditions.
Hemispherical
11
1.5 Dye as active media
Organic dye molecules solved in different kind of liquids are frequently used as active media for lasers. Dye molecules have a broad emission spectrum that is very interesting to realize tunable lasers. Pumping is usually achieved by optical excitation, often are realized by other laser beams. The laser dye molecules are composed of organic
molecules where alternating single and double carbon bonds form long molecular chains. The results is a complex molecular structure due to the large molecular size, and the chemical bonds that give a very large dipole matrix element . These circumstances lead to many vibrational and rotational levels for each electronic state. Usually light coefficient is found in ultraviolet and visible region. [2, 3]. In Figure 1.6, are reported absorption and emission spectra of four commercial laser dyes, where is it also shown the typical Stokes shift between absorption and emission band. Moreover, absorption and emission spectra are lightly superimposed, this means that the emitted light is lightly self-absorbed by the dye molecules.
Figure 1.7 reports the scheme of the energy levels of a typical dye molecule. The useful four level system is provided by singlet states ( and in Figure 1.7) while the presence of triplet states may affect the working condition by reducing the efficiency of the laser emission. This occurs when energy transfer from singlet to triplet state reduce the population inversion of the singlet states. We will describe the transition process involved in a laser system and the energy levels using the rate-equation model. Figure 1.6 Absorption and emission spectra of some commercial dye laser. The dotted lines represent the absorption spectra and the continuous and filled curves show the emission spectra. Image from Thermo Fischer Scientific web page.
12 Assuming that we can describe the photophysical property of the dye molecules with four-energy levels system shows in Figure 1.7 wherein every electronic state reports a set of vibrational levels (heavy lines) and rotational levels (light lines). and represent the fundamental and the first singlet excited state in which the total spin quantum number is 𝑖 𝑔 = . and are the first and the second excited triplet state with total spin number 𝑖 = . By the selection rules that require Δ = the singlet-triplet transition is forbitten, thus, when molecules are subjected to electromagnetic radiation the dye molecules absorb the pump light rising from the level to one of the vibrational levels. To minimize the system energy, molecules decay in a very short time to the lowest vibrational level of the level. This nonradiative process is in the picosecond time order, 𝜏 ~ − and generates a thermal process
heating the dye and the solution. From there ( molecules decay emitting light by spontaneous or stimulated emission. In both of cases molecules decay to a vibrational level of , and finally returns to the lower level by another nonradiative process. An important condition about the levels involved in the laser process it is far enough from ground level. In this way at thermal equilibrium its population density can be negligible. The photon energy, neglecting the molecular loss that generate the heating process, can be calculated as ℎ = (𝐸𝑆 − 𝐸𝑆 ).
Even if it is a forbitten transition, some electrons in the lowest level of the may decay to the first excited triplet state. These processes, give rise to undesired losses. The
13 emission band is characterized by homogeneous broadening, therefore is suitable for realising tunable laser emission. The large number of available dye molecules allow covering a broad range of emission in the visible depending on the usable pumping wavelengths. One of the most popular dye molecule for this purpose is Rhodamine 6G that we have used to test on our device. In addition to Rhodamine 6G, Pyrromethene 597 and DCM were also used for lasing tests. Usually, as solvent was used ethyl alcohol, but also Cinnamaldehyde and Quinoline was tested.
14
2 Fabrication technology in Optofluidics
The great majority of microfluidic lasers are realized with lithographic techniques, using polymers such as SU-8 or polydimethylsiloxane (PDMS). In particular, the SU-8 allows a flexible and inexpensive realization of devices exploiting the well-known technique of lithography, lamination and the use of sacrificial materials to realize single or multilayer devices. It can also be used to realize a master mould to imprint a microfluidic circuit on PDMS. It is really suitable to realize mould for the high aspect ratio achievable and because PDMS and SU-8 have low mutual adhesion. A high resolution “moulding” technology is Nanoimprinting Lithography that allows to replicate nanometric structure in polymers from a high precision mould, for instance made by electron beam lithography.
These processes are largely used also for multilayer devices, but the developing process require (expensive) masks and fine alignments between layers and masks. On the other hand, it is a challenge to realize a circular channel section, curved walls or variable section aperture. A flexible and innovative technique that allows a mask free, 3D fast microstructure fabrication and other is the Femtosecond Micromachining Technology that will be deeply described in section 2.3.
2.1 Soft lithography
It can be viewed as an evolution of photolithography. Originally, standard photolithography, was developed for semiconductor in the microelectronics industry. In the lasts decades, it was adapted to process a family of polymers called photoresist that interact with light and/or heat to drive, or activate, the polymerization process. This interest was driven by the optical and chemical properties and by the biocompatibility of polymers, that, combined with low cost and high mass-producible devices make them an ideal candidate for mass production of single use biosensors.
One of the most used polymers to realize biochip is PDMS (polydimethylsiloxane). It is liquid at room temperature, polymerize at low temperature ( − °𝐶), it is transparent up to UV light (> ), it has good elasticity (it belongs to elastomer category), biocompatibility and gas permeability. It is also cheap and largely used to realize microfluidic chip for bio-applications. The realization requires to cast a
15 prepolymer mixture of PDMS and its curing agent against a master mold that, for example, can be realized by SU-8, a photopolymer largely used to realize MEMS and NEMS that is characterized by high aspect ratio of the final structures. SU-8 structure on a silicon substrate is a perfect mold since allows the realization of fine structures and the PDMS has low adhesion on them that can be easily peeled off after polymerization. The procedure to realize PDMS samples using a SU-8 master mold is sketched in Figure 2.1. (1) The process starts with the deposition of a layer of photoresist on a substrate (as glass or silicon). Commonly a spin-coater is used to spun the substrate with a controlled speed and uniformly distribute the liquid polymer deposited in the center of its surface. The final thickness depends on the viscosity of the material and the value of the rotation speed. (2) The second step consist in placing a mask made by a transparent material and that includes a fine drawing of the microfluidic structure to be realized. Under this condition the system is irradiated by UV light to active the polymerization process on the areas not covered by the mask. (3) In the other parts, the film keeps be fluid and can be removed by immersion in a solvent. Photoresists are indicated as positive or negative depending on whether or not they are polymerized in the next step after exposure to light. UV exposure is preceded and followed by a baking process that removes solvent and activates cross-link between polymer’s molecules. The sealing process can be achieved by direct or indirect techniques: one of the most common one is bond the PDMS stamps on glass after an oxygen plasma treatment of both surfaces [17].
An alternative way to realize microfluidic devices is the use of standard lithography. Standard lithography it is also used to realize microdevices or sensors with polymers because it allows realizing multilayer devices combining the steps (1), (2), (3) N-times, that can be integrated by using sacrificial material or laminating process to close structures depositing a layer of polymers as represented in Figure 2.1 (B)[4].
The drawbacks of soft lithography are: it realize structures layer by layer limiting the possibility to obtain complex 3D structures (such as circular channels or spherical shape walls); (II) an alignment procedure is necessary between two successive layers; (III) sealing of open structures sometime becomes a critical step in the fabrication process;
16 (IV) the high sensitivity to mechanical stress in polymers, consequence of the elasticity of the materials, can generate structure deformation during its use.
2.2 Replicant methods
Another common fabrication method to realize low-cost and high-volume polymers microfabrication field is the replicant method. This technology requires a master structure; the success and the replicated structure quality depend basically by four parameters: (i) the geometrical accuracy of the master, (ii) the ability to separate mould and moulded part, (iii) the surface roughness of the master (that should be as low as possible), and (iv) a suitable interface chemistry between master and substrate. All the microfabrication methods are available to generate the master structure that represent the crucial part in this fabrication method. Among the many technologies available are: wet (or dry) silicon etching, photoresist, laser ablation & electroforming, and others, the best is the electron beam lithography (EBL) (especially for micro and nanostructure). Figure 2.1 - Soft lithography steps processes that are required to realize PDMS or SU-8 microfluidic devices.
1. Spin coated polymer 2. Mask + UV exposure
(Preceded and followed by baking)
3. Chemical etching
4. Molding with PDMS
5. Sealing in a glass substrate
e.g. photo mask UV light
Channel
A B
Substrate SU-8 Mask PDMS
17
2.2.1 Electron-Beam Lithography and Nano Imprinting Lithography (NIL)
Electron-beam Lithography is a photolithography technology where a focused beam of electrons is scanned across a substrate covered by an electron-sensitive material. It changes the solubility properties of the resist according to the energy dose of the electron-beam. After a developing process, the areas exposed (or not exposed) according with the resist family (positive or negative) are removed and the final drawn structure will appear. The main advantage of EBL is that it is a direct writing process, further no mask is required. Additional to and it is possible draw custom structures with a resolution below [5, 6]. The main limits of EBL are: a low volume production and is the time-consuming process. For these reasons, commonly it is used to realize master molds and samples are fabricated with a replicant method. A sketch of the electron beam systems is shown in Figure 2.2.
EBL masters can be used in NanoImprinting Lithography (NIL), that is an attractive, high throughput, high-resolution and parallel patterning of polymer micro- and nanostructures. A mold that contain a surface pattern is impressed to polymer material by direct mechanical deformation of the resist due to a temperature effect. This process allows to replicate very high resolution, ( feature has been demonstrated) [6]. The NIL requires thermoplastic polymers that can be softened by heating. Basically, the process can be described in the following steps: (i) master mold is mounted in the mold
1. Mold and sample are heated over 𝑔
2. Mold and sample are pressed together
3. Mold and sample are demolded after been cooled down
Figure 2.2 - (a) Typical EBL system consist of a chamber, an electron gun, a culomn including all the electron optics needed to focus, scan and turn on or of the electron beam [16]; (Right) The principal steps to relize a sample by using NIL with hot embossing.[]
18 holder; (ii) a substrate with a thermoplastic polymer layer is located into NIL machine and heated just above the polymer glass temperature 𝑔 ; (iii) the master mold is heated at 𝑔 (or few degree higher); (iv) master and polymer structure are pressed together with several tents of kN (in according with the sample dimension and complexity); (v) Mold and substrate are isothermally cooled down to a temperature few degree below the 𝑔 of the polymer; (vi) mold and sample are separated. New samples can be obtained repeating the process from step (iii).
Critical issues for the success of the replication process are the temperature distribution in mold and sample, the presence of air bubbles during the compression step and the chemical compatibility between the involved materials.
2.3 Femtosecond Laser Micromachining Technology
Femtosecond Laser Micromachining Technology (FMT) represent a different fabrication technique with several advantages over soft lithography, the main are:
• 3D fast fabrication of microstructures inside transparent materials • Maskless and flexible fabrication process;
• Quick prototyping;
• Device robustness and micrometric precision; • No post fabrication processes
It actually consists in writing on the chip substrate the microfluidic circuit with a focused light beam originated by a laser emitting ultrashort pulses in the femtosecond range.
19 During the writing process, ultrashort laser pulses modify both the chemical and physical properties of the material because the high pulse energy activate absorption processes that occur by non-linear processes such as: (a) multiphoton ionization, (b) tunneling and (c) avalanche effect that are schematically depicted in Figure 2.3. This
allows the material interaction with the laser beam in correspondence of the beam focus, where the intensity is enough to active the absorption effects. The irradiated material changes chemical structure of the substrate that became soluble on acid or basic bath (usually hydrofluoric -HF- acid or potassium hydroxide - KOH-). This allows removing selectively the irradiated material with a small and predicable effect on the remaining parts of the substrate, then, reproducing a negative structure with empty microchannel in the correspondence of the irradiated areas. This technique is successful with transparent materials such as fused silica glass and it is still under study when considering different substrates.
Actually, femtosecond pulsed lasers can induce three different modifications in transparent materials, effects that can be controlled by the laser fluence used during the irradiation process. At low fluence (Regime-1) smooth homogeneous structural modification are imprinted in the substrate. Mainly it results as refractive index variation; for instance, the refractive index increase (Δ ~ − ) therefore direct 3D
waveguide can be obtained. For this type of waveguide, the losses are less than 1dB/cm [18]. For higher fluence values (Regime-2) self-ordered nanogratings with average period ~ / and perpendicular to the electric field make a periodic density modulation. This periodic structure is composed on “dark” (low density) and white (high density) regions. In the case reported in Figure 2.4 the width of these structures are ~ and ~ respectively, but they depend on laser parameters such as wavelength, energy dose, pulse width and accumulation rate. In case of high fluence (Regime-3), the focal spot generates high temperature and pressure that produced
Figure 2.3 - Schematics of the nonlinear absorption process: a) multiphoton absorption; b) tunnelling ionization; c) advance ionization [15]
20 internal micro explosions. This produce micro voids surrounded by densified material. The realization of nano voids without the presence of surrounding cracks is due to the ultrashort pulses that ends before the workpiece feels the excitation avoiding thermal effects.
In silica glasses the femtosecond irradiation in the working Regime-2, with moderate fluence, modify the structure by reducing the angle of the bond between silicon (Si) and oxygen (O). This change not only increases the refractive index of the irradiated area but also make it more reactive to acids (or bases) increasing the etching-rate, that become 40 times higher with respect of the not irradiate areas.
A typical system for femtosecond micromachining is reported in Figure 2.5 and consists by a laser source, the laser beam manipulation equipment, the focusing system and the 3D micro positioning of the sample. The micromachining equipment used to realize glass embedded microlasers to the aim of this thesis work use a Pharos laser, (Light Figure 2.4 (Left) Different types of femtosecond laser modification in transparent materials depending on pulse energy, and pulse-width. 1) smooth refractive index increase leading to internal 3D waveguides; Regime-2) periodic arrangement emerging in nanogratings generation; Regime-3) disruptive nanocraks and void formation. (Right) Microscope images of different type of modification in fused silica: a) waveguide [16], b) nanogratings perpendicular to the E field of laser beam [17]; c) array of micro-voids [18]
Figure 2.5 – (Left) Typical femtosecond micromachining set-up [7]; (Right) Main parts of the FemtoFab micromachinig setup showing the laser source, the high harmonic generator and power attenuators. [8]
21 Conversion) where is possible control the pulse duration ( − ), repetition rate ( 𝐻𝑧 − 𝐻𝑧), pulse energy (up to~ . 𝐽) and average power (up to~ 𝑊) [p5]. The high power and ultrashort pulsed-mode relies on the conventional chirped-pulse amplification technique, which is based on: (1) a mode locked oscillator; (2) a stretcher/compressor module; (3) and a cascade regenerative amplifier. Both the oscillator and the regenerative amplifier are based on Yb:KGW lasing medium, emitting in the near-IR ( = ), and laser diodes are used as high-efficiency pumping modules. In particular the Kerr-lens mode-locked oscillator is the core of stable 80fs-pulse generation with a repetition rate of 67MHz. Only a small fraction of the emitted pulse is selected by the BBO electro-optic Pockels cell and seeded into the amplifier cavity (1MHz maximum repetition rate). Before this step, the pulse must be temporally stretched (in order to avoid pules distortion passing through the cascade laser cavity) and after amplification the pulse is back-compressed by means of a grating-pair allowing the pulse-width tuning from a minimum value of up to . Apart from the laser source, the system is equipped with a harmonic generation (HIRO, Light Conversion) that generates the second, third and fourth harmonic ( , ,
respectively).
The laser beam, before illuminating the sample, pass through a proper section of focusing lenses equipped with different objectives in order to select the suitable spot size. In particular the used system is equipped with three infinite corrected NIR-extended objectives (20X 0.4NA, 50X 0.42NA, 100X 0.5NA, Mitutoyo), one oil-immersion objective for VIS region (100X 1,25NA, Olympus) and few lenses designed for the UV wavelengths. These objectives allow setting a working distance from
to ( . in case of oil-immersion) and an elliptical spot size form x and long to . x . , long. A CMOS camera, located before the objective allows looking out the surface to control the writing process. The camera vison can be used to set manually the substrate surface distance but it can be also set automatically by using an integrated AutoFocus system. The sample movement are
SH ( ) TH ( ) 4H ( ) 𝜂 % % %
22 made by a 3D motorized air-bearing translator stage (FiberGlide3D, Aerotech) that ensures low friction and high precision even at high translation speeds. In microfabrication it is better to move the sample in order to avoid affecting the beam quality and alignment, to have higher translation range. FiberGlide3D consists of three linear stages (X-Y-Z) controlled and programable by a dedicated computer software (Automation 3200, Aerotech) able to control the relative position, velocities and acceleration modes. The sample is fixed to the stage by vacuum-valves. Several integrated feedbacks ensure a real-time monitoring and allow to uniform translation along any 3D path ensured by the constant tangential velocity. A control software (SCA, Altechna) offers a more user-friendly programming environmental and convert the instructions in the G-Code that drives the motion stage (Figure 2.5). This stage ensures repeatability of ± with resolution within a large travel range of x
x (X-Y-Z) and high maximum velocity of / .
The chemical etching concludes the fabrication process. It can be achieved by a solution of HF or KOH in deionized water in a performed and dedicated environment. Since the irradiated area are etched 40 times faster than the fused silica glass, the glass etching can be compensated during the sample design introducing a “conical shape” compensation that taking into account the different etching velocity allowing to realize uniform final structures. The etching rate is also dependent on the beam polarization: the etching rate is faster when the electric field 𝐸̅ of the writing beam is perpendicular to the writing direction ̅ compared to the case parallel polarization (Figure 2.7). This behaviour is due to the different nanograting orientation formed in the irradiated area that affects the etching process.
Figure 2.6 – a) 3D sketch for the writing process: it reports path the laser follows to realize the design device. b) Picture during the chip fabrication c) Optical microscope image of a final sample.
23 The duration of the etching treatment is about one hour; during this time, the structure formation can be monitored by visual inspections; at the end samples are cleaned in a bath in deionized water and isopropyl alcohol to eliminate potential acid residues.
Figure2.7– Polarization dependence of etching rate versus pulses energy and writing beam polarization: electric field (E) perpendicular to the writing direction (S) E ⊥ S (orange triangles); E oriented at 45° to S (blue dot); E ||S; A: sketch of the grating orientation in case of E ||S; B: sketch of the grating orientation in case of E ⊥ S [9]
24
3 Design and fabrication of the optofluidic
resonators
The difficulty of realizing a Fabry-Perot micro-resonator is due to the critical alignment of the two mirrors with respect to each other and of achieving suitable mechanical stability. It is a key issue when the cavity is made by two parts that need to be bounded together [11, 12, 13], or if it is made by a soft material, as PDMS [15] that it is characterized by a high softness.
In this work, all the investigated microlasers have been realized by using the Femtosecond Micromachining Technology (FMT) described in the former section (2.3).
In the next sections will be described how combining two fast prototyping technology such as femtosecond micromachining and Ink-Jet, is possible realize a high performance Fabry-Perot resonator embedded in a glass chip.
3.1 Mirror fabrication by Ink-Jet technology
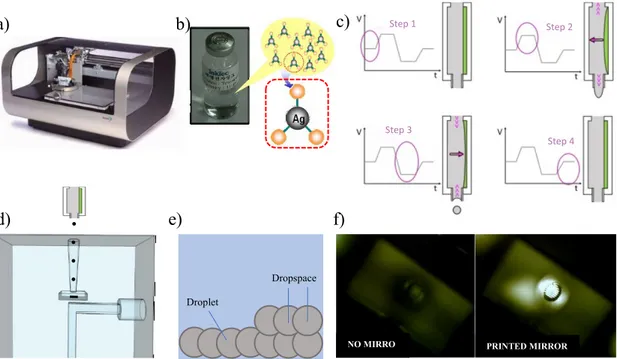
The Ink Jet printing technology was initially developed as a low-cost solution to standard lithographic processes and to print other material in electronics and integrated circuits [10]. To the aim of this thesis work we have used a Fujifilm DIMATIX printer (in future DIMATIX) designed for high resolution and non-contact jetting of functional fluids in a broad range of applications and a commercial ink, Inktek IJ 010, that is based on Ag-nanoparticle solved in organic complex solvent. DIMATIX works like a standard colour printer where a head moves in a XY plane and “print” ink droplets (Figure a, b). A fluidic module (bag, valve, pressure system) and jetting module (MEMS jetting structure, heater, thermistor, electrical connection, fluid connection) compose the printer head. In order to work in high-resolution regime, the printer was tested with 1pL and 10pL cartridges. In both cases an electric field acts a piezoelectric membrane that allows the ink to flow out from the needle and be ejected. Figure 3.1(c) reports a scheme of the steps that allow the droplet generation: (Step 1) the standby position and the relative electric field applied; (Step 2) and (Step 3) the droplet releasing is leaded by
25 the membrane contraction and distress due to the applied electric field; (Step 4) the membrane returned to the standby position and it is ready to generate a new droplet. Mirrors are printed in the bottom surface of the specially designed basin realized close to dye microchannel.
As shown in the Figure 3.1(e), the droplets pass through the access channel that connects the basin with the external side of the sample. The mirrors have a diameter higher than , double of the core of a multimodal optical fiber. In order to control the mirror thickness, then the final reflectivity, the distance between two successive droplets, called “dropspace”, is fixed This allows to determine the final volume of the printed ink, thus the mirror performances. In order to obtain high density and uniform surface, curing the ink at 150°C for 5 min is needed, in this way the solvent evaporates causing silver nano-particle sintering [15]. Figure 3.1(f) shows the printed mirror before and after the curing process. In the printed mirror, on the right, the reflecting surface is clearly visible; the parallel dark lines represent the intrinsic roughness and are due to the MFT process that realizes surfaces as a sequence of parallel layer. In order to realise the surface as smoothest as possible, the bottom surface of basin (where mirror is printed) is written as “vertical wall”.
c) d) e) a) b) f) Step 1 Step 2 Step 3 Step 4 Dropspace V V V V V V V V V V Droplet
NO MIRRO PRINTED MIRROR
Figure 3.1 – a) Picture of the Fujifilm Dimatix printer; b) picture of the Inktek IJ010 and a sketch of the molecules formula; c) The four steps required to the droplet generation: Step 1 standby position, Step 2-3 the droplet releasing is leaded by the membrane contraction and distress due to the applied electric field; Step 4 standby position; d) Mirror realization: the ink’s droplet reach the basin surface travelling through the lateral basin access; e) mirror realized droplets array where “dropspace” means the distance between the centre of two droplets f) picture of the basin trough the lateral basin access before and after the mirror realization
26 A careful mirror calibration has been carried out in order to have a correlation between the, used ink volume, the resulting film thickness and the final mirror reflectivity. In this way the mirror reflectivity was adjusted by controlling the total volume of the ink droplets to get a high reflectivity mirror (~90.5%) and an output mirror with reflectivity in the range 65%-90.5%.
The mirror reflectivity has been measured using the spectrophotometric method shown in Figure 3.2 where the bright signal from a white source was collected by an optical fiber to the fabricated mirror; the reflected optical signal was detected by a coupled spectrometer (Black-Comet, StellarNet).
Value
Mirror reflectivity ~ %
Ink volume [nL/mm2] . −
Metal film thickness −
Table 3.1 – The table reports the mirror reflectivity, the ink volume and the metal film thickness achievable by using the Fujifilm Dimatix Ink-Jet printer and Inktek IJ010 ink.
Figure 3.2- Sketch of the set-up used to measure the mirror reflectivity. A halogen light source is collect by optical fiber to a broadband fiber optic coupler to the fabricated mirror. The reflected light is signal was detected by a coupled spectrometer.
27
3.2 Connection of the samples
The step after the sample realization is providing it with two microtubes for inlet and outlet of the gain medium and an optical fiber close to the output mirror to deliver the emitted light to an external detector. The flexibility offered by FTM has allowed to make all the correspondent channels aperture with conical shape that simplify and ensure best alignment during the integration steps. the sample chip is glued on a glass substrate in order to protect the optical fiber from bending and to keep the optofluidic chip in the sample holder for the optical characterization.
A picture of the final sample, ready to be tested:
Figure 3.3 Picture of microfluidici sample glued on a glass substrate to protect the optical fiber from bending and to lock into the sample holder. The microlaser is in between the yellow microtubes used to recirculate the gain medium.
28
4 Optofluidic microlaser realized by FMT
4.1 Previous works
There are only two sample of optofluidic microlasers realized by other researchers before beginning of this thesis work.
The first demonstration of optofluidic microlaser fabricated by FMT was reported by Midorikawa and co-workers in 2004 [18]. The authors realized a ring microresonator fully embedded in a glass chip. Since a used metal-ions rich structure, additional baking was necessary after chemical etching. The realized device is shown in Figure 4.1. The resonator is made by four mirrors (actually based on total internal reflection between glass and air voids) placed at 45° with respect to the oscillating beam. In this way a ring cavity is obtained with a gain medium flowing in through a channel in the transversal direction.
Critical issues in this design are the smoothness of micromirror surfaces and their reciprocal alignment. Moreover, laser output was obtained just exploiting the light Figure 4.1 – The first microfluidic laser realized by FMT; optical micrograph of the top view of the resonator, b) optical micrograph of the side view of the whole structure including the cavity chamber and the microfluidic channel; c) sketch of the ring cavity resonator with light path and output beams [18]
29 leakages tangential to the mirror surfaces as shown in the Figure 4.1(c). The laser emission by a solution of Rhodamine 6G in ethanol ( ) pumped by the second harmonic ( = ) of a Nd:YAG laser pulse ( ) is shown in Figure 4.2 with typical bandwidth and a threshold of pump energy density of below 𝐽 ∕ .
The main drawbacks are the low efficiency of the output coupling and resulting broad emission bandwidth.
The second example of the use of FMT to realize optofluidic microlaser was reported in 2015 by the Fan group [19]. In this case, the resonator is defined by a ring shaped channel, that is connected to conventional microfluidic circuit needed to get gain medium flowing. All the resonator parts where buried into the glass chip. A sketch of it is shown in Figure 4.3.
Figure 4.2 Typical emission spectrum of the microfluidic laser described in the text [18]
Figure 4.3 Design of the ring resonator based on the Whispering Gallery Modes realize by FMT: top view (A), cross section (A-A’) and overall scheme (B) [19]
30 Exploiting the 3D capability of FMT the microfluidic channels were connected to the ring resonator, in this way there was no degradation of the Q factor of the cavity. The fabrication process required a third step after laser writing and chemical etching necessary to bond the two substrates in order to get a single monolithic optofluidic platform, shown in Figure 4.4. This optofluidic laser was tested with a quinoline solution of Rhodamine 6G ( ) pumped by nanosecond pulses at 532 nm. The lasing threshold was measured at pumping energy density of about µ𝐽/ with a quality factor ≈ . · . These excellent results show the capability of FMT as powerful tool to fabricate optofluidic microlasers with state-of-the-art performances.
Figure 4.4 Practical realization of the ring resonator described in the text: (A) the whole optofluidic chip; (B) the ring resonator embedder in glass (C) microchannels providing the gain medium
31
4.2 Our cavity design
All the optofluidic microlasers based on Fabry-Perot cavity, fabricated up to now, could not reach a high quality factor leading to an emission linewidth of about – . In fact, alignment of the two mirror surfaces with respect to each other and the mechanical stability of such alignment represented critical issues in microlasers fabricated by coating a metallic films on the side of microfluidic channels or on the edge of the fibers used to collect the signal, where the soft-lithography technique was used for the fabrication of the microfluidic chip [13, 20, 21, 22].
These alignment problems can be overcome if the cavity is fabricated as a rigid structure embedded in glass, since FMT provide high resolution writing allowing to get good parallelism between mirrors without any need of further adjustment. As described in section 2.4 mirrors have been realized using a high-resolution ink-jet printing technique on previously fabricated basins in the glass structure. We have designed and realized different resonator cavity which are described below.
4.2.1 Transversal cavity
In this configuration two mirrors have been realized on the opposite side of the microfluidic channel to get a resonator with optical axis perpendicular to the gain medium flow. The separation between the mirror surface and the channel is made by thin glass layer of . The microfluidic channel has a rectangular section with height
between 𝑎 , depth of .
In this configuration the channel is pumped by an orizontal focused beam and the light coming out by the semitransparent mirror is collected by an optical fiber located close
LASER OUTPUT
Microfluidic channel
Figure 4.5 - Sketch and microscope picture of the transversal Fabry-Perot resonators realized in glass chip. The picture reports the main dimension of the cavity parts.
32 to it. On the sides the microtubes allow the active medium recirculation. In Figure 4.5 it is shown a schetch of the cavity and a microscope image reporting the actual dimensions of the different parts.
4.2.2 Longitudinal cavity
In order to increase overall gain, the empty basins were built close to the edges of the microchannel realizing the laser cavity along the gain medium flow. In this way, the cavity length has been increased from . to . . Pumping and gain resirculation have realized as in the previous design.
In Figure 4.6 it is shown a schetch of the cavity and a microscope image reporting the actual dimensions of the main parts.
Dye inlet Dye outlet
Figure 4.6 - Sketch and microscope picture of the longitudinal Fabry-Perot resonators realized in glass chip. The picture reports the main dimension of the cavity parts.
33
4.2.3 Hemispherical cavity design
The hemispherical cavity has been developed with the purpose to have a higher confinement of the electric field in the cavity and to reduce in this way the pumping threshold by increasing cavity stability. For this purpose, two mirrors were made: one is flat and perpendicular to the channel, the other has spherical shape with radius of curvature = . ; the stability condition is fulfilled since = . , thus being > . In Figure 4.7 it is shown a schetch of the cavity and a microscope image reporting the actual dimensions of the main parts.
Microfluidic dye channel Output mirror Spherical mirror Laser output Dye inlet Dye outlet
Figure 4.7 - Sketch and microscope picture of the hemispherical resonators realized in glass chip. The picture reports the main dimension of the cavity parts.
34
4.2.4 Cavity with control channel
This cavity is based on the longitudinal design in which a second channel is added. It passes through the resonator and can be used (i) to tune the laser wavelength, (ii) deliver materials under test that modifying the cavity condition (increasing the losses) changing the emitted spectrum. In Figure 4.8 it is shown a schetch of the cavity and a microscope image reporting the actual dimensions of the main parts.
Total reflection mirror
Dye inlet Microfluidic dye channel Output mirror
Control channel Laser output Optical fiber
Control channel inlet -outlet
Dye outlet 0.8 mm
50 µm 200 µm
Flow Flow
Figure 4.8 – Sketch and microscope picture of the longitudinal Fabry-Perot resonators with a control channel realized in glass chip. The picture reports the main dimension of the cavity parts.
35
5. Device characterization
5.1 Experimental set-up
The expreimental set-up used for the characterization is shown in Figure 4.1. The optical pumping source is a pulsed Nd:YAG laser (Continuum Surelite SL-20) that generates a fundamental wave at 𝐼 = with duration of ~ . This wavelength is located into the infrared spectrum and cannot be used to pump dyes that emit in the visible range. A second harmonic crystal is used to double it to 𝐼𝐼 = . The visible emission is separated and filtered from the infrared one by a second harmonic separator and a KG filter. The pulse energy is controlled by a double stage of attenuators: neutral density filters, and a ⁄ plate placed before a polarizer provide a vertical polarization and the fine control of the energy density. To monitor the energy of each pulse a beam splitter redirect part of the beam intensity to a fast photodetector connected to a fast oscilloscope. A diaphragm and a cylindrical lens with a focal length of 5cm generate a rectangular spot that overlap the optical cavity of the sample, mounted in a x-y-z micrometric translator (Thorlabs). The dye flow into the microfluidic channel of the samples with a stable flow rate of . µ / 𝑖 thanks to a high-performance syringe pump (NE-1002X, SyringePump) connected to the microtubes plugged to the glass chip. The constant flow rate guarantees the complete replacement of dye molecules in the cavity volume between two successive pumping pulses avoiding bleaching and quenching effect. The fiber optic coming from the glass chip is connected to a high-resolution spectrometer with high-resolution of . (Ocean Optics HR4000) and the signal, is analyzed by a computer. The conversion of the pulse energy into the energy density was made possible by measuring the beam spot size in the focal plane by the knife-edge technique using a razor blade in front of a detector. With the described set-up the available energy density range from . µ𝐽/ to 𝐽/ .
All the fabricated devices were characterized using Rhodamine 6G solution in ethyl alcohol as gain medium with concentration ranging from . to . Some test has been done changing both laser dye and solvent. In the following sections, typical experimental results are reported for each cavity design.
36
37
5.2 Results of measurements
5.2.1 Transversal cavity
In Figure 5.1(a-b) the evolution of the emission spectrum is reported by increasing the pumping energy density for 1mMol Rh6G solution in ethyl alcohol. It is also reported the spectrum (red line) of the emission from a chip with the same channel geometry without mirrors (in this case the correspondence basin has not been coated by metallic ink). It is clear the effect of the resonant cavity in using a clear narrowing of the emission up to a full width bandwidth (FWHM) of . . This data refers to a cavity length of . A second test has been performed with a chip where the cavity length was at the same concentration of Rh6G. In this case narrowing effects is improved with the achievement of a FWHM of . ; Figure 5.1(c-d). The plot of the FWHM for both samples, reported in Figure 5.2, point out the onset of the threshold laser action,
a) b)
c) d)
Figure 5.1 – a) Typical emission spectrum increasing the pump power and b) Full width half maximum of the stimulated emission bandwidth versus pumping energy density. Data correspond to a channel width of . c) represent the typical emission spectrum increasing the pump power, and d) report the Full Width Half Maximum of the stimulated emission. Data correspond to a channel width of . In both of cases a solution of R6G solved in ethyl alcohol at a concentration of .
38 since the suddenly reduction of the emission bandwidth is clearly observed. This is confirmed by plotting the output signal versus the pumping energy density.
The classical threshold behaviour is evident in both cases. The increase of the interaction length in the cavity shows a clear reduction of the threshold with respect to the cavity.
Figure 5.2 - Laser output versus energy density of the pumping pulse in case of: a) channel width of , and b) a channel width of . In both cases the gain medium was a solution of R6G solved in ethyl alcohol at a concentration of .
39
5.2.2 Longitudinal cavity
In this configuration chip with three different lengths: . , . and . were tested. In this case the device behaviour was characterized using the following laser dyes. Rhodamine 6G, Pyrromethene 597, DCM. Ethyl alcohol as solvent.
Measurements were performed at different pumping power and different dye concentrations. As an example, we report data obtained with the cavity length of . that showed the best performances. The appearance of the laser action over the dye spontaneous emission band is clear from Figure 5.3 for 0.5mMol Rh6G concentration. The transition from the spontaneous to the laser emission can be easily observed. The correspondent plot of FWHM and laser output versus energy density are also shown.
Figure 5.3 – a) Typical emission spectrum increasing the pumping energy; b) Full Width Half Maximum of the stimulated emission vs pumping energy; c) Laser output versus energy density of the pumping pulse for a solution of Rh6G in ethyl alcohol at concentration of . .
a) b)
40 Using R6G solved in ethyl alcohol the lowest threshold has been obtained . 𝐽/ , as shown in the Figure 5.4. In this case a nice laser spike is measured at 572nm with a FWHM below 0.6nm. This data shows the achievement of a quality factor ~ , that is a remarkable result for a Fabry-Perot microlaser. Figure 5.4(b) shows a bandwidth always lower than 1nm is obtained in this case well below the values reported for other optofluidic based on F-P resonator.
Several measurements were carried out by changing the dye concentration. The dependence of the pumping threshold and the correspondence emission wavelength versus concentration are reported in Figure 5.5. The chips with different cavity length ( . and . ) have been tested using Rh6G as laser dye. Figure 5.6 shows that the expected threshold decrease is observed from 0.7mm to 2.5mm length while no additional improvement in the pumping threshold is associated to the increase of the cavity length up to 2.5mm. On the other hand, the longest F-P cavity shows a broader bandwidth.
a) b)
c)
Figure 5.4 – a) Typical emission spectrum increasing the pumping energy; b) Full Width Half Maximum of the stimulated emission vs pumping energy; c) Laser output versus energy density of the pumping pulse for a solution of Rh6G in ethyl alcohol at concentration of .
41 The . long cavity has also been tested using Pyrromethene 597 (PM 597) and DCM as laser dyes. Similar performances (or even better) in case of PM 597 has been achieved for the emission bandwidth, however with some increase the required threshold. The Figure 5.7 correspond to the laser emission of this cavity when PM 597 is used at a concentration of solved in ethyl alcohol.
On the contrary using DCM we have a remarkable increase of the threshold as shown in Figure 5.8(b) while the emission bandwidth is interesting as shown in Figure 5.8(a). Figure 5.5 - Dependence of the pumping threshold and the correspondence emission wavelength versus concentration for a longitudinal cavity . length.
42 Similar studies have been done with cavities length of . and . : the performances in terms of linewidth has been confirmed and was achieved for both spectra with Δλ < . while the threshold value obtained define the trend reported in Figure 5.6.
It is also important to observe that the spectrometer (HR4000, Ocean Optics) used to acquire the light coupled out by the chip has a resolution of . that is higher than the distance between two consecutive modes (0.07nm, Table 2). It means that the cavity does not select a single mode emission, but amplify a small range of modes.
Figure 5.7 – a) Typical emission spectrum above threshold; b) Laser output versus energy density of the pumping pulse for a solution of PM597 in ethyl alcohol at concentration of .
a) b)
Figure.5.8 – a) Typical emission spectrum above the threshold; b) Laser output versus energy density of the pumping pulse for a saturated solution of DCM in ethyl alcohol.
43
5.2.3 Hemispherical cavity
Hemispherical cavity was realized with a cavity length of 1.5 mm as shown the best performances in F-P resonator. To study the behaviour of this device has been tested with Rhodamine 6G ( ) and Pyrromethene 597 ( ) at concentration of
in ethyl alcohol.
Emission spectra and pumping energy density shown for Rh6G in Figure 5.9 and for Pyrromethene in Figure 5.10. In this case emission is characterized by a narrow peak with a bandwidth in same order of the previous cases. However, a broader background is present. Threshold is increased in comparison to the flat mirror cavity.
A further comparison between the hemispherical and the Fabry-Perot laser resonators have been carried out concerning the dependence of the device performances on the Figure 5.9 - Typical emission spectrum above the threshold; b) Laser output versus energy density of the pumping pulse for a solution of RH6G in ethyl alcohol at a concentration of .
a) b)
a) b)
Figure 5.10 - Typical emission spectrum above the threshold; b) Laser output versus energy density of the pumping pulse for a solution of PM 597 in ethyl alcohol at a concentration of
44 alignment of the pump beam with respect to the active channel. Data reported in Figure 5.11 shown the emission spectra obtained by translating in the vertical plane the sample with respect to vertical plane of the focal spot of the pump beam. In case of F-P cavity (flat mirrors) we observe a critical dependence of the emission spectrum on the sample position. Translation leads to the appearance of additional spikes and to a wavelength shift of the main emission line. On the contrary, the hemispherical cavity looks less sensitivity to this translation: emission is always characterized by a broad background but the emission peak is always located at the same wavelength. This latter effect is clearly shown in Figure 5.12 where the laser emission corresponded to three different positions are superimposed
Figure 5.11 - Emission spectra above the threshold for a Fabry-Perot cavity length of . . The spectra are obtained by translating in the vertical plane the sample with respect to vertical plane of the focal spot of the pump beam, for a solution of Rh6G in ethyl alcohol at a concentration of 5mMol
Figure 5.12 - Emission spectra above the threshold for a Hemispherical cavity with a length of . . The spectra are obtained by translating in the vertical plane the sample with respect to vertical plane of the focal spot of the pump beam, for a solution of Rh6G in ethyl alcohol at a concentration of 1mMol
45 Wider sequence of measurement taken by changing the mutual position of focal spot and active channel by are repoerted in Figure 5.13, for the Fabry-Perot cavity, an in Figure 5.14, for the hemisferical cavity, and confirm the behavioru just described.
46
Position Position Position
Position Position Position
Figure 5.13 – Emission spectra above the threshold for a longitudinal cavity with a length of 1.5mm. The spectra are obtained by translating in the vertical plane the sample with respect to vertical plane of the focal spot of the pump beam by steps of , for a solution of Rh6G in ethyl alcohol at a concentration of 5mMol


![Figure 2.3 - Schematics of the nonlinear absorption process: a) multiphoton absorption; b) tunnelling ionization; c) advance ionization [15]](https://thumb-eu.123doks.com/thumbv2/123dokorg/2967093.26990/24.892.198.772.243.389/schematics-nonlinear-absorption-multiphoton-absorption-tunnelling-ionization-ionization.webp)

![Figure 4.2 Typical emission spectrum of the microfluidic laser described in the text [18]](https://thumb-eu.123doks.com/thumbv2/123dokorg/2967093.26990/34.892.270.684.235.489/figure-typical-emission-spectrum-microfluidic-laser-described-text.webp)

