Università Politecnica delle Marche
Department of Agricultural, Food and Environmental Sciences Scientific field: AGR/01 - Economics and Rural Appraisal
Ph.D. IN AGRICULTURAL, FOOD AND ENVIRONMENTAL SCIENCES
XV (150) EDITION (2013-2016)
Consumer attitudes, perceptions and motivations on
innovative non-alcoholic drinks in Italy and Turkey
Ph.D. Thesis of: Advisor:
Emel Ozturk Prof. Raffaele Zanoli
Ph.D. School Director
Prof. Bruno Mezzetti
i
Acknowledgements
I would like to address my sincere gratitude to Prof. Raffaele Zanoli for guiding and advising me through the entire process of this dissertation, for giving me such a great opportunity to participate in this field of research and simply making this work possible.
A great thank you to all colleagues from the Marche Polytechnic University for every help they provided me throughout three years. I am grateful to my family and my friends for their encouragement and support during this period.
iii
Abstract
The main aim of the thesis was to help designing a marketing strategy to position an innovative drink – organic sparkling grape juice – in Italy and Turkey by focusing on packaging designs and branding. To achieve this goal, the thesis is constructed upon four independent but interrelated studies: (i) a general overview of the beverages sector in Turkey, (ii) the role of morphology in the bottle perception of the consumer; (iii) appropriate brand name, bottle and label shapes for Italian and Turkish markets; (iv) impact of packaging features on visual behaviour of consumers and their emotional responses to product tasting.
The first study suggests that occasional alcoholic drinks consumption, increasing awareness about healthy drinks as the main concerns of consumers and high taxes and restrictions with laws on the sale of alcoholic products as current sector issues, innovative non-alcoholic drinks might have a chance in the Turkish market.
Overall results of the following three packaging studies suggest that the different parts that make up the bottle morphology are not equally relevant, and in the labelling and packaging of a drink, much more attention should be given to the shoulder which represents the middle part. Round shaped bottle and label are more adapted for organic sparkling grape juice according to both Italian and Turkish consumers. However, different approaches of two populations towards brand names should be considered while entering into these markets. The bottle shape has a strong impact on capturing the attention of the consumer but its interaction with label shape and the product name is more significant. With reference to emotional expressions of the consumers, product disliking has more impact than liking. Considering these results of packaging studies, optimisation of the packaging features might allow to better capture the attention of the consumer as it is the overall first impression that a consumer has about a drink exposed on a shelf.
v
Riassunto
L'obiettivo principale della tesi è stato quello di ideare una strategia di marketing per il posizionamento di una bevanda innovativa - succo d'uva frizzante biologico - in Italia ed in Turchia, basata sullo studio del packaging e del nome del brand. Per raggiungere questo obiettivo, la tesi è stata sviluppata in quattro studi indipendenti ma correlati tra di loro: (i) una panoramica generale del settore delle bevande in Turchia, (ii) il ruolo della morfologia della bottiglia nella percezione del consumatore; (ii) lo studio di marche, forme di bottiglia e di etichette appropriate per i mercati italiani e turchi; (iv) l'impatto di specifici imballaggi sul comportamento visivo dei consumatori e delle loro risposte emotive all’assaggio del prodotto.
Il primo studio suggerisce che, il consumo occasionale di bevande alcoliche, il crescente interesse nei confronti di bevande sane sono le principali preoccupazioni dei consumatori, mentre le elevate imposte, le restrizioni e le leggi sulla vendita di prodotti alcolici rappresentano le problematiche attuali del settore, di conseguenza nuove bevande analcoliche potrebbero avere una possibilità nel mercato turco .
I risultati complessivi delle seguenti tre studi sul packaging suggeriscono che le varie parti che compongono la morfologia di bottiglia non sono ugualmente rilevanti, e sia nella etichettatura e che nell'imballo di una bevanda, molta più attenzione dovrebbe essere data alla spalla della bottiglia che che rappresenta la parte centrale. Forme rotonde per bottiglia ed etichetta sono le più adatte per il succo d'uva spumantizzato biologico secondo sia per i consumatori italiani che per quelli turchi però diversi approcci di due popolazioni verso i nomi di marca deve essere considerata durante l'inserimento in questi mercati. La forma della bottiglia ha un forte impatto nel catturare l'attenzione del consumatore, ma la sua interazione con la forma della etichetta e il nome del prodotto è ancora più significativo. Per quanto riguarda l’analisi delle espressioni emotive dei partecipanti, si rileva un impatto maggiore verso le caratteristiche sgradite del prodotto piuttosto che per quelle gradite. Considerando questi risultati dei studi sul
vi
packaging, l'ottimizzazione delle caratteristiche di confezionamento di un prodotto potrebbe consentire di catturare meglio l'attenzione del consumatore dato che questa rappresenta la prima impressione per qualunque consumatore del prodotto esposto su uno scaffale.
vii
Contents
1 Introduction ... 1
1.1 Motivations ... 1
1.2 Structure of the thesis ... 3
References ... 4
2 The Alcoholic and Non-alcoholic Beverages Sectors and Consumption Patterns in Turkey: A Qualitative Survey... 7
2.1 Introduction... 7 2.2 Background ... 8 2.2.1 Country Outlook... 8 2.2.2 Literature Review ... 18 2.3 Methods ... 19 2.4 Results ... 21
2.4.1 General Consumption Habits and New Trends... 21
2.4.2 Impact of Health Considerations on Drink Consumption ... 23
2.4.3 Wine Consumption ... 24
2.4.4 Organic Product Awareness ... 26
2.4.5 Impact of Legislative and Political Developments ... 27
2.5 Discussion ... 29
2.6 Conclusion ... 31
References ... 33
3 Eye tracking consumers’ bottle choice: the role of morphology .. ... 39
3.1 Introduction... 39
viii
3.3 Eye tracking ... 42
3.4 Material and methods ... 44
3.4.1 Participants ... 44 3.4.2 Procedure ... 44 3.5 Results ... 46 3.6 Discussion ... 50 3.7 Conclusion ... 52 References ... 53
4 Predictive package design for organic sparkling grape juice: A study with Italian and Turkish consume rs ... 61
4.1 Introduction... 61
4.2 Background ... 61
4.3 Material and methods ... 66
4.3.1 Respondents ... 66
4.3.2 Survey design... 67
4.3.3 Procedure ... 70
4.4 Results ... 71
4.4.1 Organic Product consumption... 71
4.4.2 Trust level to certain label information ... 73
4.5 Result of packaging and branding ... 75
4.5.1 Shape of bottles and labels ... 75
4.5.2 Brand names ... 77
4.6 Discussion ... 80
4.6.1 Organic product consumption and trust ... 80
4.6.2 Packaging and branding ... 82
ix
References ... 86
5 An eye tracking study on packaging and branding of an organic sparkling grape juice ... 93
5.1 Introduction... 93
5.2 Background ... 93
5.2.1 Eye tracking ... 93
5.2.2 Sound and shape symbolism in food packaging ... 95
5.2.3 Emotions... 97
5.3 Material and methods ... 99
5.3.1 Participants ... 99
5.3.2 Design ...100
5.3.3 Procedure ...102
5.4 Results ...104
5.4.1 Eye tracking and choices ...104
5.4.2 Emotional responses ...109 5.5 Discussion ...111 5.5.1 Eye tracking ...111 5.5.2 Emotions...113 5.6 Conclusion ...115 References ... 116 6 General Conclusion ... 123
1
1 Introduction
1.1 Motivations
The main objective of marketing is to match products with people by guiding the design and presentation of products (Ariely & Berns, 2010). In order to achieve this objective, consumer decision-making and how consumers assess various product alternatives are the main questions of the marketing researches (Solnais, Andreu-Perez, Sanchez-Fernandez, & Andreu-Abela, 2013). Product-innovation is distinguished as one of the major issues. Since the consumers become “better educated, more demanding, less predictable in terms of purchase behaviour and more conscious about health aspects” than in the past, the main challenge for the food industry is to adapt to an evolving consumer profile (Linnemann, Meerdink, Meulenberg, & Jongen, 1998). In addition, increasing intensity of international competition stemmed from globalization has been forcing companies to develop different approaches in order to market their products successfully on a world-wide basis (Calabrese, Capece & Costa, 2015). The ability of offering consumers new products with special attributes gives competitive advantages in the global food market (Russo, Cardillo, & Perito, 2003). World Innovation Panorama analyses the prominent trends in food innovation worldwide and summarizes five main concepts of innovation based on overall consumer expectations. These concepts are pleasure, health, physical aspects, convenience, and ethics. Pleasure includes trends of sophistication, a variety of senses, fun, and exoticism. Health concept is related to if food is natural, vegetal or medical. Slimness, cosmetics, and energy well-being trends are classified under physical aspects while trends of easiness to handle, time-saving and nomadism are evaluated as the parts of convenience concept. Lastly, solidarity and ecology trends are given under ethics.
“Organic sparkling grape juice” has been chosen as a subject of this research considering these trends of innovation. First, this drink is non-alcoholic where alcoholic beverages and their impacts on health is gaining importance academically, as well as socially, year by
2
year. In 2007, the International Agency for Research on Cancer concluded that there is sufficient evidence on the contribution of alcohol consumption to cancer (Baraan et al., 2007). Many other national and international organizations have reported harms of alcohol consumption (e.g. World Health Organization, 2014). Therefore, innovative non-alcoholic drinks may attain more importance for the consumers seeking healthy alternative products. Second, organic production is connected to various innovation concepts since health, ecology, fairness and care constitute basic principles of organic farming (International Federation of Organic Agriculture Movements, 2016). In addition, consumption of organic products is still relatively new for many consumers and these products can be considered still an innovation in the food industry as well (Marchese, Masotti, Sidali, & Dörr, 2014; Vanhonacker et al., 2013).
In the competitive area, not only creating innovative products according to consumer expectations but also how to convey this product with them bears a great importance. Hence, packaging has a crucial role in capturing consumers’ attention and delivering the product’s content (Wang & Chou, 2010) since it is a direct communication tool to the consumers and works as a very critical factor in their decision-making process (Estiri, Hasangholipour, Yazdani, Nejad, & Rayeh, 2010). Today more than 75% of consumers make purchase decision in-store (POPAI, 2016). Clement, (2007) stated that “people simply choose with their eyes”. In this context, understanding how and to what extent the packaging elements are influencing consumers’ decision is essential for successful packaging designs. Thus, competitive advantage is provided to the product compared to the other products by physical form or design of the packaging (Bloch, 1995).
Taking into consideration importance of product innovation and role of packaging in consumer decision process at the point of purchase, the overall aim of the present PhD research has been determined as “to help designing a marketing strategy to position an innovative non-alcoholic drink – organic sparkling grape juice – in Italy and Turkey by focusing on packaging design and branding”.
3
Italy and Turkey are chosen as areas of research because “organic sparkling grape juice” is a quite innovation for both countries in terms of both production and consumption. Grape is mostly used for wine production in Italy, whereas the vast majority of Turkish production is for table grape and raisins. “Organic sparkling grape juice” can be an alternative product particularly for the companies which are seeking innovation to diversify production and added value to grapes which are used for table wine. Obtained insights from this thesis may contribute to generating ideas for innovative products and for packaging researches of the companies.
1.2 Structure of the thesis
The introductive part of the thesis gives the motivations behind the research subject and makes a contextual explanation.
The body of the thesis includes four independent, but interrelated articles based on researches realized during the period of Ph.D.
The first article includes the results of a qualitative survey which has been held in Turkey in order to find out and demonstrate the general view of Turkish beverage sector in terms of production and consumption.
Following three articles were written on consumer researches which are conducted in order to find out the possible packaging styles for “non-alcoholic organic grape juice”.
The final chapter contains conclusive remarks on findings obtained by the conducted researches.
4 References
Calabrese, A, Capece, G., & Costa, R. (2015). Global Market and Commercials: Understanding Cultural Diversities. Knowledge
and Process Management, 22(3), 167–179.
http://doi.org/10.1002/kpm
Ariely, D., & Berns, G. S. (2010). Neuromarketing: the hope and hype of neuroimaging in business. Nature Reviews. Neuroscience,
11(4), 284–92. http://doi.org/10.1038/nrn2795
Bloch, P. H. (1995). Seeking the Ideal Form: Product Design and Consumer Response. Journal of Marketing, 59(3), 16. http://doi.org/10.2307/1252116
Clement, J. (2007). Visual influence on in-store buying decisions: an eye-track experiment on the visual influence of packaging design. Journal of Marketing Management, 23(9-10), 917–928. http://doi.org/10.1362/026725707X250395
Estiri, M., Hasangholipour, T., Yazdani, H., Nejad, H. J., Rayeh, H. (2010). Food products consumer behaviors: The role of
packaging elements. Journal of Applied Sciences 10(7). Linnemann, A. R., Meerdink, G., Meulenberg, M. T. G., & Jongen,
W. M. F. (1998). Consumer-oriented technology development.
Trends in Food Science and Technology, 9(11-12), 409–414.
http://doi.org/10.1016/S0924-2244(99)00006-0
Marchese, A., Masotti, M., Sidali, K. L., & Dörr, A. C. (2014). the Consumer Behaviour and New Brand Management Policies of Organic Food in Italy: the Case Study of “Vivi Verde Coop.”
Ciência E Natura, 36(1), 11–17.
http://doi.org/10.5902/2179460X11269
Russo, C., Cardillo, C., & Perito, M. A. (2003). Product innovation and imperfect competition in the Italian fruit-drink industry.
5
70–83.
Solnais, C., Perez, J., Sanchez-Fernandez, J., & Andreu-Abela, J. (2013). The contribution of neuroscience to consumer research: A conceptual framework and empirical review. Journal
of Economic Psychology, 36, 68–81.
http://doi.org/10.1016/j.joep.2013.02.011
Vanhonacker, F., Kühne, B., Gellynck, X., Guerrero, L., Hersleth, M., & Verbeke, W. (2013). Innovations in traditional foods: Impact on perceived traditional character and consumer acceptance.
Food Research International, 54(2), 1828–1835.
http://doi.org/10.1016/j.foodres.2013.10.027
Wang, R. W. Y., & Chou, M. C. (2010). Differentiation in the arched surface of packaging: Its influence on the findability of logo typography displays. Displays, 32(1), 24–34.
http://doi.org/10.1016/j.displa.2010.09.006
POPAI (2016). 2012 Shopper Engagement Study, Media Topline Report.
http://www.popai.fr/textes/Shopper_Engagement_Study.pdf World Health Organization, 2014. Global status report on alcohol and
health, 2014 Ed. Luxembourg : WHO Press.
International Federation of Organic Agriculture Movements, 2016. http://www.ifoam.bio/en/organic-landmarks/principles-organic-agriculture
7
2 The Alcoholic and Non-alcoholic Beverages Sectors
and Consumption Patterns in Turkey: A Qualitative
Survey
2.1 Introduction
The global per capita consumption of beverages was 240 litres in 2008, and this then reached 265 litres in 2013. The main engines of this growth have been non-alcoholic drinks (i.e., water in packs, hot tea and milk and milk-based drinks). The drink most consumed worldwide is hot tea, followed by milk and milk-based drinks, soft drinks, water, beer, coffee and alcoholic drinks (Bever Foods, 2014). With respect to global alcoholic beverages consumption today, 50.1% of the total recorded alcohol is consumed in the form of spirits. The second most consumed beverage type is beer, which accounts for 34.8% of all recorded alcohol consumed across the world (World Health Organisation, 2014).
Turkey has a fast growing population that reached 77.6 million in 2014, of which 24.3% are <14 years old and 67.8% are between 15-64 years old. In the Turkish economy, the food and beverages sector represents 18.9% of the gross national product. The Turkish population is a mixture of different cultures, and therefore it includes both diverse food and beverages consumption preferences and similar habits and patterns of consumption.
The present article had two main objectives: to provide a general overview of the beverages sector in Turkey, from both the supply and demand sides; and to provide a qualitative assessment of the on-going trends and dynamics of the consumption and supply of beverages in Turkey, including a preliminary analysis based on these qualitative findings. On this basis, the rest of the article is organised as follows: section two contains some background information on Turkey and from the literature; section three describes the methods of investigation; section four reports the results; this is followed by a
8
section for discussion; while the last section indicates the conclusions of the study.
2.2 Background
This section provides a systematic review of previous studies, national food and beverages sector reports, statistical information, and the scientific literature available on the conventional and organic beverages sector in Turkey.
2.2.1 Country Outlook
In the global trade of food and beverages, the European Union, USA, China, Brazil, and India are the top five exporters. In 2014, Turkey was the 8th most important commercial partner in the European Union in terms of food and beverages imports (FoodDrink Europe, 2014-2015).
For organic production, in 2013, Turkey was reported as the 19th country for the organic production area, and in the four most important vegetable growing countries in the world. Within European Union candidate and potential candidate countries, the most of the growth was in Turkey in past years (Willer and Shaack, 2015). Turkish organic food and beverages production is mainly export oriented, and the European market represents the main outlet. However, domestic consumption of organic products has also been increasing in Turkey, whereby product diversification has been increasing together with the available range of products through different marketing channels, such as supermarkets, e-commerce, specialised shops, organic bazaars, and other outlets.
9
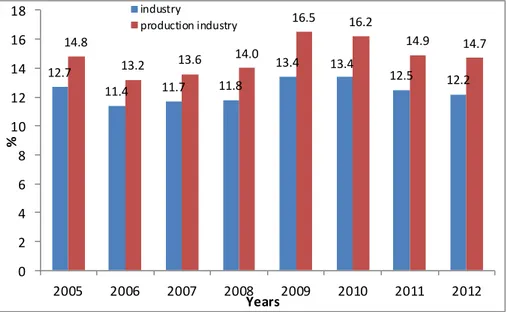
Figure 1. Share of the food and beverage sector within industry and production
industry in Turkey from 2005 to 2012 (Data of Turkish Statistical Institute reported in Turkey Food and Beverage Industry Associations Federation, 2014).
Figure 1 illustrates the share of the food and beverages sector for Turkey according to the Turkish Statistical Institute cited in Turkey Food and Beverage Industry Associations Federation, 2014, in terms of the total industrial activities and the production industries, which exclude the energy, mining, and quarrying. In 2012, the food and beverages sector in Turkey was to total 107 billion Turkish liras (TRY; approximately 37 billion euros), which was indicated as 14.7% of the whole production industries in Turkey. For the European Union (EU), the food and beverages sector was valued at 1,244 billion euros, representing 15% of the EU production industries sector (Turkey Food and Beverage Industry Associations Federation, 2014). In Turkey, the beverages industry itself represents only about 5.6% of the whole of the food and beverages sector (i.e., 6.55 billion TRY; 2.10 billion euros), while this sector represents 14% for the EU (Turkey Food and Beverage Industry Associations Federation, 2014; FoodDrink Europe, 2014-2015). Non-alcoholic beverages production in Turkey has the largest share of this industry (4.71 billion TRY; 1.51 billion euros), as
12.7 11.4 11.7 11.8 13.4 13.4 12.5 12.2 14.8 13.2 13.6 14.0 16.5 16.2 14.9 14.7 0 2 4 6 8 10 12 14 16 18 2005 2006 2007 2008 2009 2010 2011 2012 % Years industry production industry
10
72% of the beverages sector, with the remaining part covered by alcoholic drinks (Turkey Food and Beverage Industry Associations Federation, 2014). Regarding the total value of the wine market in Turkey, the last data available for 2011 which was 228 million TRY (73.2 million euros) and it was just 3.6% of the total food and beverages market (the EU is the world leading wine market, with an export value at approximately 10.9 billion euros, and an import value of 2.9 billion euros) (Turkey Food and Beverage Industry Associations Federation, 2014; Global Agricultural Information Network, 2015). In 2012, 40,719 companies were involved in the food and beverages sector, while only 484 were active in the beverages sector itself. With respect to distribution (%) of the companies in the beverages sector according to sub-sectors in Turkey, in 2012, non-alcoholic drinks producers have the biggest share of 75%. They are followed by wine producers (23%), beer producers (1%) and other distilled alcoholic drinks producers (1%) (Figure 2) (Turkey Food and Beverage Industry Associations Federation, 2014).
Figure 2. Distribution (%) of the companies in the beverages sector in Turkey
according to sub-sectors (Data of Turkish Statistical Institute reported in Turkey Food and Beverage Industry Associations Federation, 2014).
Drinking water and mineral water sources are rich in Turkey (Republic of Turkey Ministry of Economy, 2014). After water, soft drinks constituted approximately 25% of the total beverages sector in Turkey in 2013, which mainly included sparkling drinks, milk-based products and fruit juice (Erol, 2014). With respect to hot drinks, Turkey ranked 6th in terms of global tea production quantity (FAOSTAT, 2013) and its share in Turkish beverage sector has been valued as 40% in 2013 (Erol, 2014).
1%
23%
1% 75%
Distillation, purification and blending of alcoholic drinks
Wine production from grape Beer production
Production of non-alcoholic drinks; production of mineral waters and other bottled waters
11
The main alcoholic beverages produced in Turkey are beer,
raki1, wine, and vodka. According to global status report on alcohol
and health issued by World Health Organization in 2014, beer was the main alcoholic drink consumed in Turkey in 2010 with 63% of total consumption. It was followed by spirits (28%) and wine (8%) (Figure 3). With respect to production of alcoholic drinks in Turkey, the latest data available from Republic of Turkey Tobacco and Alcohol Market Regulatory Authority was related to 2010; beer constituted 89% of the total alcoholic beverages production, it is followed by wine with 6% and later raki, which is the Turkish traditional alcoholic drink, with 4%. Turkey ranks 6th in the world for its grape tonnage harvested (FAOSTAT, 2013); however, Turkey does not appear in the list of top wine-producing countries in the world. Indeed, as stated by Ozdemir (2013), a large part of the Turkish vineyards “remains destined for the production of products that are not turned into wine” (p. 5). In 2010, 53% of the total grapes are used as table grapes, 36% for the production of raisins and only the remaining 11% for wine making (Ozdemir, 2013). However, wine production has been increasing more rapidly in Turkey in recent years (Investment Support and Promotion Agency of Turkey, 2010).
Figure 3. Distribution of the alcohol consumption per capita (age, >15 years; litres
pure alcohol) according to alcoholic beverage, in Turkey, for 2010 (World Health Organisation, 2014)
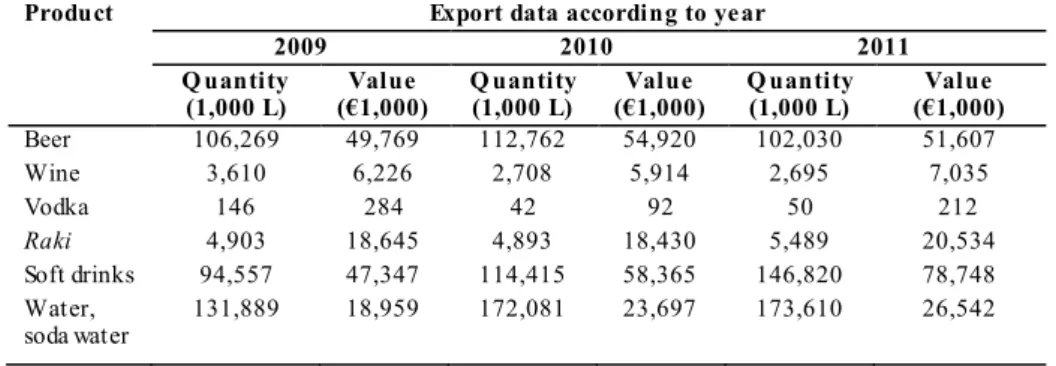
For the foreign trade of alcoholic beverages for Turkey, beer is the most exported product. In 2011, the main buyers were Iraq, Azerbaijan and the Turkish Republic of Northern Cyprus. Beer
1
Turkish raki is a type of traditional aniseed spirit produced by double distillation with aniseed using only a grape or grape and agricultural based ethanol mixture.
63% 28% 8% Beer Sipirits Wine
12
exports are followed by raki and wine exports (Table 1) (Republic of Turkey Ministry of Economy, 2014a). However, 90% of the beer production in Turkey is for domestic consumption (Republic of Turkey Ministry of Economy, 2014).
Table 1. Export of the main Turkish alcoholic and non-alcoholic drinks (Data of
Turkish Statistical Institute reported in Republic of Turkey Ministry of Economy, 2014).
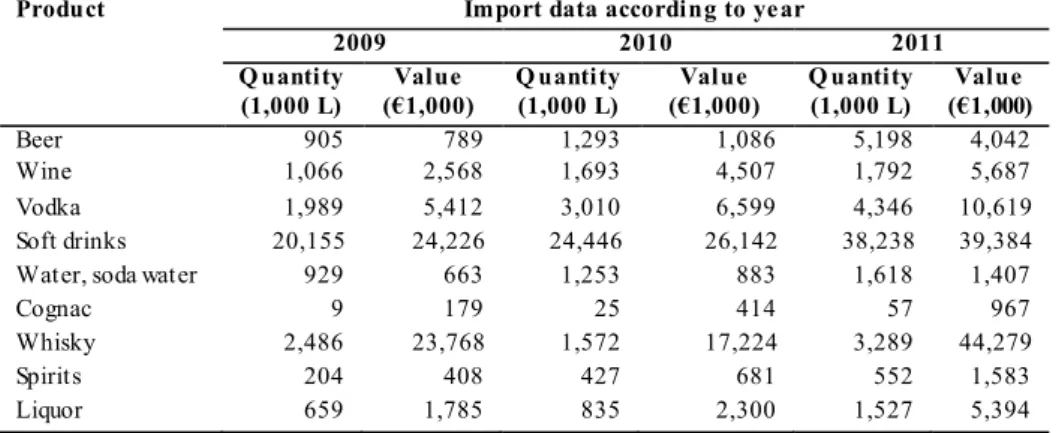
Whisky is the main alcoholic drink that is imported into Turkey (Table 2). The main imports are from the United Kingdom followed by the USA. After whisky, vodka and wine have the largest import volumes. However, the largest share of the beverages imported into Turkey is soft drinks, which mainly come from Austria, followed by Romania and Switzerland (Republic of Turkey Ministry of Economy, 2014).
Product Export data according to year
2009 2010 2011
Q uantity
(1,000 L) (€1,000) Value Q uantity (1,000 L) (€1,000) Value Q uantity (1,000 L) (€1,000) Value
Beer 106,269 49,769 112,762 54,920 102,030 51,607 Wine 3,610 6,226 2,708 5,914 2,695 7,035 Vodka 146 284 42 92 50 212 Raki 4,903 18,645 4,893 18,430 5,489 20,534 Soft drinks 94,557 47,347 114,415 58,365 146,820 78,748 Water, soda water 131,889 18,959 172,081 23,697 173,610 26,542
13
Table 2. Import of the main Turkish alcoholic and non-alcoholic drinks (Data of
Turkish Statistical Institute reported in Republic of Turkey Ministry of Economy, 2014)
Product Import data according to year
2009 2010 2011 Q uantity (1,000 L) Value (€1,000) Q uantity (1,000 L) Value (€1,000) Q uantity (1,000 L) Value (€1,000) Beer 905 789 1,293 1,086 5,198 4,042 Wine 1,066 2,568 1,693 4,507 1,792 5,687 Vodka 1,989 5,412 3,010 6,599 4,346 10,619 Soft drinks 20,155 24,226 24,446 26,142 38,238 39,384
Water, soda water 929 663 1,253 883 1,618 1,407
Cognac 9 179 25 414 57 967
Whisky 2,486 23,768 1,572 17,224 3,289 44,279
Spirits 204 408 427 681 552 1,583
Liquor 659 1,785 835 2,300 1,527 5,394
In Turkey, food and non-alcoholic drinks have the second largest share of the household consumption, second only to the housing and rental expenditure (Figure 4).
Figure 4. Distribution of household consumption expenditure by expenditure groups
from 2011 to 2013 (Data of Turkish Statistical Institute reported in Turkey Food and Beverage Industry Associations Federation, 2014).
21 .0 5 .2 25 .8 6 .4 1 .9 17 .2 4 .0 2 .7 2 .0 5 .7 4 .3 19 .9 5 .4 25 .8 6 .7 1 .8 17 .2 3 .9 3 .2 2 .3 5 .8 4 .2 20 .1 5 .3 25 .0 6 .6 2 .1 17 .4 4 .0 3 .1 2 .4 5 .9 4 .3 0,0 5,0 10,0 15,0 20,0 25,0 30,0 % Expenditure groups 2011 2012 2013
14
The distribution of household expenditure from 2011 to 2012 for food and beverages at the country level is given in Table 3. In 2013, alcoholic and non-alcoholic drinks consisted of 1.7% of the total share of food and beverages, which was 20.1% of the total household consumption expenditure (Figure 4).
Table 3. Distribution of household expenditure on food and beverages according to
years (Data of Turkish Statistical Institute reported in Turkey Food and Beverage Industry Associations Federation, 2014)
Expenditure Distribution according to year (%)
2011 2012 2013
Food 19.3 18.2 18.5
Non-alcoholic drinks 1.4 1.4 1.4
Alcoholic drinks 0.3 0.3 0.3
TOTAL (food and
beverages) 21.0 19.9 20.1
Furthermore, the Turkish Statistical Institute research into the regional household expenditure in Turkey has shown that the total share of household food and beverages expenditure increased in parallel to the decrease in the economic situation of the regions. The southeast Anatolia region (see Figure 5) had the biggest share, followed by northeast Anatolia and the middle east Anatolia regions. Istanbul, Ankara and Izmir were the cities which had the lowest shares for household food and beverages expenditure (Turkey Food and Beverage Industry Associations Federation, 2014).
15
Beverages consumption within Turkey can be divided into three main categories: hot drinks, soft drinks (including mineral water) and alcoholic drinks. Summary of the drinks mainly consumed in Turkey is given in Table 4 as consumption per capita. Tea is the main hot drink that is consumed, and Turkey is the highest country for tea consumption in the world, with an annual tea consumption of 3.2 kg per capita. Turkish coffee is also widely consumed in Turkey, although the global coffee chains that provide various alternative products have been entering the market more recently (Investment Support and Promotion Agency of Turkey, 2010). The total coffee consumption was been recorded as 0.74 kg per capita in 2014 (International Coffee Organisation, 2014).
Table 4. Consumption of the most preferred drinks in Turkey.
Drink Annual consumption (per capita)
T ea 3.2 kg
Coffee 0.74 kg
Sparkling drinks (non-alcoholic) 44 litres
Airan 20 litres
Fruit juice 8 litres
Beer 12.7 litres
Sparkling (i.e., carbonated) drinks are the most preferred soft drinks in Turkey, and their consumption was estimated at 44 litres per capita in 2013 (Coca-Cola, 2013). Apple, peach, sour cherry and apricot are the main crops that are processed into fruit juice production. Apple is important for the export markets, while peach, sour cherry, apricot and mixed fruit juices are consumed mostly in the domestic market. In recent years, apple, pomegranate, tomato and grape juices have also grown in demand in the domestic market. In 2013, the annual consumption of fruit juice and similar products were recorded as 8 litres per capita (Erol, 2014).
Milk is mainly consumed after it has been processed into yogurt, cheese, and airan. Airan is a traditional cold yoghurt-based drink that is made by mixing the yoghurt with water and salt. Its production reached 598,877 tons in 2014 (Turkish Statistical Institute, 2014), although it is also often produced at home. No official information available on consumption per capita. However, it was
16
estimated as 20 liters per capita in 2013 including homemade consumption (Haberturk, 2013).
Shalgam juice2, hardaliye3, boza4, and kefir5 are the most
known of the traditional Turkish fermented non-alcoholic beverages, as well as airan. Shalgam juice is becoming more popular, and it is widely consumed in the cities of Adana, Hatay and Icel (the Mediterranean region of Turkey). In recent years, it has become popular in other large cities, such as Istanbul, Ankara and Izmir (Tanguler and Erten, 2012). Kefir has started to be widely commercially available as well as being prepared at home (Kabak and Dobson, 2011). Unfortunately, there are no data available on the sales and market share of these more local products.
In terms of legal developments, the Turkish alcoholic beverages sector has passed two main steps: The first was in 2001, the sector was privatised by abolishing state monopoly in alcoholic beverages. After this decision, the Tobacco Products and Alcoholic Beverages Market Regulatory Authority, which was established in 2002, was authorised to regulate and inspect the market.
The second main step was the amendment to Article 6 of Law 4250 on Alcohol and Alcoholic Drinks in 2013, which focusses in particular on the restrictions for the marketing, publication, and promotion of alcoholic drinks. These restrictions have increased in importance on the national agenda, and they can be summarised as follows:
2
Shalgam juice is a red coloured, cloudy and sour soft drink that is produced by lactic acid fermentation of a mixture of turnips, black carrot, bulgur (broken wheat) flour, salt and water.
3
Hardaliye is a rape-based non-alcoholic fermented drink. Red grape or grape juice and crushed black mustard seeds and cherry leaves are used for its production.
4
Boza is a non-alcoholic fermented drink that is produced from millet, maize, wheat, or rice semolina or flour, with yeast and lactic acid fermentation.
5
Kefir is a viscous and self-carbonated drink with a smooth, slightly foamy body, and whitish in colour. It originated in the Caucasus M ountains and is produced by fermentation of cow, ewe, goat or other types of milk.
17
- Advertisement and consumer promotion of alcoholic drinks is not allowed.
- Producers, importers, and sellers cannot distribute alcoholic drinks as samples, gifts or promotions, or free of charge in any form. - Retail sale of alcoholic drinks is not allowed between 22:00 and
06:00 hours.
- Alcoholic drinks can be consumed in approved places and they cannot be sold for the aim of consumption outside of these facilities. Alcoholic drinks cannot be displayed on sale such that they can be seen from outside the sale point.
- Warning messages about the harmfulness of alcohol must be included on the packaging of alcoholic drinks produced in Turkey or imported from abroad (excluding export-oriented production). - Trademarks, images and distinctive symbols associated with
alcoholic drinks cannot be used on non-alcoholic drinks, and vice
versa (except for products for export).
- Except in residential areas and places of accommodation, the sale of alcoholic drinks is not allowed in facilities located along highways and roads.
- Alcoholic drinks cannot be sold in student dormitories, places of medical services, stadiums and closed sports facilities, all educational institutions, coffee houses, bezique and bridge saloons, restaurants and stores of petrol stations.
The production and marketing of non-alcoholic drinks are regulated by the Food Law, as Law 5179 of 27 May, 2004. In addition, official controls and sanctions, production, processing and distribution of non-alcoholic drinks are identified under Law 5996 on “Veterinary Services, Plant Health, Food, and Feed”. The Ministry of Food, Agriculture, and Livestock is the responsible authority for the implementation and control of these laws. Production of non-alcoholic drinks must be according to the Turkish Food Codex, the details of which are given in Declaration 2007/26 on “Turkish Food Codex Non-Alcoholic Drinks Notification”.
18 2.2.2 Literature Review
There have not been many studies on the beverages sector in Turkey. In a survey involving respondents in 15 provinces in Turkey, consumers were asked to rate choices among a pre-defined list of non-alcoholic beverages. These consumer rankings of products from most preferred to least preferred were: tea, Turkish coffee, instant coffee, sparkling non-alcoholic drinks, soda water, fruit juice, airan, fruit and herbal teas, iced teas, energy/ sports drinks, and finally chocolate-flavoured ready-made drinks (Ulusoy and Seker, 2013). The household fruit juice consumption and purchasing tendencies in Turkey were investigated by Gul, Akpinar, Dagistan, Yilmaz and Gulcan (2011). According to their data, 49% of the families interviewed prepare their own fruit juice at home, the remaining being purchased out of the home. It is of note that child buyers have been directly effected in the evolution of the preferences in fruit juice shopping. As indicated by Akabeliev and Dimitrov (1997), “the attitude towards drinking in a given culture has a very important role in the use and abuse of alcoholic beverages” (p. 1). Celen (2014) states impact of Islamic culture in Turkey on alcoholic drink consumption saying “Ramadan has been found to be associated with lower alcohol usage” and he adds “as the price of alcoholic drinks increases, the alcohol consumption decreases significantly. In addition, alcohol consumption rises with increased disposable income” in order to indicate relation between consumption and income level (p. 1).
In parallel with the development of the organic sector, studies have been conducted to explore Turkish consumer awareness, perception and attitudes towards organic products. The relevant factors to motivate consumers to buy organic foods are: health, quality, price, taste, freshness, environmentally friendly, and food safety (Ozsacmaci and Ergin, 2011; Cene, Karaman and Cavdar, 2013; Cabuk, Tanrikulu and Gelibolu, 2014). Akgungor, Miran and Abay, (2007) reported that educated and high-income individuals have higher interest in organic product purchases, and in their research, it was found that consumer willingness to pay for products with organic
19
labels and certified products was higher up to 36% than non-organic products. Local markets and supermarkets/ hypermarkets are the most important places for the purchase of these items (Gunden, Turkekul , Miran, Abay and Akgungor, 2010).
2.3 Methods
A qualitative survey using in-depth interviews of relevant stakeholders in Turkey was undertaken. The list of interviewees is given in Table 5 according to their area of representation. In-depth interviews are a very common research method used in qualitative marketing surveys (Dallas and Grimmer, 2007). Interviews with both sector experts and consumers were carried out following guidelines prepared in advance, which were designed to collect information about some general topics identified as relevant for the study, which included:
- Alcoholic and non-alcoholic drinks sector: changes, trends, and expectations;
- Impact of legislation on producers and consumers; - Development of organic sector and consumer awareness;
- Grape production versus wine production and consumption in Turkey.
Table 5. List of respondents
Respondent code Area of representation
E1, E2 Inspection and certification of organic products
E3, E5 Producer, trader and consultant
E4, E11 Alcoholic drinks producer and distributor
E6, E7, E8 Retailers
E9, E10 Import and export
From R1 to R15 Consumers
According to the directions of these main topics, sample questions were developed for the in-depth interviews. The sample questions developed for the experts were:
- What are the products that you work on? Have any products been
20
- What are the main difficulties you have faced in your work? For
example: supply, demand, legislation, or others?
- What kinds of effects have you experienced with the changes in the
alcoholic drinks law?
- What kind of changes have you seen in the sector? What kinds of
trends have you observed?
- Which is your main target consumer group? How do you perceive
their preferences, their awareness?
- What are the main issues in the organic sector? What is the
consumer awareness level about these products?
The sample questions developed for the consumers were: - What kind of drinks do you prefer generally? What are the
consumption habits in your family?
- Are there any alcoholic/ non-alcoholic drinks that you prefer
mainly? Is this changing for different occasions? If so, how?
- What do you think about the consumption of alcoholic drinks in
general?
- Do you have any ideas about the new alcoholic drink law? What do
you think about it? Did this law affect your life/ consumption? If so, how?
- What are the main criteria for your purchasing choices?
- Do you have any ideas about organic products? What do you think
of them?
The data obtained in the study were analysed after their coding and classification. They were also interpreted according to their authenticity, and as related to the issues that were investigated for this study.
A total of 26 in-depth interviews were carried out in Izmir and Istanbul during August 2014. The selected respondents were: two representatives from the organic sector, including certification bodies; two respondents involved in production, trade and consultancy; two alcoholic drinks sector representatives, as a producer and a distributor; three retailers; two representatives of import and export of alcoholic/
21
non-alcoholic products; 15 consumers, as five females, 10 males; <30 years old; moderate or high economic levels, according to the declarations of these consumers.
2.4 Results
2.4.1 General Consumption Habits and New Trends
According to the responses of the interviewees, the consumption habits for beverages in Turkey can be classified into three categories: (i) routine drinks; (ii) drinks preferred with meals; and (iii) occasional drinks.
Routine drinks are generally non-alcoholic beverages that are consumed daily at different times of the day, mainly because they are liked by the consumers. The first answer to the question of “What is
your favourite drink?” included non-alcoholic beverages for all of the
respondents; e.g., “I prefer coffee”, “I like tea, coffee, and soda
water”, “My favourites are cola, tea, coffee and soda water”. Parents
with children also indicated the drinks preferred by their children. Teenagers preferred carbonated drinks, such as cola, or other sweet soft drinks, such as iced tea. Coffee, tea and mineral water were the favourite routine drinks of the adults. Only one respondent indicated that koumiss6 was the favourite drink (R15).
The second category of beverages was for drinks consumed mainly with foods. Tea is part of the traditional Turkish breakfast, and it has been maintained as the first place choice for adults. Parents with small children indicated that their children prefer milk or fruit juice at breakfast. For the other meals of the day, soft drinks were preferred by the majority of the respondents, such as airan, cola and soda water, as indicated in this example: “Me and my husband prefer soda water and
airan with foods, but our son drinks cola” (R10&11). There were also
respondents who prefer alcoholic drinks with foods, as expressed as:
“I prefer raki with foods in general; if I am abroad for travelling, my
6
22 preference is wine” (R12), although this could also be considered
under the following occasional drinks category.
Occasional drinks represent the third category, and these basically include alcoholic drinks. Only one respondent never prefers alcoholic beverages, as indicated: “I tried them in the past but did not
like them. That is why I still do not drink” (R15). For almost all of the
other respondents, alcoholic beverages are preferred on different occasions, such as celebrations, meetings with friends, relaxing at weekends; as indicated: “I consume alcoholic drinks when I am with
friends” (R13).
Tea, coffee, and carbonated soft drinks remain as the most consumed products according to the respondents. Beer and raki are still the most preferred alcoholic beverages, as indicated in the words of the retailers and alcoholic drinks distributors:
“Beer, raki, wine and whisky are preferred.” (E6, E7).
“Sixty-five percent of alcoholic beverages are consumed by the consumers of 18-35 years old. Young consumers prefer beer, and wine is consumed mainly by people of 30 years old and more”
(E11).
Even if the general picture is as indicated above, there might well be regional differences, as indicated by the respondents in terms of drink preferences and brand choices:
“Beer and raki are sold in every region of Turkey. Regions at the sea-side have a bigger market share” (E4)
“In small cities or places, people with low-income levels prefer local brands that are not known at the national level” (E6)
There were other interesting statements about regional differences in the consumption of alcoholic drinks in the cities, which was considered as “conservative” by the respondents:
23 “I am from Konya, which is a very conservative city. However, even there, alcohol is consumed at an important level, but it is just not visible” (R2)
“In Konya, you cannot see alcoholic drinks in the shops, and there is no place to consume alcoholic beverages in Kayseri, but these two cities are important places for alcohol consumption” (R11)
This statement from consumer R11 was confuted by the distributor of alcoholic beverages (E11), who – on the basis of general sales and consumption data – confirmed that alcohol consumption is highest in the Marmara (especially for the Thrace side), Aegean and Mediterranean regions.
Recent developments in the beverages sector relate to energy drinks and iced tea, the sales of which have shown consistent increases. Increased consumption of iced tea has had a negative impact on the sales of fruit juice, while the age of energy drink consumers is now much lower, as their consumption is increasing among children. The role of advertising is particularly relevant here in explaining these trends: “The strong man image in the advertisements
for energy drinks have positive impacts on the increase in their consumption” (E6).
2.4.2 Impact of Health Considerations on Drink Consumption
Respondents highlighted health factors in explaining their choices. The health motives can be broken down in two sets: those related to the health of the respondents themselves; and those related to the health of their other family members, and especially of their children. Many respondents consider carbonated soft drinks as unhealthy:
“I do not consume cola and similar products, because I do not believe that they are healthy” (R13)
“In the last 4-5 years, new-young mothers do not buy cola-type beverages” (E8)
24
Respondents with health problems or excessive body weight confirmed their dislike of drinks with high sugar contents. This aspect is also important for the consumption of alcoholic drinks.
“My husband and I do not consume sweet and carbonated drinks because we have been on a diet for two years. We prefer water, herbal tea, and light soda water. Alcoholic drinks too are a remembrance of the past for us. Previously, beer was our preferred drink, but we do not drink it anymore” (R10 & R11)
“I do not consume alcoholic drinks because I believe that they are not good for health” (R9)
Wine is an alcoholic beverage that is considered as healthy if it is consumed in moderation; e.g., one glass per day.
“Health trends have had a big impact on the consumption of wine, which started in Turkey 10 years ago. People who are more sensitive about their health prefer wine, and this trend is increasing each year” (E11)
Increasing awareness about the relationships between health and food consumption was observed particularly by the female respondents, and especially the mothers. The mothers are usually responsible for the household food purchases and for food preparation. They are more careful about the health of their children. The choice of fruit juices and milk as drinks for their children has gained importance: “Fruit juices are important, especially for families with
children” (E6). However, for mothers, it is not easy to control what
their children consume, especially when they are teenagers: “Our son
is 14 years old, and now drinks cola or iced tea when he is out with his friends” (R10 & 11).
2.4.3 Wine Consumption
Turkey has big potential for the production of wine, and in recent years, the wine sector has continued to grow at increasing rates. There
25
is an increasing interest in the consumers as well, but it cannot be said that Turkish consumers are wine lovers.
“In Turkey, the wine culture is totally different from abroad. Only a small part of consumers prefers wine.” (E3)
“In Turkey, there isn’t a relevant wine culture” (E1)
It was noted during the interviews that most of the respondents had no specific preferences about the consumption of wine. This appears not to be because they do not like wine, but because their level of product knowledge is relatively low.
“I should say honestly that I do not understand well quality wine”
(R13)
“Wine consumers prefer generally cheap or moderate priced ones; as they do not have enough information about quality wine, they do not want to pay more” (E6)
Female respondents prefer wine with food or just as an occasional drink. After beer, wine is their most preferable drink. Male consumers are more interested in wine and have more knowledge about it. However, only one male consumer among those interviewed declared that wine is his first preference. For another male consumer, wine is only second to raki in his preferences. For these consumers, high wine prices are a barrier to wine purchases, such that “good wine
is expensive in Turkey due to high taxes” (R12). Even when there is
the opportunity, wine is seldom the first choice of the consumer: “I
have a wine coming from abroad which is a gift from one of my friends, but still I did not open even its package. I prefer raki” (E1). In
the words of a distributor:
“Due to an increase in awareness about health as well as economic power, consumers have started to prefer wine. Younger generations – and especially university students - prefer beer because it is cheaper. For that reason, we have produced wine with
26 a moderate price to attract the attention of young consumers. This wine is now one of our market hits” (E11).
Grape production is relevant in Turkey, but most of the production is for dried raisins. Raisin producers often also have grapes for wine production, but “in the Aegean region, they make wines just
for household consumption” (E1). As a country, Turkey has the
potential to produce good quality wines, but the domestic and foreign wine markets are still out of reach for most producers. “There are
[Turkish] wine producers that have won international awards with their wines, but there is no culture of [wine drinking in Turkey] and our wines are not well enough known abroad” (E1). High
governmental taxes on the production and sale of alcoholic beverages have pushed the sector to make substantial changes to increase product quality and reduce production costs: “Wine processors have
started to produce their own grapes with the help of experts, or they organise the producers better, give them consultancy to get grapes of better quality” (E11).
2.4.4 Organic Product Awareness
According to the respondents, consumer preferences on organic products depend on the level of awareness and knowledge they have of these types of products. All of the respondents agreed that organic products are healthier and should be preferred. Speaking of organic drinks, fruit juices are the most preferred products, apart from the ones prepared at home: “Consumers having high-quality food awareness
choose organic fruit juices, but they also prefer to prepare them at home instead of buying them” (E8). However, this awareness is
limited:
“In the domestic market, we tried to establish a small shop chain
for organic products starting from Istanbul. We started in quite important areas of Istanbul (high-income level; consumer awareness probably better; etc.). Our experience showed that the Turkish consumer is not really aware of organic products and doesn’t have sufficient information. It was one of the main issues that we needed to explain everything to them. For example, if we
27 don’t have courgettes because of the weather conditions in one week, it was so difficult to explain this to them. They want organic products with the same conditions as conventional ones. On the other hand, having an organic shop and selling products to people requires sales personnel who are aware and sufficiently knowledgeable of the organic products. It was difficult to find good sales personnel to work with us” (E3).
In recent years, the organic domestic market has continued to develop and the product range has increased:
“Fruit juice concentrates are produced mainly for exportation by organic companies as bulk products. However, there are companies that produce organic fruit juice directly for the consumption of the final consumers. For example, we have a client that made really important efforts for years to have a place in the market, and now they have succeeded. They started to export fruit juices as final products as well as selling them on the domestic market” (E1).
2.4.5 Impact of Legislative and Political Developments
Recent developments and changes to Turkish laws on alcoholic beverages have affected both producers and consumers. The respondents have different opinions about this issue. Some respondents back the restrictive policy of the current government on alcohol production, distribution, and consumption, while others do not agree, or feel uncomfortable about these new laws. It is important to underline that all of the respondents shared the opinion that alcoholic beverages should be drunk in moderation.
The current laws affect alcoholic drink producers by putting restrictions on the communication and advertising of alcoholic beverages, and by raising taxes and levies on them:
“High taxes and prohibition of advertisements are the most important problems faced now” (E4).
28
Marketing restrictions create barriers, especially to the companies who would like to enter the sector, but also to the existing producers and distributors who would like to grow. There are certain brands of raki and beer which are well known in Turkey. The companies that own these brands might not need to focus on advertising to sell their products, although advertising is one of the leverages in marketing. However, in the views of respondent E4, marketing and advertising are crucial for new start-up companies.
According to the respondents, the ban on advertising has not impacted upon sales to any significant levels:
“The new alcohol law did not affect the general sale of alcoholic beverages” (E6).
“The general alcoholic beverage sector has decreased around 5% during the last 3 years due to restrictions in the law, but the sector has found solutions to compensate for this decrease. For example, instead of advertisements, they increased their product range to attract consumers, or they have changed their bottle sizes and shapes” (E11).
High taxes are also problematic:
“The Turkish alcoholic beverage sector is faced with high taxes now; 70% of one bottle of alcoholic drink goes into taxes. Levies on alcohol are increasing every 6 months” (E4).
Other restrictions refer to the reduced purchase hours from markets and shops. However, this has also opened new areas for some entrepreneurs:
“There is a hotel in Konya which does not serve alcoholic beverages. Instead, they have interesting options like different kinds of fruits juices in specially designed bottles” (E1).
The consumer views on the new law are not convergent, though. Some consumers support the new rules, even if they are not
29
pro-government. Another group of consumers is strongly against the alcohol law. The first group concentrates on the bad effects of alcohol consumption, and especially for its intake at excessive levels. Their main idea is that alcohol is not good for both physiological and psychological health:
“I do not approve of the government in general, but regarding the
alcohol law, I agree, because alcohol consumption is not good for health” (R9).
The second group focuses on individual freedom and defends the concept that all people should have the right to choose what they want. Instead of bringing in new restrictions, it is important to increase consumer awareness and provide more education. The greater part of the respondents did not feel any impact of the law on their life. However, one of the respondents summarised its impact on her social life and feelings as:
“I used to be a ‘social drinker’, but when I was consuming alcoholic drinks, I had a guilt feeling because of social pressure”
(R3).
2.5 Discussion
The production and traditional consumption habits in Turkey are important factors in the current consumption patterns for both alcoholic and non-alcoholic drinks, although there are new tendencies and changing patterns to consider as well. Tea, coffee, soft drinks,
airan, beer, and raki are the most preferred products, which are
traditional products and/or their production is high. Ulusoy and Seker (2013) stated that the habit of traditional tea consumption is affected by the consumption demands and choices of the younger generation, which have started to promote differences. They indicated that the alternative products to tea are Turkish coffee, other coffees, and herbal and fruit teas, because of their increasing consumption, and sparkling non-alcoholic drinks are the most preferred products after tea and coffee. In parallel, soft drinks, such as cola, iced tea, and energy
30
drinks, are specifically important in the consumption of the younger generation, and especially for teenagers, as shown by the results of the present qualitative survey. On the other hand, soft drinks are often viewed as unhealthy. Consumers with children do not buy cola-type drinks, so as to keep their children away from these products. Respondents with health problems do not like them either. Attila and Cakir (2011) reported that the consumption of energy drinks is quite common in university students, and they also indicated that the awareness in the university students of the ingredients and potential health hazards of energy drinks should be increased.
Airan is already one of the most consumed of the traditional
drink products in Turkey. The consumption data and the respondent statements that airan is one of their favourite drinks with foods support each other. No consumer or market research was found regarding the other traditional drinks. Most studies have focussed on the microbiota, fermentation processes and quality characteristics of these traditional drinks (Altay, Guler, Dikmen and Heperkan, 2013; Yegin and Uren, 2008; Erten, Tangüler and Canbas 2008). Although Altay et al. (2013) stated that the trends towards natural food and beverages have increased with the consciousness of the consumers, in this context, the traditional Turkish fermented non-alcoholic beverages have gained greater attention from researchers as well as consumers more recently. However, in the present study, only one of the respondents declared that their favourite drink is koumiss, while the other traditional fermented drinks such as shalgam juice,
hardaliye, boza, and kefir were not mentioned by the respondents.
With respect to the consumption habits of alcoholic drinks, beer and raki were the most preferred products. Ozdemir (2013) indicated that “Turkish people rediscovered wine in the 1990s, which has contributing to the high quality of Turkish wine since then” (p. 5). These developments have been confirmed with the present survey, whereby health concerns, in particular, have had a positive impact on the preference for wine in recent years. However, consumers do not have sufficient perception about what is a quality wine yet. This large potential for the production of quality wines in Turkey might be
31
improved by the introduction of quality wines to the consumers in Turkey, the introduction high-quality Turkish wines abroad, and better control of the high taxes that are applied.
Indeed, the high taxes applied to alcoholic beverages, and the restrictions to their advertising and marketing are the main issues underlined regarding the latest changes in the laws. Although there appears to be no visible impact of these laws on daily life and there has been no significant change in the consumption levels, the social impact of these laws is seen in the answers of the respondents. However, consumer awareness about the negative impacts of excessive use of alcoholic drinks has become more important than restrictions by law.
2.6 Conclusion
In the present study, we initially provided a general overview of the current situation of the alcoholic and non-alcoholic beverages sector and the beverages consumption habits in Turkey. Combined with the findings of our qualitative survey, we have been able to provide an evaluation of the beverages sector and the dynamics of beverages consumption.
The food and beverages sector is one of the driving sectors in Turkey. As well as its production capacity, the population of Turkey provides an important consumer. Current consumption patterns show that tea, coffee, carbonated drinks and airan are the most preferred drinks. There is an increasing tendency for the consumption of energy drinks and iced tea particularly by the younger generation. These products have achieved an important place in the market recently. Alcoholic beverages are consumed more occasionally. Wine is becoming popular as an alternative to the most consumed products, which are beer and raki, due to the health concerns of consumers. The potential for Turkey to produce high-quality wines should be promoted, as these could achieve a significant place in the domestic and foreign markets. Consumer awareness about healthy products is increasing. In terms of organic products, there is an increasing interest