DEPARTMENT OF INFORMATION AND COMMUNICATION TECHNOLOGY 38050 Povo — Trento (Italy), Via Sommarive 14
http://dit.unitn.it/
IDENTIFYING INTRUSIONS IN COMPUTER NETWORKS BASED
ON PRINCIPAL COMPONENT ANALYSIS
Wei Wang, Roberto Battiti
December 7, 2005
Identifying Intrusions in Computer Networks
based on Principal Component Analysis
Wei Wang, Roberto Battiti
Department of Computer Science and Telecommunications
Universit`a di Trento
Via Sommarive, 14 — I-38050 Trento — Italy E-mail: [email protected], [email protected]
December 7, 2005
Abstract
Most current anomaly Intrusion Detection Systems (IDSs) detect computer network behavior as normal or abnormal but cannot identify the type of attacks. Moreover, most current intrusion detection methods cannot process large amounts of audit data for real-time operation. In this paper, we propose a novel method for intrusion identification in computer networks based on Principal Component Analysis (PCA). Each network connection is transformed into an input data vector. PCA is employed to reduce the high dimensional data vectors and identification is handled in a low dimensional space with high efficiency and low use of system resources. The normal behavior is profiled based on normal data for anomaly de-tection and the behavior of each type of attack are built based on attack data for intrusion identification. The distance between a vector and its reconstruction onto those reduced subspaces representing different types of attacks and normal activ-ities is used for identification. The method is tested with network data from MIT Lincoln labs for the 1998 DARPA Intrusion Detection Evaluation Program and testing results show that the method and model is promising in terms of identifica-tion accuracy and computaidentifica-tional efficiency for real-time intrusion identificaidentifica-tion.
1 Introduction
Computer network security is gaining worldwide attention as attacks to computer net-work systems have become more and more widespread and sophisticated. An Intru-sion Detection System (IDS) is an important component of the defense-in-depth secu-rity mechanisms in computer network systems and has been widely studied in recent years. In general, there are two main intrusion detection techniques depending on the modeling methods used: misuse detection and anomaly detection. Misuse detection identifies evidence of malicious behavior by matching it against predefined descrip-tions of attacks, or signatures. Examples of misuse detection techniques are IDIOT [1], STAT [2] and Snort [3]. Although misuse detection is effective for detecting known
attacks, it generally cannot detect new attacks that were not previously defined. Anom-aly detection, on the other hand, defines normal behavior and attempts to identify any unacceptable deviation as possibly the result of an attack. Examples of anomaly detec-tion techniques are IDES [4] and EMERALD [5]. Clearly anomaly detecdetec-tion is able to detect new attacks. However, it may also cause a significant number of false alarms be-cause the normal behavior varies widely and obtaining complete descriptions of normal behavior is often difficult.
IDSs can also be categorized as network-based IDSs and host-based IDSs accord-ing to the target environment for detection. Network-based IDSs monitor network behavior usually by examining the content as well as the format of network traffic. Host-based IDSs, on the other hand, monitor the host system behavior by examining the information of the system, such as CPU time, system calls and command sequences. Anomaly detection has been an active research area for two decades since it was origi-nally proposed by Denning [6]. Many methods have been developed for network-based anomaly detection, such as machine learning, data mining, neural networks, statistical methodology. Lee et al. [7, 8] used Data Mining (DM) techniques to extract features from network data and to build misuse detection models. The detection models gen-eralized rules that classify the data with the values of the extracted features. Liu et al. [9] proposed a new Genetic Clustering (GC) based anomaly detection algorithm. The method can establish clusters and detect network intrusions by labeling normal and abnormal groups. Eskin et al. [10] proposed a geometric framework for unsuper-vised anomaly detection and three algorithms, Cluster, K-Nearest Neighbor (K-NN) and Support Vector Machine (SVM), were used for classification. Shyu et al. [11] pro-posed a Principal Component Classifier (PCC) for network intrusion detection. They measured the Mahalanobis distance of each observation from the center of the data for anomaly detection. The Mahalanobis distance is computed based on the sum of squares of the standardized principal component scores. Heywood et al. [12] used a hierarchical neural network approach based on Self Organizing Maps (SOM) and po-tential function clustering for network intrusion detection. Sarasamma et al. [13] pro-posed a multilevel Hierarchical Kohonenen Net (HKN) for anomaly network intrusion detection. Each level of the hierarchical map is modeled as a simple winner-take-all Kohonenen net.
Intrusion detection is the first step for defending against attacks. Attack alarms from IDSs are usually reported to auto-response systems or security staff for automatic or manual appropriate response actions according to the specific attacks. Identifying attacks in real-time is therefore crucial for taking appropriate response actions as soon as possible before substantial damage is done. However, nearly all the current anomaly detection methods can only detect network behavior as normal or abnormal but cannot identify the type of attack. Relying on current anomaly detection systems, therefore, is not adequate for real-time effective intrusion prevention.
On the other hand, most current intrusion detection methods lack the capacity of real-time processing large amounts of typically high dimensional audit data pro-duced during daily operation in a computer system. In experiments carried out by MIT Lincoln Lab for the 1998 DARPA evaluation [14], for example, network traffic over 7 weeks contains four gigabytes of compressed binary tcpdump data which were processed into about five million connection records. Processing a large amount of
au-dit data in real-time is therefore essential for a practical IDS so that actions for response can be taken as soon as possible.
In our previous work [15], we used Principal Component Analysis (PCA) [16] to profile normal program and user behaviors for host-based anomaly intrusion detection. In this paper, we extend our previous work to the network environment and propose a real-time network-based intrusion identification model based on PCA. The novelty of our work lies in the following two aspects. First, the model can not only detect but also identify intrusions by profiling normal network behavior as well as various attack behaviors. This is very useful for preventing intrusions according to the associated individual type of attack. Second, the model can achieve real-time intrusion identifi-cation based on dimensionality reduction and on a simple classifier. In the proposed method, each network connection is transformed into an input data vector. PCA is em-ployed to reduce the high dimensional data vectors and identification is thus handled in a low dimensional space with high efficiency and low usage of system resources. The distance between a vector and its reconstruction onto those reduced subspaces repre-senting different types of attacks and normal activities is used for identification. The low computational expense of the distance allows a real-time performance of intrusion identification. The model is tested with network data from MIT Lincoln labs for the 1998 DARPA Intrusion Detection Evaluation Program and testing results show that the method is promising in terms of identification accuracy and computational efficiency for real-time identification.
The remainder of this paper is organized as follows. Section 2 describes the pro-posed intrusion identification model. The details of the experiments and the testing results are given in Section 3. Concluding remarks follow in Section 4.
2 The Intrusion Identification Model Based on
Princi-pal Component Analysis
2.1 Principal Component Analysis
Principal Component Analysis (PCA, also called Karhunen-Loeve transform) is one of the most widely used dimensionality reduction techniques for data analysis and compression. It is based on transforming a relatively large number of variables into a smaller number of uncorrelated variables by finding a few orthogonal linear combi-nations of the original variables with the largest variance. The first principal component of the transformation is the linear combination of the original variables with the largest variance; the second principal component is the linear combination of the original vari-ables with the second largest variance and orthogonal to the first principal component and so on. In many data sets, the first several principal components contribute most of the variance in the original data set, so that the rest can be disregarded with minimal loss of the variance for dimension reduction of the data [16, 17]. The transformation works as follows.
by a vector of length m, the data set is thus represented by a matrix Xn×m Xn×m= x11 x12 · · · x1m x21 x22 · · · x2m · · · · · · · · · · · · xn1 xn2 · · · xnm = £ x1, x2, · · · , xn ¤ (1)
The average observation is defined as
µ = 1 n n X i=1 xi (2)
The deviation from the average is defined as
Φi= xi− µ (3)
The sample covariance matrix of the data set is defined as
C = 1 n n X i=1 (xi− µ)(xi− µ)T = 1 n n X i=1 ΦiΦTi = 1 nAA T (4) where A = [Φ1, Φ2, · · · , Φn].
To apply PCA to reduce high dimensional data, eigenvalues and corresponding eigenvectors of the sample covariance matrix C are usually computed by the Singu-lar Value Decomposition (SVD) [18]. Suppose (λ1, u1), (λ2, u2), · · · , (λm, um) are
m eigenvalue-eigenvector pairs of the sample covariance matrix C . We choose the k
eigenvectors having the largest eigenvalues. Often there will be just a few large eigen-values, and this implies that k is the inherent dimensionality of the subspace governing the ”signal” while the remaining (m − k) dimensions generally contain noise [17]. The dimensionality of the subspace k can be determined by[16]
Pk i=1λi
Pm
i=1λi
≥ α (5)
where α is the ratio of variation in the subspace to the total variation in the original space. We form a m × k matrix U whose columns consist of the k eigenvectors. The representation of the data by principal components consists of projecting the data onto the k-dimensional subspace according to the following rules[17]
yi= UT(xi− µ) = UTΦi (6)
2.2 The proposed intrusion identification model
There are three steps for identifying the individual type of attacks:1. Profiling normal behavior based on normal data and behavior of each type of attack based on associated type of attack data.
Suppose there are p types of behaviors including 1 for normal and (p − 1) for at-tacks. Given n vectors x1, x2, · · · , xnrepresenting the observations of one type of data
as an example, the average vector µ and each mean-adjusted vector can be computed by (2) and (3). m eigenvalue-eigenvector pairs (λ1, u1), (λ2, u2), · · · , (λm, um) of
the sample covariance matrix C of the data set are then calculated.
The number of principal eigenvectors u1, u2, · · · , uk(k ¿ m), used to represent
the distribution of the original data, is often determined by (5). Any data vector in the training set of individual type of data can be approximately represented by a linear combination of k eigenvectors so that the dimensionality of the data is reduced without sacrificing valuable information. The subspace spanned by the eigenvectors is then regarded as the eigenspace of each type of data.
2. Determining if the network connection is normal or anomalous.
Given a new data vector t that represents a test network connection, we project it onto the k-dimensional subspace representing the normal behavior according to the rules defined by (6). The distance between the test data vector and its reconstruction onto the subspace is the distance between the mean-adjusted input data vector Φ = t − µ and
Φf = U UT(t − µ) = U y (7)
If the test data vector is normal, that is, if the test data vector is very similar to the normal training vectors, the test data vector and its reconstruction will be very similar and the distance between them will be very small [16]. On this property our intrusion identification model is based. As PCA seeks a projection that best represents the data in a least-square sense, we use the squared Euclidean distance in the experiments to measure the distance between these two vectors:
ε = kΦ − Φfk2 (8)
ε is characterized as the identification index. If ε is below a predefined threshold θa
determined by normal training data, the vector is then identified as normal. Otherwise it is identified as anomalous.
3. Identifying the test data as an individual type of known attack or a new attack. If the test data vector is anomalous, it is then projected onto subspaces representing various types of attacks. Similarly, for the test vector to be identified, calculates the Euclidean distance between the new vector and its reconstruction onto each subspace formed by individual type of attack and finds the minimum εi. If εiis below the
pre-defined threshold θifor a certain individual type of attack, the vector is then identified
as this type of attack. Otherwise it is identified as a new attack.
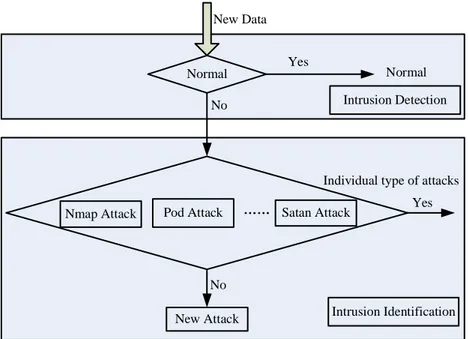
If the new test data is identified as an individual type of attack, it is added to the original set of this type of attack. Otherwise if it is identified as a new attack, it will be reported to the technical staff for further investigation and it may create a new individ-ual type of attack for further identification based on the proposed model. The intrusion identification steps of the model are described in Fig. 1.
Normal New Data Yes No No New Attack Intrusion Detection Intrusion Identification Nmap Attack Pod Attack …… Satan Attack
Individual type of attacks Normal
Yes
Figure 1: The intrusion identification steps
3 Experiments and testing
3.1 Data set
We used network data in the experiments to validate the proposed model. The net-work data is distributed by MIT Lincoln Lab for 1998 DARPA evaluation and has been widely used for evaluating various intrusion detection methods [14].
The data contains traffic in a simulated military network that consists of hundreds of hosts. Altogether the data includes 7 weeks of training set and 2 weeks of test set that were not from the same probability distribution as the training set. Since the probability distribution is not the same, in our experiments, we only use the training set and sample one part of the data for training and another part of the data for testing. The raw training set of the data contains about 4 gigabytes of compressed binary tcpdump data of network traffic and it was pre-processed into about 5 million connection records by Lee et al. [7, 8] as part of the UCI KDD archive [19]. A connection is a sequence of TCP packets starting and ending at some well defined times, between which data flows from a source IP address to a target IP address under some well defined protocol [19]. In the 10% subset data, each network connection is labeled as either normal, or as an exactly one specific kind of attack.
A connection of the network data contains 41 features. These features were ex-tracted by Lee et al. from the raw data divided into three groups: basic features of individual TCP connections, traffic features and content features within a connection
suggested by domain knowledge. Among these 41 features, 34 are numeric and 7 are symbolic. Only the 34 numeric features were used in the experiments. Each connection in the data set is thus transformed into a 34-column vector as data input for detection and identification. There are 494,021 connection records in the training set in which 97,277 are normal and 396,744 are attacks. There are 22 types of attacks in total in the subset and these attacks fall into one of 4 categories:
• DoS: denial-of-service (e.g. teardrop).
• R2L: unauthorized access from a remote machine (e.g. password guessing). • U2R: unauthorized access to local superuser (root) privileges by a local
unprivi-leged user (e.g. buffer overflow attacks).
• PROBE: surveillance and other probing (e.g. port scanning).
We group the network data into individual type of attack connections and normal connections for data preparation.
3.2 Experiments and Testing Results
3.2.1 Testing results for detecting intrusionsIn the experiments for detecting intrusions, no attempt is made to distinguish differ-ent types of attacks. In the real computer network environmdiffer-ents, collection of large amounts of precisely normal data is often difficult for an practical IDS. In the ex-periments, a smaller data set, 7,000 normal network connections, are thus randomly selected for training the normal model and a very large data set, randomly selected 10,000 normal network connections and all the 396,744 attack connections are used for detection.
In the experiments, we use Receiver Operating Characteristic (ROC) curves to eval-uate the intrusion detection performance of our model. The ROC curve is the plot of Detection Rates (DR), calculated as the percentage of intrusions detected, against False Positive Rates (FPR), calculated as the percentage of normal connections falsely clas-sified as intrusions. There is a tradeoff between the DR and FPR and the ROC curve is obtained by setting different threshold θaon the identification index defined by (8).
To evaluate the impact of the ratio α defined in (5) on the performance of the intrusion detection model, we use different number of major components in the experiments and the testing results of overall data are shown in Fig. 2. In the experiments, only 1 major component can account for 90.079% of the total variation and 2 major components can account for that of 99.953%. From the ROC curve shown in Fig.2, it is observed that the testing results are related to the ratio α. The testing results are the best when the ratio is about 99.9% and this suggests that we use the ratio α as 99.9% in the experi-ments.
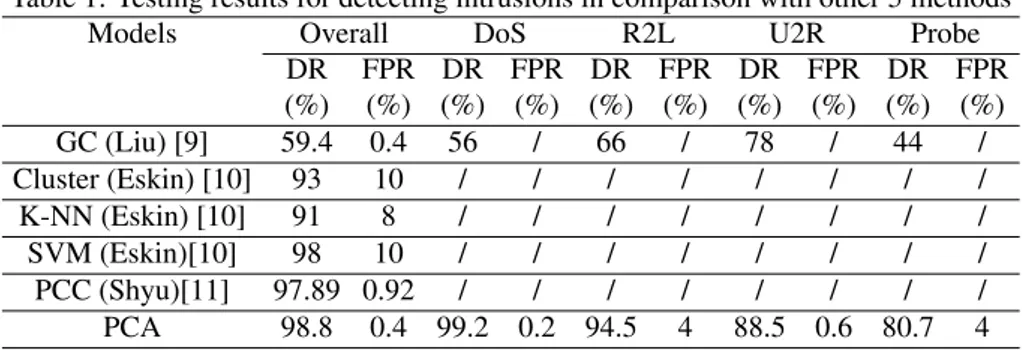
To evaluate the detection performance of our model, we summarize the detection rates and false positive rates of the four attack categories as well as the overall in Table 1 in comparison with other 5 methods reported in [9] [10] [11] and briefly described in section 1. We conduct the experiments on each category of the attack data to investigate
Table 1: Testing results for detecting intrusions in comparison with other 5 methods
Models Overall DoS R2L U2R Probe
DR FPR DR FPR DR FPR DR FPR DR FPR (%) (%) (%) (%) (%) (%) (%) (%) (%) (%) GC (Liu) [9] 59.4 0.4 56 / 66 / 78 / 44 / Cluster (Eskin) [10] 93 10 / / / / / / / / K-NN (Eskin) [10] 91 8 / / / / / / / / SVM (Eskin)[10] 98 10 / / / / / / / / PCC (Shyu)[11] 97.89 0.92 / / / / / / / / PCA 98.8 0.4 99.2 0.2 94.5 4 88.5 0.6 80.7 4
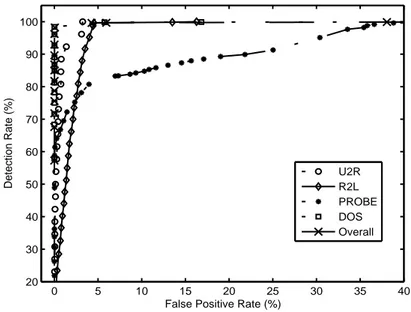
the detection performance of our model on different categories of attack data. Fig. 3 shows the ROC curves of the detection performance of our model on four categories of attack data as well as overall data.
From Table 1 and the ROC curves shown in Fig. 2-3, it is observed that our model is able to detect most attacks with low false positive rates. In more details, our model can detect very high percentage of DOS and U2R attacks with a small number of R2L and PROBE attacks missed.
In the experiments, we used randomly selected normal data of the training set for establishing normal behavior and used nearly all the other data in the same set for de-tection. The GC method [9] also used the training set both for training and detection but only with a very small part of the data. In the Cluster, K-NN and SVM methods [10], many attack data are filtered so that the resulting data set consisted of 1 to 1.5% attack and 98.5 to 99% normal instances for unsupervised anomaly detection. The PCC method [11] used the same data set as ours both for training and detection but also with a smaller data size. From Table 1, it can be seen that our model is better than the other first four methods in terms of detection rates and false positive rates. The DM method [7], HKN method [13] and SOM method [12] used both of the normal data and attack data of the training set for defining attack signatures or for building detection models and used the test set for detection. The DM method achieved a 80.2% detection rate and HKN method achieved 93.46% detection rate at 3.99% false positive rate while SOM method obtained 89% detection rate at 4.6% false positive rate. The detection performance of the PCC method is almost as the same as our PCA model. The PCC method measured the Mahalanobis distance of each observation from the center of the data for anomaly detection. Any observation that has the distance larger than a thresh-old is considered as an anomaly. The Mahalanobis distance is then computed based on the sum of squares of the standardized principal component scores. The PCC method used both principal components and minor components of the sample in the detection stage. Our PCA method directly reduce the high dimensional data into low dimen-sional space and use the distance between each observation and its reconstruction on the reduced subspace for anomaly detection. Only principal components are required to form the subspace and the detection scheme is straightforward and easy to handle. The PCC method used 5 principal components and 6-7 minor components in the
ex-0 5 10 15 20 25 30 97 97.5 98 98.5 99 99.5 100
False Positive Rate (%)
Detection Rate (%)
Ratio=90.079% Ratio=99.953% Ratio=99.981% Ratio=99.995%
Figure 2: ROC curves for different ratio α used in the experiments
0 5 10 15 20 25 30 35 40 20 30 40 50 60 70 80 90 100
False Positive Rate (%)
Detection Rate (%) U2R R2L PROBE DOS Overall
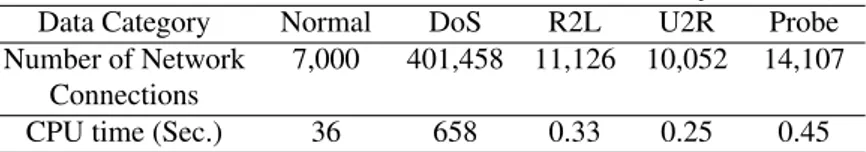
Table 2: CPU Time for Training and detection
Training Detection (each category of attack data includes 10,000 normal network
connections for anomaly detection)
Data Category Normal DoS R2L U2R Probe
Number of Network 7,000 401,458 11,126 10,052 14,107 Connections
CPU time (Sec.) 36 658 0.33 0.25 0.45
periments while our PCA method only used 2 principal components and achieved little better detection results. The PCC method assumes that the sum of squares of several standardized principal component follows a chi-square distribution. Our model avoids any data distributional assumption and would be more practical for application.
Our method is computationally efficient for intrusion detection once the model is built. During the detection stage, the squared Euclidean distance between a test vector and its reconstruction onto the subspace is used for detection. Calculations for each test network connection take O(2m(k + 1)), where m is the dimension of each vector representing each network connection and k is the number of principal components used in the model. Experimental results show that after the high dimensional data is reduced, the original data can be represented by the linear combination of only a very small number of principle components without sacrificing valuable information. In the experiments, for example, the use of only 2 principle components out of 34 dimensions can represent the original data with less than 0.1% loss of the total variation. Therefore, the original data can be largely reduced for intrusion detection and k is very small. Because the subspace is low dimensional and the classifier is simple, the detection algorithm can be largely reduced and little computational effort is required for the detection. Moreover, system resources could be largely saved for low dimensional data which are conveniently stored and transmitted.
In the experiments, our method is evaluated on 10,000 normal network connections and all the attack connections. Thus over 400,000 network connections are included. We measure the CPU times for detection on a computer with 2.4GHz Pentium CPU and 512 DDR MB memory and the testing results are shown in Table 2. It can be observed that detection is very efficient. For example, less than 1 second is required for detecting about 15,000 network connections. It shows that our model is suitable for real-time anomaly detection on network data. On the contrary, many anomaly detection methods were evaluated only on a small data size and may not applicable in the real environments with massive data streams.
3.2.2 Testing results for identifying individual type of attacks
In the experiments, we profile behavior of each type of attack for intrusion identifica-tion. If a test network connection is detected as an intrusion, it will be identified as an individual type of known attack or as a new attack according to the behaviors of
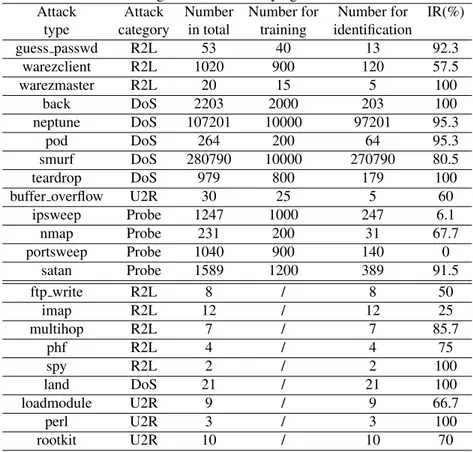
indi-Table 3: Testing results for identifying individual attacks
Attack Attack Number Number for Number for IR(%)
type category in total training identification
guess passwd R2L 53 40 13 92.3 warezclient R2L 1020 900 120 57.5 warezmaster R2L 20 15 5 100 back DoS 2203 2000 203 100 neptune DoS 107201 10000 97201 95.3 pod DoS 264 200 64 95.3 smurf DoS 280790 10000 270790 80.5 teardrop DoS 979 800 179 100
buffer overflow U2R 30 25 5 60
ipsweep Probe 1247 1000 247 6.1 nmap Probe 231 200 31 67.7 portsweep Probe 1040 900 140 0 satan Probe 1589 1200 389 91.5 ftp write R2L 8 / 8 50 imap R2L 12 / 12 25 multihop R2L 7 / 7 85.7 phf R2L 4 / 4 75 spy R2L 2 / 2 100 land DoS 21 / 21 100 loadmodule U2R 9 / 9 66.7 perl U2R 3 / 3 100 rootkit U2R 10 / 10 70
vidual type of attacks. In the experiments for identifying intrusions, randomly selected 7,000 normal network connections are also used for building normal network behavior and all the attack data are used either for profiling attack behaviors or for identification. In the data set, the number of network connections for each type of attack are quite dif-ferent. For example, There are 280,790 network connections for smurf attack while there are only 3 connections for perl attack. In the experiments, we profile the behav-iors of 13 types of attacks that have a large number of network connections and use the other 9 types of attacks that have a small data size for identifying new attacks since it is difficult to build stable behavior with small number of network connections. We then use the former 2,000 back, 10,000 Nepture, 200 Pod, 20,000 Smurf, 800 Teardrop, 40 Guess passwd, 900 Warezclient, 1000 Ipsweep, 900 Portsweep, 1200 Satan, 200 Nmap, 15 Warezmaster, 25 buffer overflow attack in the data set for modeling associ-ated behavior of each type of attack. All the other network connections of these types of attacks are used for identification and all the data of other 9 types of attacks, not used for building the attack behavior, are used for identification as new attacks.
for new attacks. If the threshold θifor one type of attack is set large, the identification
rate for this type of attack will be high but the identification rate for new attacks will be low. In the experiments, we set the threshold for individual type of attack as the largest distance between each training vector and its reconstruction onto the subspace and the testing results of the identification rates are shown in Table 3. The data used in the experiments are also described in the table. It is observed that our model is effective for identifying most types of attacks while ipseep and portsweep attack are difficult to identify. Our model can also identify most new attacks. It is effective for identifying individual type of attacks as well as new attacks.
4 Concluding remarks
In this paper, we proposed a novel method based on Principal Component Analysis (PCA) for intrusion identification. Intrusions are detected based on normal behavior for anomaly detection while the individual type of attack or a new attack is identified based on the behavior of each type of attack for intrusion identification. The proposed model, therefore, can not only detect new attacks, but also identify individual types of attacks. It thus enables intrusions to be prevented as soon as possible by appropriate response actions according to the types of intrusions identified.
As the volume of related information is explosively increasing nowadays, process-ing large amounts of audit data for real-time intrusion detection and identification is crucial for quick response against attacks. In the proposed model, each network con-nection is transformed into a data vector by its features extracted and PCA is employed to reduce the high dimensional data vectors. The identification index of a network con-nection is represented as a single number as the Euclidean distance between the data vector and its reconstruction on the reduced subspace. Behavior of each type of attack and normal activities are then easily profiled and intrusion identification is easily im-plemented without any additional classifier. It is thus an effective model to process a high quantity of audit data in real-time with low overhead and it is suitable for real-time intrusion identification.
In many cases for practical computing environments, large part of audit data is nor-mal and easily collected while a snor-mall part of audit data is abnornor-mal and difficult to collect. Building behavior of individual type of attacks is difficult in this case. How-ever, it is effective to detect abnormal behavior based on our model during its running in practical systems. The security staff can investigate and identify which type of at-tack the abnormal behavior belongs to and then manually add the identified atat-tack into the database of associated type of attacks. In this way, the longer IDS runs, the more complete the attack database is. The IDS is trained with individual attack database as well as with the normal database periodically to obtain the complete behavior so that the model becomes more and more effective for intrusion identification.
Extensive experiments are conducted to test our model and to compare with the results of other methods reported in the recent literature. Testing results show that our model is promising in terms of detection accuracy and computational efficiency for real-time intrusion detection. It achieves a detection rate as high as 98.8% at a false positive rate of 0.4% for anomaly detection for overall data. The model is also effective
to identify most individual known attacks as well as new attacks. For the future work, we are developing a online self-adaptive intrusion identification model for updating each individual attack database dynamically and automatically and thus improving the identification rates.
5 Acknowledgement
We acknowledge support from project WILMA (Province of Trento) and project Quasar (MIUR - Italy).
References
[1] S.Kumar and E.H.Spafford. ”A Software architecture to support misuse intrusion de-tection”, Proceedings of the 18th National Information Security Conference, pp.194-204,1995.
[2] K.Ilgun, R.A.Kemmerer, P.A.Porras. ”State transition analysis: A rule-based intrusion detection approach”, IEEE Transactions on Software Engineering, vol.21,no.3,pp.181-199,1995.
[3] SNORT, http://www.snort.org.
[4] T. Lunt, A. Tamaru, F. Gilham, et al, ”A Real-time Intrusion Detection Expert System (IDES) - final technical report”, Technical report, Computer Science Laboratory, SRI In-ternational, Menlo Park, California, Feb. 1992.
[5] P. A. Porras, and P.G.Neumann, ”EMERALD:Eventmon-itoring enabling responses to anomalous live disturbances”, Proceedings of National Information Systems Security Con-ference, Bal-timore MD, October 1997.
[6] D. E. Denning, ”An intrusion-detection model”, IEEE Transactions on Software Engineer-ing. vol.13, no.2, pp.222-232, 1987.
[7] W. Lee, S. Stolfo, K. Mok, ”A data mining framework for adaptive intrusion detection”, Proceedings of the 1999 IEEE Symposium on Security and Privacy, Los Alamos, CA, pp. 120-132, 1999.
[8] W. Lee, S. Stolfo, ”A Framework for constructing features and models for intrusion detec-tion systems”, ACM Transacdetec-tions on Informadetec-tion and System Security, vol. 3, no. 4, pp. 227-261, 2000.
[9] Y. Liu, K. Chen, X. Liao, et al, ”A genetic clustering method for intrusion detection”, Pattern Recognition, vol. 37, no. 5, pp. 927-942, 2004.
[10] E. Eskin, A. rnold, M. Prerau, L. Portnoy, S. Stolfo, ”A Geometric framework for unsu-pervised anomaly detection”, Applications of Data Mining in Computer Security. Kluwer Academics, 2002.
[11] M. Shyu, S. Chen, K. Sarinnapakorn, L. Chang, ”A Novel Anomaly Detection Scheme Based on Principal Component Classifier”, Proceedings of the IEEE Foundations and New Directions of Data Mining Workshop, in conjunction with the Third IEEE International Conference on Data Mining (ICDM’03), pp. 172-179, 2003.
[12] H. Kayacik, A. Zincir-Heywood, and M. Heywood, ”On the capability of an SOM based intrusion detection system”, in Proc. IEEE Int. Joint Conf. Neural Networks (IJCNN’03), pp. 1808-1813, 2003.
[13] S.T.Sarasamma, Q.A.Zhu, J.Huff, ”Hierarchical Kohonenen net for anomaly detection in network security”,IEEE Transactions on Systems, Man and Cybernetics, Part B, vol. 35, no. 2, pp. 302-312, 2005.
[14] MIT Lincoln Laboratory-DARPA Intrusion Detection Evaluation Documentation, http://www.ll.mit.edu/IST/ideval/docs/docs index.html, 1999.
[15] W. Wang, X. Guan and X. Zhang. ”A Novel Intrusion Detection Method Based on Principal Component Analysis in Computer Security”, Advances in Neural Networks-ISNN2004, International IEEE Symposium on Neural Networks, Dalian, China. Lecture Notes in Computer Science (LNCS), No. 3174. pp. 657-662. Aug 2004.
[16] I.T. Jolliffe, ”Principal Component Analysis”, 2nd Ed., Springer-Verlag, NY, 2002. [17] R. O. Duda, P. E. Hart, and D. G. Stork, ”Pattern Classification”, China Machine Press,
Beijing, 2nd edition, 2004.
[18] G. H. Golub, C. F. Van Loan, ”Matrix Computation”, Johns Hopkins Univ. Press, Balti-more, 1996.