The Aging of Population: Expenditure on
Education and Social Security
Piero Radogna
Facultat d’Economia i Empresa, Universitat de Barcelona
June 2015
Thesis supervised by Xavier Raurich Puigdevall and Montserrat Vilalta - Bufí
Abstract
We analyze the e¤ects of population aging on public expenditure when government is not fully e¢ cient. We build an overlapping gener-ations model in which government collects money from the households through a proportional tax on wages and redistributes the resources in the form of pensions and a subsidy to education. The individual votes for the level of public assistance to receive in order to maximize her util-ity. We …nd that the solution of the model depends on the preferences of the median voter and that as population ages, more pensions are demanded in the economy relative to the subsidy to education, which makes the individuals invest less in the human capital formation of their children and lead economy to be less productive. We also demonstrate that government ine¢ ciency plays a crucial role in the redistribution of resources and that the solution of such an ine¢ ciency gap may slow down the negative e¤ects of population aging.
Acknowledgements
I thank my supervisors for their help and patience in following me in this research studying, my family and friends for the support they gave me day by day and my master colleagues for sharing with me this wonderful experience. Last but not least, thanks to G. for the inspiration she gives me.
1
Introduction
The improvement in the standards of living, resulting from both the betterment in the health sector and in the socioeconomic wellbeing that the industrial economies experienced in the past decades, led to an increase in the number of retired people eligible to receive old-age social security. In the past sixty years, the median age of the population has increased from 29 to 37 years and is expected to increase more in the next century, reaching a median age of 45 years in the developed world - United States, Europe, Japan - and of 36 in the developing world - Africa, Latin America, South eastern Asia.1
Data from the OECD countries indicate that the dependency ratio of old people - 65 and more years old - and people in the working age - 15 to 64 years old - almost doubled from 12:36% in 1950 to 21:25% in 2013 and is expected to reach a value of 36:26% in 2050, as a consequence of the population aging. This led to an increasing trend in the share of government spending devoted to old-age pensions, which, in the majority of the industrial economies, is the largest component of the transfers operated by the government, with a share of almost 17% in average in the OECD countries for the year 2009, over a total share of 33% of the government spending devoted to social protection.
On the contrary, the share of government spending devoted to education is usually the third voice of the public budget, with a share of 13% in average in the OECD countries for the year 2009, forerun by the public spending in health with a share of almost 15%.
The limited resources of the public sector, mainly coming from tax collec-tion, force the governments to make a continuous choice between investments in productive sectors - as education - and non-productive ones - social security and health sector - with evident consequences on economic growth. Indeed, on one side, greater investments in education drive to the formation of hu-man capital which in turns leads to an increase in the level of the GDP per capita. On the other side, when the greater share of the government spending is devoted to pensions, households gains more utility from posticipating their consumption, with a contraction in GDP per capita.
In our paper we introduce an overlapping generations model in which the government collects money from the households through a proportional tax on wage and redistributes the resources among agents in the form of pensions and a subsidy to education. Pensions are paid to the retired agents living in the reference period, while the subsidy is paid to the households who use it to partially …nance education to their children. The human capital accumulated by the young agents living in the economy is used in the following period as an input in the production function and thus, increases the level of GDP per capita. We assume a majority of working individuals in the economy, hence
government maximizes the utility of the adult agents by choosing the optimal rate of the proportional tax on wage and the optimal level of the subsidy to education and taking into account their preferences between current and future consumption, as well as the altruism they have towards their children and par-ents. Moreover, government decision on how to allocate its total expenditure is the result of a voting process in which the median voter’s preference on either the education to supply to her children or the pensions used by her parents to …nance their current consumption plays a crucial role in determining the productivity of the economy.
We demonstrate that, as population ages, more pensions are demanded and, keeping constant the rate of the proportional tax on wage, a lower subsidy to education is o¤ered to households. As a consequence of that, economy becomes less productive. Furthermore, we also introduce a certain degree of ine¢ ciency in the public sector of the economy and explore the consequences of such ine¢ ciency in the amount of resources that the government is able to redistribute.
Previous literature has focused its attention on the relationship between population aging and public expenditure, both in the form of expenditure on education and expenditure on social protection.
McDonald and Budge (2005) …nd out that the proportion of the popula-tion aged 65 and older has a strong positive in‡uence on government social spending, after controlling for the ideology of the political party in power. On the other hand, Disney (2007), using data of 21 countries from the OECD, shows that the size of the welfare state is positively related to the relative size of the population aged 65 and older, this time controlling for economic and social factors.
The combined results of McDonald and Budge (2005) and Disney (2007) imply that, controlling for both political and economic factors, as population ages, the greater number of older people living the economy forces the govern-ment to shift its investgovern-ment decisions to less productive voices of its budget.
The model we set up in this paper is close to the one presented by Razin, Sadka and Swagel (2002). They study the e¤ects of population aging de-veloping an overlapping generations model of intra-generetional transfers and human capital formation. Their main result is that, as the dependency ratio of old to adult agents falls, government reacts with either an increase of tax rate or a decrease in its transfers’generosity. Such conclusion is similar to the result we obtain from our paper.
Similar mechanisms are pointed out by Bongaarts (2004), who focuses his attention on the payment schemes of the pensions systems in the OECD coun-tries. His …ndings are interesting for our purposes and are partially con…rmed by our model. Indeed, Bongaarts (2004) shows empirically that, as the ratio of working households to retired ones falls, the share of public expenditure
devoted to pensions is destined to increase in the next decades.
Nonetheless, both Razin, Sadka and Swagel (2002) and Bongaarts (2004) focus their attention on the consequences of the population aging on the pen-sions system only.
In contrast with that, we explore the consequences of population aging on both the expenditure in education and the security system of the economy.
A conspicuous part of the literature on economic growth explores the re-lationship between public education and public pensions in the framework of an overlapping generations model with government transfers. Among the oth-ers, Glomm and Kaganovich (2003) model an economy in which government allocate its resources between education and a pay-as-you-go pensions system. Parents’decisions to invest resources in education of their children are moti-vated by altruism, a feature that we also include in our model. Their …ndings are mainly aimed in showing the changes in the formation of human capital, rather than the e¤ects of population aging.
On the other hand, Boldrin and Montes (2009) use micro and macro data for Spain to show that, when demographic changes are allowed in the model, the redistribution of resources operated by the government is not e¢ cient. Nonetheless, population aging does not necessarily make the future generations to be worst o¤, a conclusion that we also share.
The paper is organized as follow. In Section 2 we set up the model and study its equilibrium. In section 3 we calibrate the benchmark model and present the result of its numerical simulation. In section 4 we compute the comparative statistics in order to show the e¤ects of the population aging, as well as those of the government ine¢ ciency. Section 5 presents empirical evidences of the theoretical model. Section 6 concludes.
2
The Model
Consider a small open economy populated by overlapping generations who live for three periods. Firms, households and the public sector are active in the economy.
2.1
Firms
Firms operating in the economy produce a single …nal good by means of a neoclassical aggregated production function with constant returns to scale,
with 2 [0; 1], where A is the productivity level of the economy, Kt is the
aggregated capital stock in period t and Ht is the aggregated stock of human
capital, in period t. Human capital depends positively on the education that agents received when they were young, Ht= Nt et 1, where and 2 [0:1] are
respectively the productivity of education and the elasticity of human capital to education.
The production function per unit of human capital is obtained by dividing both sides of the production function by Ht,
b
yt= Abkt: (2)
Note that, for any variables xt, it holds the following condition
bxt=
xt
ht
; (3)
Hence, in equation (2), bkt = KHtt = khtt is the capital per human capital,
where ht= et 1.
We assume an exogenous interest rate which is equal to r. Moreover, we assume that capital fully depreciates at the end of each period.
Firms are assumed to behave according to perfect competition, hence each production factor (i.e. Kt and Ht) pays its marginal productivity, therefore,
b R = Abk 1 (4) and b w = (1 )Abk (5) Where bR = 1 +br.
Hence, for any given interest rate r it is possible to …nd its associated value of per capita capital bk and wage w.b
The GDP per capita, on the other hand, is equal to
yt= (w + bb Rbkt)ht: (6)
2.2
Households
Individuals in the economy live for three periods. At the beginning of each period a new generation is born, while agents make economic decisions only
in the last two periods of their life. In the …rst period, when they are young, agents neither work nor consume, but receive education by their parents; in the second period, sub indexed with t, agents are adult and work, while in the third one, sub indexed with t + 1, individuals are old and they are retired.
Individuals belonging to the generation living in period t maximize the following logarithmic utility function,
u(cyt; cot+1; et; cot; c) = ln (c y
t) + ln cot+1 + ln(et) + ln(cot c) (7)
where cyt is the consumption of the agent in the current period, when she
is adult, co
t+1 is the consumption of the agent in the future period, when she
is retired, et is the education that the household pays to her children born in
t 1, cot is the consumption of old agents in the current period (i.e. the
con-sumption of the parents of the maximizing household), and c is their minimum consumption level. The inclusion of c is an important feature in our model, since it reduces the budget of the old agents living in period t and incentivates the demand for pensions.
Therefore, the altruistic household receives utility from giving to both her children and parents, besides the utility she gets from her consumption in the present and in the future period.
The parameters , and explain, respectively, the temporal discount factor between current and future consumption, the altruism that the house-holds has towards her children and the interest that she has with respect to her parents’wellbeing.
In the framework of the model, individuals make their decisions subject to a budget constraint. On one hand, adult agents use their net income to …nance their current consumption, to save for future consumption and to pay education to their children, which cost is lowered by a subsidy paid by the government.
Thus,
(1 t)whb t = cyt + st+ (1 t)et (8)
where t is a proportional tax on income whb t 1, st are the savings and t
is the subsidy paid by the government which, in turns, is …nanced by taxes. On the other hand, old agents …nance their consumption in the future using the savings, augmented by the interest rate and the pension paid by the government.
Thus,
where pt+1 is the pension paid by the government in the future period
which, in turns, is …nanced by taxes.
Solving (9) with respect to st and substituting it into (8) it is possible to
obtain the intertemporal budget constraint, which is the restriction that the individual faces when she maximizes the intertemporal utility function,
(1 t)whb t = cyt + st= co t+1 b R pt+1 b R + (1 t)et (10)
2.3
Government
As already pointed out, young agents living and working in period t pay a proportional tax t on their wage whb t 1. Government uses the collected taxes
to …nance education, through the subsidy t, and to provide pensions ptto the
old agents living in the current period. Thus, the following condition holds,
twhb tNt= tetNt+ ptNt 1 (11)
where again Ntis the total number of agents working in period t. Note that
there might be a source of government ine¢ ciency driven by the parameter 2 [0; 1]. Indeed, for < 1, not the entire amount of taxes collected by the government is distributed among the individuals in the form of subsidy to education and pensions. This might be because of the presence of tax collecting costs or corruption in the government.
From the government’s budget constrain we can obtain the equation for the pensions,
pt= (1 + n)( twhb t tet) (12)
where n > 0 is the population growth rate.
2.4
Equilibrium
The economy is in an equilibrium when the production and consumption sides, as well as the public sector are in equilibrium.
For a given interest rate r, equations (4) and (5) give the capital and the wage per unit of human capital which ensure the equilibrium.
The maximization of (7) with respect to (10) leads to the following …rst order conditions for the current and future consumptions and education,
cyt = 1 (1 + + ) (1 t)whb t 1+ pt+1 b R ; (13) cot+1 = Rb (1 + + ) (1 t)whb t 1+ pt+1 b R (14) and et= (1 + + )(1 t) (1 t)whb t 1+ pt+1 b R (15)
Note, in particular, that the condition for education clearly shows that an increase in the amount of the subsidy tprovided by the government increases
the stock of education that households want to supply to their children. Fur-thermore, the condition for the current consumption of old agents remarks that they receive utility from both the pension they receive in t and the wage they earned in t 1, which in turns depends on the education they received in t 2.
The government maximizes the utility function expressed by (7), given the optimal conditions for the current and future consumptions and education in order to choose those values of proportional tax on wage and subsidy to education which maximize
Vt(cyt; cot+1; et; cot; c) = ln (c y
t) + ln cot+1 + ln(et) + ln(cot c): (16)
Substituting equations from (13) to (15) into the indirect utility function (16) and derivating it towards t and t, the government sets the equilibrium
values of tax and subsidy that maximize the household utility function,
t = b Rwhb t+ pt+1 (1 + + + ) bRwhb t (17) (1 + + )h R(1b t 1)whb t 1 (1 + n) tet (1 + + )c i (1 + + + ) (1 + n) whb t and t = b R(1 t 1)whb t 1+ (1 + n) twhb t (1 + + ) c ( + ) (1 + n)et ( + ) (18)
3
Calibration and Results
In order to show the e¤ects of population aging on the equilibrium value of the proportional tax on wage and the one of the subsidy to education, we carry out a numerical simulation of the model. We calibrate the model under the assumption that each period t is twenty-…ve years long. The parameters are calibrated so to replicate data from the OECD.
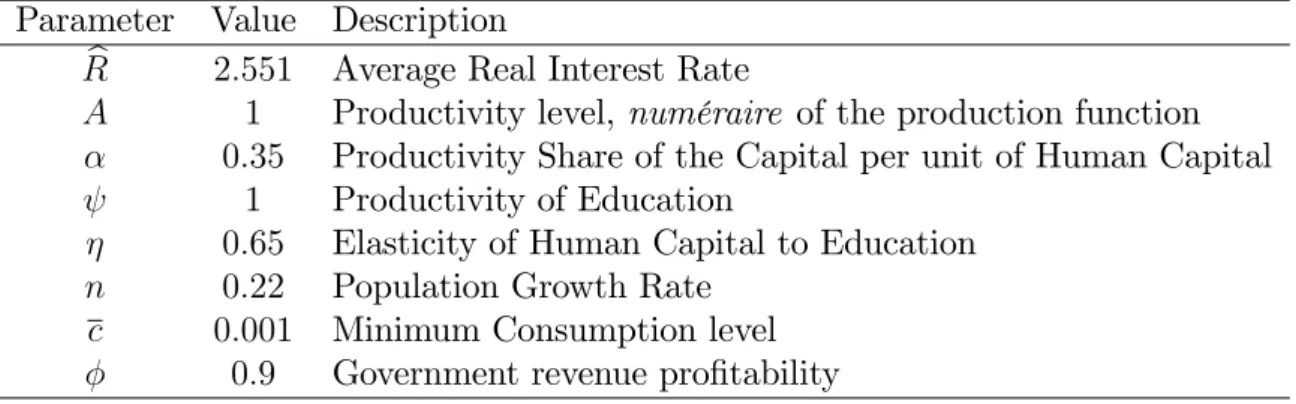
Table 1. Calibration of the model parameters
Parameter Value Description b
R 2:551 Average Real Interest Rate
A 1 Productivity level, numéraire of the production function 0:35 Productivity Share of the Capital per unit of Human Capital
1 Productivity of Education
0:65 Elasticity of Human Capital to Education
n 0:22 Population Growth Rate
c 0:001 Minimum Consumption level
0:9 Government revenue pro…tability
Table 1 shows the main parameters of the model. We assign to the interest rate a value of 2:551, which is consistent with the average real interest rate paid by the OECD countries in 20082. From r it is possible to …nd the value of per
capita capital bk; using equation (3) and the value of wage w, using equationb (4). The parameter usually takes value between 0.3 and 0.4. Here, we decide for an intermediate value, thus = 0:35. In the benchmark model, the productivity level is assumed to be the numéraire of the production function. Indeed, A is, for any given interest rate r, the parameter which levers the per capita capital and wage.
The wage w earned by adult agents depends on the level of per capita hu-man capital they are provided with, which, in turns, depends on the education they received from their parents when they were young. Hence, at the steady state, per capita wage w = wh, where h = e . Parameters andb 2 [0; 1] explain the productivity of education. Here, we assigned to a value of 1, treating it as the numéraire of the human capital productivity and gave to a value of 0:65.
Population growth rate is obtained using data on total population from the OECD countries. For the years from 1961 to 2010, the average annual population growth for the participating countries is 0:008. We assign a value
to the population growth rate for the model according to the equation n = (1 + 0:008)25 1, which gives us a value for n = 0:22.
The minimum consumption, which the household takes into account when maximizing her utility with respect to the consumption of her parents, has a value of 0:001, in harmony with the share of total consumption over GDP for the OECD which in 2008 was equal to 74%.
In the benchmark model we assume a certain degree of ine¢ ciency of the government, hence, just a fraction of the money collected by the government through the proportional tax on wage is redistributed to the households in the form of subsidy to education and pensions. The inclusion of a degree of government ine¢ ciency is not mandatory for the model to work, but is indeed interesting to assume it in order to compare the result with the case in which government is fully e¢ cient. Parameter usually does not take values below 0:7, here we decide for a relatively low level of ine¢ ciency of the public sector, assigning to a value of 0:9.
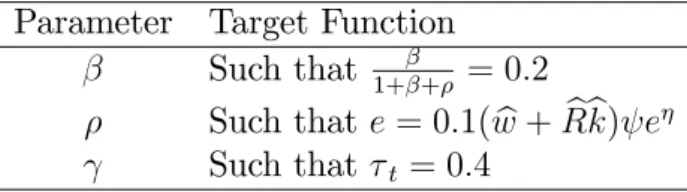
Table 2. Target functions for parameters , and
Parameter Target Function Such that 1+ + = 0:2
Such that e = 0:1(w + bb Rbk) e Such that t = 0:4
The value of the parameters in equation (7), (i.e. , and ) are set according to three precise objective function, as shown in Table 2. We seek a value of , the temporal discount between current and future consumption, such that the marginal propensity to saving is equal to 20%. The value of , which expresses the altruism of the household towards her children, is set such that the total expenditure in education is equal to 10% of the GDP. To conclude, the value of , the altruism of the household towards her parents, is set such that the proportional tax replicates the income tax of the OECD countries for the year 2008, hence such that t = 40%.
Table 3. Main results of the benchmark model
cy co e p
2:7e 03 7:3e 03 8:5e 05 1:5e 03 2:5e 04 0:333 0:319 3:528
Table 3 shows the main results of the benchmark model. Following the calibration presented at the beginning of the section, the proportional tax on wage collected by the government at the steady state is positive and precisely equal to 0:4. Government redistributes the collected resources among house-holds through a positive subsidy to education that adult agents use to …nance the formation of human capital of their children and positive pensions, paid
to the retired agents. The total expenditure in education is also positive and equal to the tenth part of the GDP and is consistent with a level of , the altruism that adult agents have towards their children, which ensures that the marginal propensity to saving is equal to 20%. Moreover, both consumption when young and consumption when old are positive, with the value of the latter variable higher than the minimum consumption level.
To conclude, the interest rate bR, as well as the steady state level of human capital per capita, which, in turns, depends on the steady state expenditure in education, ensure a positive level of GDP per capita.
4
Comparative Statics
The aim of the following section is to observe the response of the benchmark model to population aging, as well as to other features of the model. To do so, we …rst compute the derivatives of the equations for the subsidy and the proportional tax on wage at the steady state, then we evaluate them using the numerical results of the benchmark model in order to check for their sign.
Table 4. Comparative Statics for subsidy
Derivative @ =@n @ =@ @ =@ @ =@ @ =@ bR @ =@c
Sign + + + +
When population ages, the dependency ratio of old agents to adult ones rises, due to the higher number of retired people in the economy at time t, which leads the individual to choose for a higher volume of pensions rather than a subsidy to education. As a consequence of that, total expenditure in education is low relative to the demand for pensions, resulting in a contraction of the level of GDP per capita.
We can control for the population aging in the benchmark model by eval-uating the …rst derivative of the equation for the subsidy to education with respect to the population growth rate and consider its reciprocal value. Indeed, to assume an increase in the population growth rate is equal to assume an in-crease in the number of young agents in the economy relative to old retired ones.
Hence, we expect the …rst derivative of the function for the subsidy with respect to the population growth rate n to be positive, as precisely shown in Table 4, which reports the results of the main comparative statics for the subsidy we perform on the benchmark model.
Indeed, results indicate that an increase in the number of agents in working age with respect to the retired ones, which follows the increase in the
popu-lation growth rate, leads the amount of subsidy to education received by the government to rise.
On the other hand, the same result indicates that, as population ages, the change in the population structure in favour of the old agents, leads to a fall in the subsidy to education paid by the government.
Hence, in this latter case, population aging entails an increase in the amount of pensions demanded by the maximizing household. On the other hand, the positive value of the parameter ensures that total expenditure in education does not decrease as a consequence of population aging, although this increase is particularly small, relative to the increase in the demand for pensions3.
These results indicates that, as population ages, more public sources are de-voted to pensions rather to education, resulting in a decrease in the level of GDP per capita.
The …rst derivative of the function for the subsidy with respect to the parameter o¤ers an interesting point of view of the role of government ine¢ -ciency in the redistribution of the resources. Bearing in mind that indicates the share of collected tax which is redistributed by the government, Table 4 shows that an increase in government e¢ ciency leads the subsidy to education to increase, in the framework of the benchmark model.
Government ine¢ ciency can be led by multiple factors, as for instance cor-ruption in the public sector or the presence of costs in the process of tax collection. The results show that when such a ine¢ ciency gap is solved, the government has more sources to redistribute in the form of pensions and sub-sidy to education.
The …rst derivative of the equation for the subsidy with respect to the parameters and check for the robustness of the benchmark model. The re-sults in Table 4 show that an increase in drives to an increase in , where an increase in sinks the demand for subsidy to education. Indeed, when individ-uals have an interest in the education of their children which is higher relative to the altruism with respect to their parents, they ask for a relatively higher subsidy to education. On the other hand, when households are more altruistic towards their parents, relative to their children, the demand for subsidy to education falls, compensated by an increase in the demand for pensions.
The last two columns of Table 4 report the results of the …rst derivative of the equation for with respect to the interest rate and the minimum con-sumption level. The former shows that an increase in the interest rate drives to an increase in the subsidy to education. Indeed, when the interest paid is higher, the per capita wage received by the household decreases. Remarking
3The …rst derivative of the equation for pension and the one for education with respect
to population growth rate, shows that an increase in the number of retired agents relative to working agents leads the demand for pensions to increase by 2:07e 04 and total expenditure in education to increase by 1:73e 05.
that w =wh, where the human capital per capita is h = e , an decrease inb the per capita wage, assuming parameters and being constant, is caused by an decrease of the role that education has in generating income for the household. Hence, total expenditure in education falls, leading to a decrease in the amount of demanded.
On the other hand, an increase in the minimum consumption level leads to a decrease in the level of the subsidy to education demanded by the households. Certainly, when the sustainment level of consumption increases, retired agents living in period t have less sources to …nance their consumption, thus they demand a higher amount of pensions relative to the subsidy to education.
Table 5. Comparative Statics for tax
Derivative @ =@n @ =@ @ =@ @ =@ @ =@ bR @ =@c
Value + + + +
We perform the same comparative statics we described above, for the case of the proportional tax on wage . Again, to simulate the e¤ects of popu-lation aging, we compute the derivative of the equation for the proportional tax on wage for the opposite case, in which the population growth rate rises, with a consequent increase in the number of working agents relative to retired ones. We expect this derivative, evaluated with the results of the numerical simulation, to be negative. Indeed, as the number of working individuals in the economy rises, the increase in the number of taxpayers might induce to a decrease in the tax rate imposed by the government, con…rming the results obtained by Razin, Sadka and Swagel (2002). Hence, the opposite interpre-tation of the value shows that, as population ages the tax rate is expected to increase.
Such result depends on the calibration of the model. As shown in Table 3, the high value of relative to indicates that in the benchmark model, the individual is more altruistic towards her parents, hence in this baseline framework, the greater part of the money collected by the government through the proportional tax on wage is redistributed in the form of pensions. As population ages, government is forced to increase the tax rate in order to satisfy the increasing demand in social security measures.
The combined results of the e¤ects of population aging on the demand of subsidy to education and the proportional tax rate set by the government, remark that, as the population becomes older, the economy turns to be less productive. Households demand for less education to their children and for higher pensions to their parents, which in turns forces the government to rise the …scal pressure on the adult cohort.
This latter e¤ect could be compensated by an increase in the government e¢ ciency. Table 5 shows that an increase in the parameter , which has to be
interpreted as a more e¢ cient redistribution of the resources operated by the government, decreases the steady state rate of the proportional tax on wage.
The …rst derivative of the steady state condition for with respect to the interest rate con…rms that, as the amount of interest paid to the households increases, the per capita wage decreases, forcing the public sector to increase the rate of the proportional tax rate.
To conclude, the last column of Table5 shows that, as the minimum con-sumption level increases, the old agents living in the current period have less resources to …nance their consumption, hence the demand for pensions in-creases, which leads the government to increase the rate of the proportional tax on wage.
4.1
Population Aging and Government Ine¢ ciency
In order to show more in detail the e¤ect of the population aging, as well as the e¤ect of the government ine¢ ciency in the modelled economy, we carry out four di¤erent numerical simulations.
The aim of these simulations is to compute the demand for pensions in case of a smaller and higher population growth rate relative to the benchmark case in the framework of both an ine¢ cient and a fully e¢ cient public sector.
Model 1 and Model 2 are calibrated with a lower population growth rate with respect to the benchmark model, assuming the case in which the depen-dency ratio of old agents to adult ones rises. On the contrary, Model 3 and Model 4 are calibrated with a higher population growth rate, assuming the case of a fall in the dependency ratio. Furthermore, Model 1 and Model 3 assume that government is still ine¢ cient, hence just a fraction of the money collected by the public sector are re-distributed among the households. On the other hand, Model 2 and Model 4 assume a fully e¢ cient government in which the parameter takes its maximum value.
Model 1 and Model 2 are calibrated so to match data from Germany, while Model 3 and Model 4 replicate data from China. The remaining parameters are calibrated as in the benchmark model.
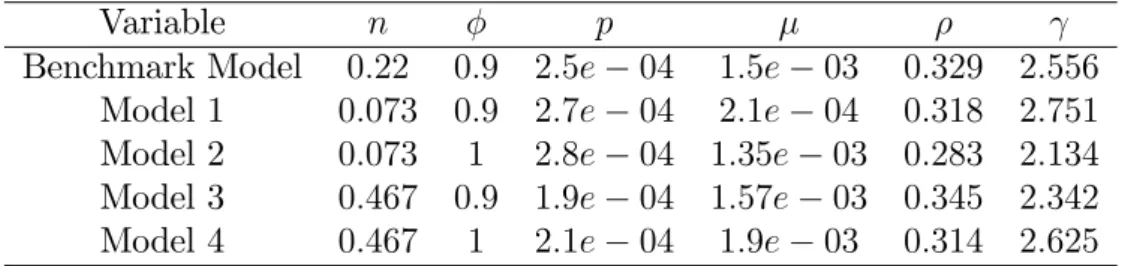
Table 6. Main results of Models 1, 2, 3 and 4
Variable n p
Benchmark Model 0:22 0:9 2:5e 04 1:5e 03 0:329 2:556
Model 1 0:073 0:9 2:7e 04 2:1e 04 0:318 2:751
Model 2 0:073 1 2:8e 04 1:35e 03 0:283 2:134
Model 3 0:467 0:9 1:9e 04 1:57e 03 0:345 2:342
The results reported in Table 6 show that, as n falls, the dependency ratio of old to adult agents increases, the demand for pensions that the government has to satisfy increases from 2:5e 04 to 2:7e 04, while the subsidy to edu-cation falls from 1:5e 03to 2:1e 04. These results are consistent with the …ndings explained previously in this section. Moreover, the decrease in the parameter and the increase in the parameter indicate that, as n decreases the maximizing individual is more altruistic towards her parents and less altru-istic towards her children, relatively to the baseline model. Model 2 compares the result obtained in Model 1, with the case of fully e¢ cient government. As expected, the demand for pensions and the value of the subsidy rise, due to the greater amount of resources that the government can redistribute among the households. Model 3 assumes a higher population growth rate relative to the benchmark case. Conversely with respect to the results obtained in Model 1, the demand for pensions falls, while the value of the subsidy rises, according to the increase of working agents living the economy at time t. Again, parameters and respond as expected, increasing the altruism of the household towards her children and decreasing the one relative to her parents.
The relationship between the altruism of the representative household to-wards both her children and parents, and the ine¢ ciency of the government, on the other hand, is not clear.
5
Empirical Evidence
Using data for the United States over the period 1970 - 2013, we examine the e¤ects of population aging on the expenditure on education. In this section we show that the empirical evidence not only tests for the structure of our model, but is also consistent with its main implications. Indeed, the results have to be considered as suggestive only, since we only imply OLS estimators and do not test for alternative models.
We estimate a regression in which the endogenous variable, expenditure on education (in logs), is function of the dependency ratio, de…ned as the percentage of retired people with respect to the labor force, the government expenditure devoted to social security, as well as the total government expendi-ture (both in logs), the labor tax rate and the tax rate paid by the households to …nance social security policies. Hence, the regression includes also a test for the relationship between the expenditure on education and the transfers for pensions, the latter included in the total expenditure for social security. More-over, our regression model is able to decompose the e¤ect on the government expenditure on education of both the labor tax rate and the tax rate devoted precisely to social security measures.
trans-fers such as unemployment and disability subsidies, though social security pay-ments are by far the largest component of total security protection transfers.
Following Razin, Sadka and Swagel (2002), who include an empirical test for the relationship between the population aging and both the labor tax rate and the per capita social transfer, we also include per capita GDP growth and unemployment rate as explanatory variable. The inclusion of the real growth in the domestic product controls for business cycle e¤ects, while the unemployment rate controls for the expenditure on social protection which, indeed, includes subsidies to unemployment.
5.1
Data Sources and Description
Data from the United States, for the dependency ratio, the per capita GDP growth, the unemployment rate and both the expenditure on social protection and total government expenditure are taken from the OECD Database and the OECD reports "Pensions at a Glance" and "Education at a Glance" (2013). The dependency ratio is computed as the ratio of people over 65 years and people in the working age, older than 15 years and younger than 64 years, in percentage. As population ages, the dependency ratio clearly follows an increasing trend, with a value of 15:83% in 1970 and a value of 21:25% in 20134, and an average annual growth of 0:069% in the reference period.
As already pointed out, the expenditure in social protection includes the government expenditure in social security (old-age pensions and bene…ts) and other social transfers, such as subsidies to unemployment and disability com-pensations. For the year 2013, data from the U.S. reveal that expenditure on social protection was 33% of the total government expenditure. Out of this, 51% was devoted to social security payments, which represent by far the largest component of the expenditure on social protection.
Data for the labor tax rate and the social security tax rate are taken from the U.S. Tax Foundation. The social security tax rate indicates the percentage of the taxes paid by the households devoted to social security measures.
4OECD projections on population indicate a Dependency Ratio for the United State
5.2
Estimation Results
Table 7. Determinants of the Expenditure on Education
Expenditure On Education
Constant 0:0275 (0:1086)
Dependency Ratio 0:0068 (0:0019)
Per Capita GDP Growth 0:0012 (0:0004)
Expenditure On Social Protection 0:0639 (0:0562)
Total Government Expenditure 0:1761 (0:0839)
Labor Tax Rate 0:0437 (0:0389)
Social Security Tax Rate 0:6159 (0:3491)
Unemployment Rate 0:0241 (0:0110)
R2 0:9942
Number of Observations 43
Table 7 reports the results of our regression. We include a lag for the dependent variable in order to minimize the possible problem of endogeneity in the regression model. The equation is estimated with ordinary least squares. The dependency ratio has a high statically signi…cant and negative impact on the expenditure on education, as we expected from the model results. In-deed, as population ages, more social protection transfers are demanded by the households with a consequent decrease in the government expenditure de-voted to education. Our empirical model shows that, as the dependency ratio increases by 1%, the expenditure on education decreases by a factor of 0:68%. Per capita GDP growth is high statistically signi…cant and appears to have a negative impact on the expenditure on education. The theoretical model shows an inverse relationship, since education participates to the formation of human capital which is a production input. In this case, the negative rela-tionship between the two variables can be explained as the data we used when carrying out the regression. Due to the increasing trend in the dependency ra-tio and the shift of government investments from educara-tion to social protecra-tion measures, an increase in the GDP growth might lead to lower investments in education. This interpretation is somehow con…rmed by the negative, although not statistically signi…cant, coe¢ cient of the expenditure on social protection. The results show that, as population ages, the increase in the dependency ratio leads the government to invest more in social protection, with the consequent contraction in the expenditure on education.
The positive coe¢ cients associated to the total government expenditure and the labor tax rate, the former statistically signi…cant at a 5% level, the latter not statistically signi…cant, are consistent with our theoretical model. As the government rises the rate of the tax paid by the households, more resources can be redistributed among the households, hence both variables have a positive e¤ect on the expenditure on education.
On the other hand, when only the rate of the taxes used to …nance social security policies is raised by the government, the expenditure on education decreases, as shown by the coe¢ cient of the social security tax rate, which is statistically signi…cant with 10% con…dence level.
To conclude, the unemployment rate is high statistically signi…cant and has a negative e¤ect on the dependent variable. Indeed, as explained above, the increase in the unemployment rate, forces the government to invest more in social protection transfers which, as we already said, has a negative e¤ect on the expenditure on education. Such interpretation appears to be consistent with our model, although Daveri and Tabellini (2000) suggest reverse causality between unemployment and social transfers from the government, pointing out that the increase in the unemployment rate might be precisely the consequence of the low transfers operated by the public sector.
6
Conclusion
In this paper we analyze the e¤ects of population aging on the redistribu-tion of resources operated by the public sector focusing, in particular, on the expenditure on education and the expenditure on social security.
We build a simple overlapping generations model in which three generations of household live in every period. Young agents neither consume nor work and are just supplied with education by their parents, who contribute to the formation of their human capital, which is used as a production input. Adult households work and allocate their wage, net to a proportional tax collected by the government, among the current and future consumption and the education provided to their children. Old individuals are retired and use their savings and pensions to …nance their consumption. The government plays a role in the economy redistributing the resources among the individuals in the form of subsidy to education to adult agents and pensions to the retired ones.
A numerical simulation of the model shows that, as the dependency ratio of old people with respect of the labour force increases, government allocates more resources to the security system rather than to the education, with a consequent increase in the pensions volume and a decrease in the subsidy to education. Since education participates to the formation of human capital, which a¤ects directly the wage per capita, the capita per capital and, of course, the GDP per capita, the aging of population leads to a contraction in the productivity of the economy.
Our model accounts also for the presence of ine¢ ciency in the public sector, hence not all the resources collected by the government are redistributed among the taxpayers.
the benchmark model. The new versions show both the e¤ects of an increase and a decrease in the dependency ratio and a decrease in government ine¢ -ciency.
Projections for the 2050 show that the aging of the baby boom generations, as well as the estimated decrease in the fertility rate, will increase the depen-dency ratio, with evident negative consequences on the income distribution among households and inequality, con…rming the results obtained by Perotti (1993). We show that the ine¢ ciency of the government also plays a crucial role in this mechanism, hence an improvement in the public sector structure is like to compensate the negative e¤ects of population aging. On the other hand, the increase in the dependency ratio must be seen as a natural consequence of the better living standards and the rise in the life expectancies in both the developed and developing countries.
In general, the academic literature o¤ers a pessimistic vision of the issue. In particular, Lindbeck and Persson (2003), as well as Sanderson and Sherbov (2007) and Iturbe-Ormaetxe and Valera (2010) suggest a necessary reform in the pension system in order not to penalize the young generations, the former with a general comparison of di¤erent pensions transfers schemes, the latter through a study of possible reforms proposed in the last years.
On the other hand, there are also examples of more optimistic interpreta-tions as, for instance, Boldrin and Montes (2009), who, improving the structure of a previous study of them, Boldrin and Montes (2005), employ an overlapping generations model to show that, as population ages, government policies do not seem to favor older relative to younger generations. Indeed, they …nd out that, even though young agents receive less investments in education, they are predict to pay a lower interest rate on the educational transfers that they re-ceived on their youth, which might compensate the negative e¤ect and, overall, leave them better o¤.
Here, we take an intermediate position. If on one side it is clearly not likely to generate policies able to invert the trend in the dependency ratio, on the other, we shown that policy makers have a discrete number of variables to work on in order to compensate the negative e¤ects of population aging.
Among them, reforms on the pensions payment systems are the more sug-gested by the literature, while our …ndings indicates that reforms on the struc-ture of the public sector and improvements of its e¢ ciency are possible policies able to compensate the consequences of the population aging trend.
References
Boldrin, M. and Montes, A., (2005). "The Intergenerational State: Education and Pensions", The Review Of Economic Studies, 72: 651 –664
Boldrin, M. and Montes, A., (2009). "Assessing the E¢ ciency of Public Education and Pensions", Journal Of Population Economics, 22: 285 –309
Bongaarts, J., (2004). "Population Aging and the Rising Cost of Public Pension", Population And Development Review, 30: 1 –23
Daveri, F. and Tabellini, G., (2000). "Unemployment, Growth and Taxa-tion in Industrial Countries", Econ. Policy: European Forum, 30: 47 –88
Disney, R., (2007). "Population Aging and the Size of the Welfare State: Is There a Puzzle to Explain?", European Journal Of Political Economy, 23(2): 542 –553
Glomm, G. and Kaganovich, M. (2003). "Distributional E¤ects of Pub-lic Education in an Economy with PubPub-lic Pension", International Economic Review, 44(3): 917 –937
Iturbe-Ormaetxe, I. and Valera, G., (2010). "Social Security Reform and the Support for Public Education", Journal Of Population Economics, 25: 609 –634
Lindbeck, A. and Persson, M. (2003). "The Gains from Pension Reform", Journal of Economic Literature, 41(1): 74 –112
McDonald, M.D. and Budge, I., (2005). "Elections, Parties, Democracy: Conferring the Median Mandate", Oxford: Oxford University Press
OECD (2013). "Pensions at a Glance 2013: OECD and G20 Indicators", OECD Publishing, Paris
OECD (2013). "Education at a Glance 2013: OECD Indicators", OECD Publishing, Paris
OECD (2013). "Trends Shaping Education 2013", OECD Publishing, Paris Perotti, R., (1993). "Political Equilibrium, Income Distribution, and Growth", The Review of Economic Studies, 60(4): 755 –776
Razin, A., Sadka, E. and Swagel, P., (2002). "The Aging Population and the Size of the Welfare State", Journal of Political Economy, 110(4): 900 – 918
Sanderson, W. and Sherbov, S., (2007). "A Near Electoral Majority of Pen-sioners: Prospects and Policies", Population and Development Review, 33(3): 543 –554