UNIVERSITÀ DEGLI STUDI DI SASSARI CORSO DI DOTTORATO DI RICERCA
Scienze Agrarie
Curriculum agrometeorologia ed ecofisiologia dei sistemi agrari e forestali Ciclo XXIX
Anno accademico 2015- 2016
E
NVIRONMENTAL IMPLICATIONS OF DAIRY SHEEP SUPPLY CHAIN ANDEVALUATION OF CLIMATE CHANGE MITIGATION ACTIONS FOR
S
ARDINIAN SHEEP FARMING SYSTEMSDott. Enrico Vagnoni
Coordinatore del Corso Prof. Antonello Cannas Referente di Curriculum Prof.ssa Donatella Spano
A mi querido amigo Angel, quien me enseñó que el deseo de saber
S
UMMARYINTRODUCTION... 1
REFERENCES ... 5
CHAPTER 1- ENVIRONMENTAL PERFORMANCES OF SARDINIAN DAIRY SHEEP PRODUCTION SYSTEMS AT DIFFERENT INPUT LEVELS ... 9
CHAPTER 2-ENVIRONMENTAL IMPLICATIONS OF DIFFERENT PRODUCTION SYSTEMS IN A SARDINIAN DAIRY SHEEP FARM ... 18
ABSTRACT ... 18
INTRODUCTION ... 19
METHODS ... 20
RESULTS AND DISCUSSION ... 24
CONCLUSIONS ... 32
REFERENCES ... 33
CHAPTER 3-ENVIRONMENTAL PERFORMANCES OF SARDINIAN DAIRY SHEEP PRODUCTION SYSTEMS AT DIFFERENT INPUT LEVELS ... 39
ABSTRACT ... 39
INTRODUCTION ... 40
MATERIALS AND METHODS ... 42
RESULTS AND DISCUSSION ... 47
CONCLUSIONS ... 56
REFERENCES ... 58
CONCLUSIONS AND FUTURE PERSPECTIVES ... 64
ENRICO VAGNONI – ENVIRONMENTAL IMPLICATIONS OF DAIRY SHEEP SUPPLY CHAIN AND EVALUATION OF CLIMATE CHANGE MITIGATION ACTIONS FOR SARDINIAN SHEEP FARMING SYSTEMS –TESI DI DOTTORATO IN SCIENZE AGRARIE –CURRICULUM “AGROMETEOROLOGIA ED ECOFISIOLOGIA DEI SISTEMI AGRARI E FORESTALI”–CICLO XXIXANNO ACCADEMICO 2015-2016
UNIVERSITÀ DEGLI STUDI DI SASSARI 1
I
NTRODUCTIONThe IPCC Fifth Assessment Report on Climate Change (2014) confirms the agro-forestry sector as a significant source of greenhouse gases emissions (GHG): with a contribution equal to 24%: it is the second most impacting economic activity, after the energy industry (35%
of total emissions). Excluding carbon dioxide emissions (CO2), agriculture ranks as the largest
contributor with 56% of 2005 global GHG emissions (U.S. EPA, 2011), mainly due to methane
(CH4) and nitrous oxide (N2O), which determine a radiative forcing 23 and 300 times higher
than CO2, respectively. In more recent years, FAO has estimated that emissions of non-CO2
from agriculture amount to 5.2–5.8 Gt CO2eq yr-1, corresponding to 10-12% of total
anthropogenic GHG emissions. Under this scenario, the livestock sector plays a relevant role. The report ‘Tackling climate change through livestock’ (Gerber et al., 2013) estimates that the livestock sector is responsible for 14.5% of all anthropogenic GHG emissions, with a significant
impact of CH4 emissions (44% of sector's emissions). In particular, livestock supply chains emit
5%, 44% and 53% of CO2, CH4 and N2O anthropogenic emissions, respectively. Within the
livestock sector, cattle breeding is responsible for the most emissions. Small ruminants farming
is an important contributor too (just under 0.5 Gt CO2eq, 1/3 of GHG emissions of bovine milk
production), representing around 6.5% of GHG sector’s emissions (Gerber et al., 2013; Opio et
al., 2013). In particular, enteric CH4 emissions from world sheep population represent more
than 6.5% of similar emissions from the global livestock sector (FAOSTAT, 2012). Furthermore, when emissions are expressed on a per protein basis, meat and milk from small
ruminants represent the second and third highest emission intensities (165 e 112 kg CO2eq per
kg protein, respectively) among the overall food of animal origin (amount of GHG emitted per unit of output produced) (Gerber et al., 2013). The role of small ruminants’ livestock in tackling climate change and its environmental implications are also more relevant considering that goat and sheep population is growing steadily worldwide: increasing from 876 to 1,043 million heads over the period 2007-2011(OECD-FAO, 2015) and exceeding 2,200 million heads in 2014 (FAOSTAT, 2017). Moreover, within the positive trend of livestock productions foreseen for 2015-2024, the sheep sector occupies a key position with an expected production increasing more than 20% compared to the past decade (OECD-FAO, 2015).
With about 147 million heads, Europe is the world’s third region in terms of number of sheep (FAOSTAT, 2017). In spite of sheep and goat farming representing a minor agricultural activity, accounting for less than 4% of the total value of animal production in EU-27, these activities play a crucial role, both in economic and environmental terms, in particular in many
ENRICO VAGNONI – ENVIRONMENTAL IMPLICATIONS OF DAIRY SHEEP SUPPLY CHAIN AND EVALUATION OF CLIMATE CHANGE MITIGATION ACTIONS FOR SARDINIAN SHEEP FARMING SYSTEMS –TESI DI DOTTORATO IN SCIENZE AGRARIE –CURRICULUM “AGROMETEOROLOGIA ED ECOFISIOLOGIA DEI SISTEMI AGRARI E FORESTALI”–CICLO XXIXANNO ACCADEMICO 2015-2016
UNIVERSITÀ DEGLI STUDI DI SASSARI 2
disadvantages areas of the Mediterranean Basin (Zygoyiannis, 2006). Most livestock farms are located in Great Britain (27%), Spain (18%), Romania (11%), Greece (11%), Italy (9%), France (9%) and Ireland (4%). Although in Europe sheep are raised mainly for meat production, a stable growth has been registered in sheep milk production since 2003 (+2.1% from 2003 to 2013), despite a drop in head number and meat production (respectively by -4% e -10.5%) (FAOSTAT, 2013). In particular, over 70% of the sheep bred in Romania, Greece and Italy – which together hold approximately 30.5% of the entire European sheep population – are milking ewes (EUROSTAT, 2014).
Italy, with more than 7 million sheep heads in about 68 thousand farms, is the third country in EU-28 for sheep population (IZS, 2016). According to FAO (FAOSTAT, 2012), Italian sheep farming is responsible for more than 6% of the total enteric methane emissions by the European agricultural sector. Within the Italian sheep sector, Sardinia is by far the main region, with more than 45% of Italian sheep ewes and about 13 thousand farms (ISTAT, 2016), spread all-over the island. In fact, 25% of total EU-27 sheep milk production came from Sardinia (Rural Development Programme of Sardinia - RDP, 2014-2020). Basically, the whole Sardinian sheep milk production (more than 300,000 t year-1) is transformed in cheese, produced with a semi-artisanal or industrial process. Sardinian milk sheep cheese production has three Protected Designation of Origin cheeses (PDO), i.e. “Pecorino Romano” (mainly intended for export, represents more than 90% of the total Sardinian PDO cheeses) (Osservatorio Regionale della filiera ovicaprina, 2012), “Fiore Sardo”, “Pecorino Sardo” and several minor productions, all closely linked to the territory and local traditions (Piredda et al., 2006). However, the fluctuating dynamics of the Pecorino Romano PDO international price and the dominant role played by few industries (the first five cheese-makers transform 45% of the total production) represent a structural weakness and a serious threat for the whole Sardinian agro-food system (RPD, 2014-2020). As well as in others Mediterranean regions, the Sardinian sheep sector is characterized by a strong farm fragmentation, with a predominance of small family-run farms (herds below 300 heads). Only in the more fertile and irrigated plains medium/big farms are found. Therefore, contrasting dairy sheep farming systems coexist in Sardinia, with differences in input utilization, land use and intensification level which depend on geographical location of farms, specific economic conditions and other external factors such as public incentives policies and local or global market trends (Biala et al., 2007). In order to contrast the deep structural crisis (i.e. the high dependency on external markets, the limited generational change of the sector and the on-going abandonment of rural areas) mainly related
ENRICO VAGNONI – ENVIRONMENTAL IMPLICATIONS OF DAIRY SHEEP SUPPLY CHAIN AND EVALUATION OF CLIMATE CHANGE MITIGATION ACTIONS FOR SARDINIAN SHEEP FARMING SYSTEMS –TESI DI DOTTORATO IN SCIENZE AGRARIE –CURRICULUM “AGROMETEOROLOGIA ED ECOFISIOLOGIA DEI SISTEMI AGRARI E FORESTALI”–CICLO XXIXANNO ACCADEMICO 2015-2016
UNIVERSITÀ DEGLI STUDI DI SASSARI 3
to the cyclic collapse of Pecorino Romano PDO international price, the Sardinian dairy sheep sector needs a robust innovation process where the integration and optimization of economic and environmental productive factors are key actions (Atzori et al., 2015). The eco-innovation of production processes and the valorisation of pasture-based systems could represent an effective strategy to improve farms competitiveness and to promote Sardinian dairy sheep products as well as the whole Mediterranean livestock chains. On the other hand, assessing environmental implications of sheep farming and improving its environmental performance could have effects both on combating climate change (GHG emissions mitigation and ecosystem services optimization) and on rural development policies. At present, greening of agriculture and farming practices supported by EU policies and driven by the increasing demand of eco-sustainable food, as well as the circular economy rising, place even more emphasis on the need to incorporate knowledge about the environmental implications of production systems into management farming strategies.
Several studies have been dedicated to the environmental assessment of cow systems (Baldini et al., 2017; de Boer, I.J.M, 2003; de Vries et al., 2015; Soteriades et al., 2016), because they have a worldwide economic relevance, they play an essential role in human diet as protein
food source and they largely contribute to global CH4 and N2O emissions. All authors estimated
the environmental performances using a Life Cycle Assessment (LCA) approach, the widely accepted, complete and standardized computational tool for providing a widespread knowledge on the environmental aspects associated with products, services or activities (Hayashi et al., 2006). The LCA analysis represents also the first step towards sustainability of production systems, identifying where environmental impacts and damages take place (Chen et al., 2005). On the other hand, little research has been focused on the environmental implications of dairy sheep systems from a life cycle perspective, despite their significance in the global trends of livestock productions. The most relevant research studies on the environmental performances of small ruminant systems using an LCA approach have been conducted mainly in Australia, New Zealand and in the United Kingdom. As a consequence, these LCA studies concerned wool and meat, the main products of global sheep farming systems (Biswas et al., 2010; Brock et al., 2013; Browne et al., 2011; Ledgard et al., 2011; Peters et al., 2011; Williams et al., 2012). In addition, a LCA study on Spanish sheep meat production was quite recently published by Ripoll-Bosch et al. (2013). To our knowledge, the main scientific papers on the environmental implications of sheep milk production regarded a LCA study of an Australian intensive farming system (Michael, 2011) and four works carried out on the European context, including the first
ENRICO VAGNONI – ENVIRONMENTAL IMPLICATIONS OF DAIRY SHEEP SUPPLY CHAIN AND EVALUATION OF CLIMATE CHANGE MITIGATION ACTIONS FOR SARDINIAN SHEEP FARMING SYSTEMS –TESI DI DOTTORATO IN SCIENZE AGRARIE –CURRICULUM “AGROMETEOROLOGIA ED ECOFISIOLOGIA DEI SISTEMI AGRARI E FORESTALI”–CICLO XXIXANNO ACCADEMICO 2015-2016
UNIVERSITÀ DEGLI STUDI DI SASSARI 4
chapter of this doctoral thesis (Atzori et al., 2015; Batalla et al., 2015; Marino et al., 2016; Vagnoni et al., 2015). Moreover, only two LCA studies investigated the environmental implications of the sheep milk cheese production chain (Favilli et al., 2008; Conte et al., 2016). If GHG mitigation actions in the sheep sector are to be achieved, there is not clear scientific evidence showing that, for example, extensive farming systems are less impacting than more intensive ones. Extensive agriculture may help in mitigating some negative environmental impacts caused by intensive livestock systems, such as consumption of fossil energy resources, use of macroelements, global warming potential, loss of biodiversity, degradation of soil quality (Biala et al., 2007). On the other side, the introduction of some low-input techniques, i.e. manure fertilisation, mechanical weeding, no-tillage cultivation and so on, was demonstrated to have sometimes the opposite effect (Basset-Mens and Van Der Werf, 2005; Brentrup et al., 2004; Michael, 2011).
Therefore, more research studies are needed in order to i) better assess the environmental implications of Mediterranean sheep systems with a comprehensive and site-specific approach, and ii) to evaluate the effectiveness and efficacy of climate change mitigation actions.
The present thesis deals with these knowledge gaps and is intended to contribute to the environmental profile characterization of the Sardinian dairy sheep chain. The thesis is structured in three chapters developed following a common logical and scientific framework, each having specific objectives and its own independence:
1. LCA analysis of sheep milk obtained with three different production systems (high, mid, and low input), already published in Science of the Total Environment, Vol. 502, 1 January 2015, pp 354-361.
2. Comparison of the environmental performances of two contrasting management systems within the same dairy sheep farm, currently under submission to Journal of Small Ruminant Research.
3. Preliminary evaluation of the environmental profile of the Sardinian milk sheep cheese chain, at present under submission to Journal of Cleaner Production.
ENRICO VAGNONI – ENVIRONMENTAL IMPLICATIONS OF DAIRY SHEEP SUPPLY CHAIN AND EVALUATION OF CLIMATE CHANGE MITIGATION ACTIONS FOR SARDINIAN SHEEP FARMING SYSTEMS –TESI DI DOTTORATO IN SCIENZE AGRARIE –CURRICULUM “AGROMETEOROLOGIA ED ECOFISIOLOGIA DEI SISTEMI AGRARI E FORESTALI”–CICLO XXIXANNO ACCADEMICO 2015-2016
UNIVERSITÀ DEGLI STUDI DI SASSARI 5
R
EFERENCESAtzori, A.S., Furesi, R., Madau, F.A., Pulina, P., Rassu, P.G., 2015. Sustainability of Dairy Sheep Production in Pasture Lands: A Case Study Approach to Integrate Economic and Environmental Perspectives. Rivista di Studi sulla Sostenibilità, 1, 117-134.
Baldini, C., Gardoni D., Guarino, M., 2017. A critical review of the recent evolution of Life Cycle Assessment applied to milk production. Journal of Cleaner Production 140, 421-435.
Basset-Mens, C., Van Der Werf, H.M.G., 2005. Scenario-based environmental assessment of farming systems: The case of pig production in France. Agriculture, Ecosystems & Environment, 105, 127–144. doi:10.1016/j.agee.2004.05.007
Batalla, I., Knudsen, M.T., Mogensen, L., Hierro, Ó., Del Pinto, M., Hermansen, J.E., 2015. Carbon footprint of milk from sheep farming systems in Northern Spain including soil carbon sequestration in grasslands. Journal of Cleaner Production, 104, 121-129. doi:10.1016/j.jclepro.2015.05.043.
Biala, K., Terres, J., Pointereau, P., Paracchini, M.L., 2007. Low Input Farming Systems: an opportunity to develop sustainable agriculture. Proceedings of the JRC Summer University Ranco, 2-5 July 2007. doi:10.2788/58641
Biswas, W.K, Graham, J., Kelly, K., John, M.B. 2010., Global warming contributions from wheat, sheep meat and wool production in Victoria, Australia, a life cycle assessment’. Journal of Cleaner Production, 18 (14), 1386–1392.
Brentrup, F., Küsters, J., Lammel, J., Barraclough, P., Kuhlmann, H., 2004. Environmental impact assessment of agricultural production systems using the life cycle assessment (LCA) methodology. The application to N fertilizer use in winter wheat production systems. European Journal of Agronomy, 20, 265–279. doi:10.1016/S1161-0301(03)00039-X
Brock, P., Graham, P., Madden, P., Douglas, J. A., 2013. Greenhouse gas emissions profile for 1 kg of wool produced in the Yass Region, New South Wales: A Life Cycle Assessment Approach. Animal Production Science, 53, 445-508.
Browne, N.A., Eckard, R.J., Behrendt, R., Kingwell, R.S., 2011. A comparative analysis of on-farm greenhouse gas emissions from agricultural enterprises in south eastern Australia. Animal Feed Science and Technology, 166-167, 641–652.
ENRICO VAGNONI – ENVIRONMENTAL IMPLICATIONS OF DAIRY SHEEP SUPPLY CHAIN AND EVALUATION OF CLIMATE CHANGE MITIGATION ACTIONS FOR SARDINIAN SHEEP FARMING SYSTEMS –TESI DI DOTTORATO IN SCIENZE AGRARIE –CURRICULUM “AGROMETEOROLOGIA ED ECOFISIOLOGIA DEI SISTEMI AGRARI E FORESTALI”–CICLO XXIXANNO ACCADEMICO 2015-2016
UNIVERSITÀ DEGLI STUDI DI SASSARI 6
Chen, G., Orphant, S., Kenman, S.J., Chataway, R.G., 2005. Life cycle assessment of a representative dairy farm with limited irrigation pastures. Proceedings of the 4th Australian Conference on Life Cycle Assessment - Sustainability Measures for Decision Support, 23-25 February 2005, Sydney, Australia, 1-11.
Conte, A., Cappelletti, G.M., Nicoletti, G.M., Russo C., Del Nobile, M.A., 2015. Environmental implications of food loss probability in packaging design. Food Research International, 78, 11-17.
de Boer, I.J.M., 2003. Environmental impact assessment of conventional and organic milk production. Livestock Production Science, 80, 69-77. doi:10.1016/S0301-6226(02)00322-6
de Vries, M., van Middelaar, C.E., de Boer, I.J.M., 2015. Comparing environmental impacts of beef production systems: A review of life cycle assessments. Livestock Science, 178, 279-288.
EUROSTAT, 2014. Database available at
http://epp.eurostat.ec.europa.eu/tgm/table.do?tab=table&init=1&plugin=1&language=en&pco de=tag00017 (last access December 2015)
FAOSTAT, 2012. United Nations Food and Agriculture Organization Statistical Database. http://faostat.fao.org/site/291/default.aspx (last access July 2016).
FAOSTAT, 2013. United Nations Food and Agriculture Organization Statistical Database. http://faostat.fao.org/site/291/default.aspx (last access July 2016).
FAOSTAT, 2017. United Nations Food and Agriculture Organization Statistical Database. http://faostat.fao.org/site/291/default.aspx (accessed January 2017).
Favilli, A., Rizzi, F., Iraldo, F., 2008. Sustainable production of cheese thanks to renewable energy: an LCA of the “Pecorino Toscano DOP” from the geothermal district of Larderello, Italy. Proceeding of 6th International Conference on LCA in the Agri-Food Sector, Zurich (November 12-14, 2008).
Gerber, P.J., Steinfeld, H., Henderson, B., Mottet, A., Opio, C., Dijkman, J., Falcucci, A. & Tempio, G., 2013. Tackling climate change through livestock - A global assessment of emissions and mitigation opportunities. Food and Agriculture Organization of the United Nations (FAO), Rome.
ENRICO VAGNONI – ENVIRONMENTAL IMPLICATIONS OF DAIRY SHEEP SUPPLY CHAIN AND EVALUATION OF CLIMATE CHANGE MITIGATION ACTIONS FOR SARDINIAN SHEEP FARMING SYSTEMS –TESI DI DOTTORATO IN SCIENZE AGRARIE –CURRICULUM “AGROMETEOROLOGIA ED ECOFISIOLOGIA DEI SISTEMI AGRARI E FORESTALI”–CICLO XXIXANNO ACCADEMICO 2015-2016
UNIVERSITÀ DEGLI STUDI DI SASSARI 7
Hayashi, K., Gaillard, G., Nemecek, T., 2006. Life cycle assessment of agricultural production systems: current issues and future prespectives. Proceedings of the International Seminar on Technology Development for Good Agriculture Practice in Asia and Oceania, Taipei, Taiwan, 98-109.
ISTAT, 2016. Italian National Institute of Statistics database.
http://dati.istat.it/Index.aspx?DataSetCode=DCSP_ALLEV&Lang=# (last access November 2016).
IZS, 2016. Istituto Zooprofilattico Sperimentale. http://statistiche.izs.it (last access November 2016).
Ledgard, S.F., Lieffering, M., Coup, D., O’Brien, B., 2011. Carbon footprinting of New Zealand lamb from the perspective of an exporting nation. Animal Frontiers, 1, 40-45.
Marino, R., Atzori, A.S., D’Andrea, M., Iovane, G., Trabalza-Marinucci, M., Rinaldi, L., 2016. Climate change: Production performance, health issues, greenhouse gas emissions and mitigation strategies in sheep and goat farming. Small Ruminant Research, 135, 50–59. doi:10.1016/j.smallrumres.2015.12.012
Michael, D., 2011. Carbon reduction benchmarks and strategies: new animal products. Australian Government, rural industries research and development corporation. RIRDC Publication No. 11/063, RIRDC Project No. PRJ-003369.
OECD/Food and Agriculture Organization of the United Nations, 2015. OECD-FAO Agricultural Outlook 2015. OECD Publishing, Paris, France.
Opio, C., Gerber, P.J, Mottet, A., Falcucci, A., Tempio, G., MacLeod, M., Vellinga, T., Henderson, B., Steinfeld, H., 2013. Greenhouse gas emissions from ruminant supply chains - A global life cycle assessment. Food and agriculture organization of the United Nations (FAO), Rome.
Osservatorio Regionale per l’Agricoltura, 2012. La filiera ovicaprina in Sardegna. Report available at: http://www.sardegnaagricoltura.it/documenti/14_43_20131220133546.pdf Peters, G.M., Wiedemann, S., Rowley, H.V., Tucker, R., Feitz, A.J., Schulz, M., 2011. Assessing agricultural soil acidification and nutrient management in life cycle assessment. The International Journal of Life Cycle Assessment, 16, 431–441.
ENRICO VAGNONI – ENVIRONMENTAL IMPLICATIONS OF DAIRY SHEEP SUPPLY CHAIN AND EVALUATION OF CLIMATE CHANGE MITIGATION ACTIONS FOR SARDINIAN SHEEP FARMING SYSTEMS –TESI DI DOTTORATO IN SCIENZE AGRARIE –CURRICULUM “AGROMETEOROLOGIA ED ECOFISIOLOGIA DEI SISTEMI AGRARI E FORESTALI”–CICLO XXIXANNO ACCADEMICO 2015-2016
UNIVERSITÀ DEGLI STUDI DI SASSARI 8
Piredda, G., Scintu, M. F., Pirisi, A., 2006. I formaggi sardi tra tradizione e innovazione. Scienza e Tecnica Lattiero Casearia, 57, 163-173.
Ripoll-Bosch, R., de Boer, I.J.M., Bernués, A., Vellinga, T. V., 2013. Accounting for multi-functionality of sheep farming in the carbon footprint of lamb: A comparison of three
contrasting Mediterranean systems. Agricultural Systems 116, 60–68.
doi:10.1016/j.agsy.2012.11.002.
RPD, Rural Development Programme of Sardinia, 2014-2020. Available at http://www.regione.sardegna.it/speciali/programmasvilupporurale/benvenuto-sul-sito-del-psr-2014-2020 (last access January 2017).
Soteriades, A.D., Faverdin, P., Moreau, S., Charroin, T., Blanchard, M., Stott, A.W., 2016. An approach to holistically assess (dairy) farm eco-efficiency by combining Life Cycle Analysis with Data Envelopment Analysis models and methodologies. Animal, 1-12. doi:10.1017/S1751731116000707.
US EPA, 2011. United States Environmental Protection Agency. Available at: https://www.epa.gov/air-emissions-inventories/2011-national-emissions-inventory-nei-data (last access July 2016).
Vagnoni, E., Franca, A., Breedveld, L., Porqueddu, C., Ferrara, R., Duce, P., 2015. Environmental performances of Sardinian dairy sheep production systems at different input levels. Science of the Total Environment, 502, 354–361. doi:10.1016/j.scitotenv.2014.09.020.
Williams, A., Audsley, E., Sandars, D. 2012. A systems-LCA model of the stratified UK sheep industry. Proc. 8th Intl. Conference on LCA in the Agri-Food Sector, October 1-4, 2012, Saint Malo. France.
Zygoyannis, D., 2006. Sheep production in the word and in Greece. Small Ruminant Research, 62, 143-147, doi: 10.1016/j.smallrumres.2005.07.043.
ENRICO VAGNONI – ENVIRONMENTAL IMPLICATIONS OF DAIRY SHEEP SUPPLY CHAIN AND EVALUATION OF CLIMATE CHANGE MITIGATION ACTIONS FOR SARDINIAN SHEEP FARMING SYSTEMS –TESI DI DOTTORATO IN SCIENZE AGRARIE –CURRICULUM “AGROMETEOROLOGIA ED ECOFISIOLOGIA DEI SISTEMI AGRARI E FORESTALI”–CICLO XXIXANNO ACCADEMICO 2015-2016
UNIVERSITÀ DEGLI STUDI DI SASSARI 9
C
HAPTER1
- E
NVIRONMENTAL PERFORMANCES OFS
ARDINIAN DAIRY SHEEP PRODUCTION SYSTEMS AT DIFFERENT INPUT LEVELSEnrico Vagnoni1, Antonello Franca2, Leo Breedveld3, Claudio Porqueddu2, Roberto Ferrara1,
Pierpaolo Duce1
1Institute of Biometeorology, National Research Council – CNR IBIMET, Sassari, Italy.
2Institute for Animal Production System in Mediterranean Environment, National Research
Council – CNR ISPAAM, Sassari, Italy.
Environmental performances of Sardinian dairy sheep production
systems at different input levels
E. Vagnonia,d,⁎, A. Francab, L. Breedveldc, C. Porqueddub, R. Ferraraa, P. Ducea
a
Institute of Biometeorology, National Research Council— CNR IBIMET, Sassari, Italy
bInstitute for Animal Production System in Mediterranean Environment, National Research Council— CNR ISPAAM, Sassari, Italy c
2B s.r.l., Mogliano Veneto (TV), Italy
d
Department of Science for Nature and Environmental Resources, University of Sassari, Italy
H I G H L I G H T S
• Similar trends in the environmental performances of the sheep farming systems. • No significant difference in 1 kg FPCM Carbon Footprint between farms. • ReCiPe end-point score of the low-impact farm is significantly different.
• Little range of variation of the Carbon Footprint scores (from 2.0 to 2.3 kg CO2-eq per kg FPCM).
• Relevant role of enteric methane emissions, field operations, electricity and machineries.
a b s t r a c t a r t i c l e i n f o
Article history: Received 7 May 2014
Received in revised form 30 June 2014 Accepted 8 September 2014 Available online xxxx Editor: D. Barcelo Keywords:
Dairy sheep farming systems Mediterranean livestock Environmental impacts Life Cycle Assessment Sheep farming comparison
Although sheep milk production is a significant sector for the European Mediterranean countries, it shows serious competitiveness gaps. Minimizing the ecological impacts of dairy sheep farming systems could represent a key factor for farmers to bridging the gaps in competitiveness of such systems and also obtaining public incentives. However, scarce is the knowledge about the environmental performance of Mediterranean dairy sheep farms. The main objectives of this paper were (i) to compare the environmental impacts of sheep milk production from three dairy farms in Sardinia (Italy), characterized by different input levels, and (ii) to identify the hotspots for improving the environmental performances of each farm, by using a Life Cycle Assessment (LCA) approach. The LCA was conducted using two different assessment methods: Carbon Footprint-IPCC and ReCiPe end-point. The analysis, conducted“from cradle to gate”, was based on the functional unit 1 kg of Fat and Protein Corrected Milk (FPCM). The observed trends of the environmental performances of the studied farming systems were similar for both evaluation methods. The GHG emissions revealed a little range of variation (from 2.0 to 2.3 kg CO2-eq per kg of FPCM) with differences between farming systems being not significant. The ReCiPe
end-point analysis showed a larger range of values and environmental performances of the low-input farm were significantly different compared to the medium- and high-input farms. In general, enteric methane emis-sions,field operations, electricity and production of agricultural machineries were the most relevant processes in determining the overall environmental performances of farms.
Future research will be dedicated to (i) explore and better define the environmental implications of the land use impact category in the Mediterranean sheep farming systems, and (ii) contribute to revising and improving the existing LCA dataset for Mediterranean farming systems.
© 2014 Elsevier B.V. All rights reserved.
1. Introduction
The dairy sheep production is a significant sector for the European Mediterranean countries. It is the most important production coming from the extensive and semi-intensive livestock systems typical of the
Mediterranean pastoralism (Abdelguerfi and Ameziane, 2011). These systems of livestock production often represent the only possible economic activities in inland areas and play a crucial role in maintaining both the vitality and the traditions of rural communities, as well as in preventing environmental issues (i.e., soil erosion, desertification, wildfire, etc.).
Sardinia (Italy) is the most important EU region for sheep milk pro-duction, with more than 3.2 million ewes— about 3.5% of the EU total (EUROSTAT, 2012)— and a milk production of about 330.000 t year−1
Science of the Total Environment 502 (2015) 354–361
⁎ Corresponding author at: CNR IBIMET Traversa La Crucca 3, 07100 Sassari, Italy. Tel.: + 39 0792841120.
E-mail address:[email protected](E. Vagnoni).
http://dx.doi.org/10.1016/j.scitotenv.2014.09.020
0048-9697/© 2014 Elsevier B.V. All rights reserved.
Contents lists available atScienceDirect
Science of the Total Environment
(Osservatorio Regionale per l'Agricoltura, 2012), which represents more than 12% of the total European production (EUROSTAT, 2012). More than half of Sardinian sheep milk production is addressed to cheese industry for“Pecorino Romano PDO” (Protected Designation of Origin, European quality label) production (Furesi et al., 2013).“Pecorino Romano PDO” is one of the main Italian PDO products (ISMEA, 2012) and 95% of its production derives from Sardinian cheese factories (Idda et al., 2010).
The dairy sheep farming systems in Sardinia are considered to be pasture-based and quite extensive, but large differences in input utiliza-tion, land use and intensification level exist. This different degree of intensification basically depends on the geographical location of farms, which affects key traits such as arable land availability, soil fertility and possibility for irrigation (Caballero et al., 2009; Pirisi et al., 2001; Porqueddu et al., 1998; Porqueddu, 2008). In the last decades, Sardinian sheep production systems suffered a serious and continuous loss of competitiveness, due to several internal and external factors that caused a deep structural crisis in this traditional sector. As a consequence, Sardinian sheep farms have been realizing low profit margins with negative impacts on both farms' productivity and Sardinian economy (Furesi et al., 2013). As a matter of fact, the economic sustainability of Sardinian sheep farms is based on CAP (Common Agricultural Policy) payments, which account for more than 20% of their gross receipts (Idda et al., 2010).
As production systems' eco-sustainability and climate change miti-gation are on top of the European agenda, minimizing the ecological impacts of farms represent a key factor for farmers to obtaining public incentives and for enhancing the multifunctionality of agricultural systems expressed as services to society (e.g. public goods such as biodi-versity and landscape conservation). Therefore, the optimization of environmental performances could be a crucial factor to improve com-petitiveness of sheep farming, in particular when located in marginal lands. For this purpose it is essential to assess the environmental perfor-mances of these livestock systems and to identify the weak points of the production chain where to take actions for reducing the overall environ-mental impact of farms (FAO, 2010). The environmental impacts (including greenhouse gas emissions) of animal production systems can be evaluated by using the Life Cycle Assessment (LCA) approach (De Boer, 2003). LCA is a widely accepted, complete and standardized computational tool for providing a widespread knowledge on the envi-ronmental aspects associated with products or production processes (Hayashi et al., 2006). It represents also thefirst step towards sustain-ability of production systems, identifying where environmental impacts and damages take place (Chen et al., 2005). However, when applied to agriculture, the method presents some challenges due to the intensive nature of required data, their limited availability and the multiple-output nature of production (FAO, 2010).
The most relevant research studies carried out to evaluate the environmental implications of small ruminant livestock systems using an LCA approach have been conducted mainly in Australia, New Zealand and United Kingdom. It is clear that the majority of LCA studies focused on the main products of sheep livestock systems: wool and meat (Biswas et al., 2010; Brock et al., 2013; Browne et al., 2011; Ledgard et al., 2011; Peters et al., 2011; Williams et al., 2012). To our knowledge very little research has been conducted on the environmental implications of sheep milk production (Michael, 2011). Moreover, very few research studies on LCA of sheep farming systems have been carried out in the Mediterranean context focusing again on meat production ( Ripoll-Bosch et al., 2013).
This study was conducted with the main aim of contributing tofill in these knowledge and data gaps and with the following specific objec-tives of: (i) comparing the environmental impacts of sheep milk production from three Sardinian dairy farms at different input levels; (ii) identifying the hotspots to improve the environmental perfor-mances of each farm, by using an LCA analysis.
2. Materials and methods 2.1. Case studies
During 2011, data were collected from three different dairy farms located in the Province of Sassari (40°43′36″N 8°33′33″E), Northwest-ern Sardinia, Italy. The three studied farms fall into a homogeneous agro-climatic area, with climate conditions typical of the central Mediterranean area, an average annual rainfall of approximately 550 mm, mean monthly temperatures varying from 10 to 26 °C, and elevation ranging from 60 to 350 m a.s.l. Rural landscape is character-ized by dairy sheep farms with a mosaic of feed resources mainly repre-sented by annual forage crops, cereal crops, improved and natural pastures.
The three farms differed mainly in stocking rate, size of grazing areas and concentrates consumption (Table 1), mostly covering the range of input levels for Sardinian sheep livestock (ARAS, 2013). We considered as low input farm (LI), the farm with the lowest stocking rate (1 ewe ha−1), the largest grazing area (95 ha) and the lowest consump-tion of concentrates (1 t per year). On the opposite, the high input farm (HI) showed the highest stocking rate (5.5 ewes ha−1), the smallest grazing area (12 ha) and an annual consumption of concentrates of about 200 t. Mid-input farm (MI) was characterized by intermediate levels of input. Farms had also different market strategy: LI and HI farms sold the milk to the cheese industry for“Pecorino Romano PDO” production, while MI uses its own milk for small-scale on farm cheese production,“Pecorino di Osilo”, which is included in the Italian list of
Table 1
Main characteristics of production system in low- (LI), mid- (MI), and high-input (HI) dairy farms. Data refer to 2011.
Low-input (LI) Mid-input (MI) High-input (HI)
Heads (number) 120 320 370
Stocking rate (ewes ha−1) 1.0 4.6 5.5
Milk production (kg year−1) 25,000 79,655 110,000
Milk pro-capita annual production (kg ewe−1year−1) 208 249 297
Pastures— grazing area (ha) 95 52 12
Arable land— cereals and annual forage crops (ha) 30a
18 55
Total utilized agricultural area (ha) 125 70 67
Concentrate feed annual consumption (t)b
1 121 204
Mineral N-fertilizing (kg ha−1) 0 21 45
Mineral P2O5-fertilizing (kg ha−1) 0 72 32
Irrigation No Yes No
Milking system Manual Mechanical Mechanical
Manpower 2 part-time workers 3 full-time and 1 temporary workers 3 full-time and 1 temporary workers
a
10% of the arable land production is used for sheep feeding; the remaining part is sold as hay and grain.
b
LI produces all concentrates on farm, MI imports all concentrate feed needed, and HI imports about 86% of total requirements.
355 E. Vagnoni et al. / Science of the Total Environment 502 (2015) 354–361
typical agri-food products. Moreover, MI was the only farm that used the aseasonal lambing technique, which leads to an extension of the lacta-tion ewe period, needing a specific feed strategy and farm management with relevant influences on the farm input level.
2.2. Life Cycle Assessment methodology
The methodology used to carry out the LCA study is consistent with the international standardsISO 14040–14044 (2006a,b). The analysis was conducted using 1 kg of Fat and Protein Corrected Milk (FPCM) as functional unit (FU), as suggested by theFAO (2010)andIDF (2010)
for dairy sector Carbon Footprint assessment. FPCM amounts expressed in kg were calculated using the equation byPulina and Nudda (2002): FPCM¼ RM 0:25 þ 0:085FC þ 0:035PCð Þ
where RM, FC, and PC indicate raw milk amount (kg), fat content (%), and protein content (%) of the raw milk, respectively.
Since all three farms in addition to milk produced also meat and wool, all inputs and outputs were partitioned (impact allocation) between milk and the other co-products, on the basis of the economic value of products. The economic allocation procedure was preferred to other criteria indicated by ISO prescriptions (e.g. system expansion/substitution or physical allocation) considering the large economic value differences between the“main product” (milk) and the other co-products (wool and meat) (Table 2). When co-products were obtained from the samefield (e.g., triticale-barley grain and stubble), mass-based allocation was applied, since the amounts of the individual co-products are interdependent in a physical relationship and an increase in the output of each specific co-product causes an increase in production in direct proportion.
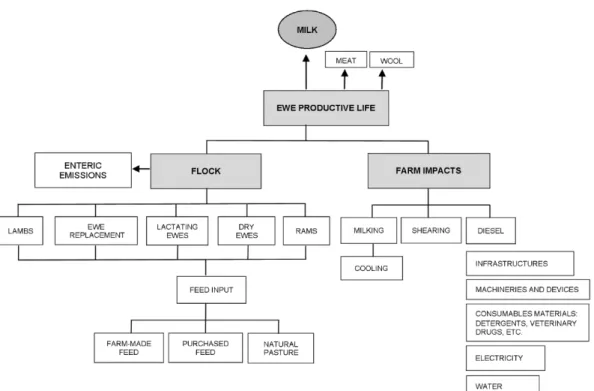
The life cycle was assessed“from cradle to gate”, including in the system boundaries all the input and output related to sheep milk production (Fig. 1). All modes of transportation and distances covered within the system were also taken into account. In addition, all the emissions into the soil, air and water from the use of fertilizers were included. The emissions from pesticides, which were used in very small quantities just in HI farm, were also included. The emissions from the livestock manure were excluded from the system's bound-aries. The model system was divided into two subsystems: a) Flock, and b) Farm Impact.
a) Flock— Processes linked with the productive life of livestock. They include all the processes related to i) the land use and all the other inputs and agricultural operations required for feed produc-tion (e.g. seeds, fertilizers, pesticides, fuel, etc., and plowing, sowing, harrowing, irrigation, haymaking, threshing, etc.; ii) the whole consumption of feed from pastures and concentrates; iii) livestock operations such as shearing (once a year) and milking (performed twice a day if mechanical, once a day if manual). Each of these processes has been applied to the different categories of sheep, depending on the breeding techniques adopted by each farm, having as primary reference points the quantity and quality of sheep diet. Therefore, LCA model includes ewes and rams, each subdivided into lambs, replacement animals and adults. The ewes were grouped by physiological and productive phase (maintenance, dry and lactation).
b) Farm Impact— Processes linked with the farm structure.
They include infrastructures (milking parlor, barns, etc.), agriculture machineries and devices (tractors, plows, milk cooler, pumps, etc.), water and energy consumption, and consumable materials like detergents, veterinary drugs, spare parts, etc.
All data were organized into a life cycle inventory, the process that quantifies energy and raw material requirements, atmospheric emissions, waterborne emissions, solid wastes, and other releases for the entire life cycle of a product. Primary data collection was carried out through 12 visits in situ, interviews and a specific questionnaire, and included data on utilized agricultural area and forage crop yield, characteristics of farm infrastructures (milking parlor, barns, silos, etc.), processes directly related toflock (e.g. quality and quantity of production, number of heads, flock diet, etc.), characteristics and consumptions of fuel, power, etc. from equipment and machinery, and consumptions of raw materials and chemicals. The remaining data were collected from available literature (in particular enteric methane emissions and forages consumptions) and databases (mostly Ecoinvent v. 2.2 developed by Swiss Centre for Life Cycle Inventories). Ecoinvent database was mainly used for quantifying the environmental impacts involved in the following elements of the productive system: power production, equipment and agricultural machinery,field operations, crops, chemicals, raw materials and consumables, heat production from boiler and power generators, transportation. However, the sum of primary and representative secondary data was never below 98% of the overall data collected for each farm.
The LCA analysis was conducted using two evaluation methods: 1)IPCC, Intergovernmental Panel on Climate Change (2006), which provides estimates on greenhouse gases emitted in the life cycle of products (Carbon Footprint), expressed in kilograms of CO2-equivalents, using a 100-year time horizon; and 2) ReCiPe end-point method (ReCiPe Endpoint (H) V1.06/Europe ReCiPe H/A), that provides a wider assessment of life cycle environmental performances compared toIPCC (2006), considering 18 different categories of environmental impact (Goedkoop et al., 2009). Over the past years, the Carbon Footprint has become one of the most important environmental protec-tion indicators. It is widely used in agricultural LCA analysis and repre-sents a reliable tool for comparing results from different research studies. We used also the ReCiPe end-point method for taking into account a larger range of impact categories and for assessing in a more comprehensive way the environmental performances of sheep farming systems. In addition, the choice of the end-point approach provides the most appropriate and understandable level of aggregation for comparing the environmental impacts of production systems, since our study does not need to deal separately with the environmental relevance of the category indicators.
The life-cycle analysis was performed under the following simpli-fied assumptions: the analysis included only the amount of forage (fodder crops and pastures) consumed by flocks, after cross-checking estimated and/or measured forage production and estimat-ed nutritional neestimat-eds basestimat-ed on gender, age, weight, physiological stage and production level of animals. Enteric methane emissions were quantified using the national emission factor proposed by
ISPRA (2011)and based on the simplified IPCC's Tier 1 approach (IPCC, 2006). N2O enteric emission estimates were based on the methodology proposed byIPCC (2006).
LCA calculation was made using LCA software SimaPro 7.3.3 (PRé
Consultants, 2011), which contains various LCA databases.
A Monte Carlo analysis was also performed using the SimaPro software to quantify the effects of the data uncertainties on the final results and to evaluate the significance of the difference between the environmental performances of the three farms based on both LCA methods (Carbon Footprint and ReCiPe). The analysis consisted in multiple comparisons involving each pair of farm environmental scores.
Table 2
Economic allocation of co-products from dairy farm case studies, low- (LI), mid- (MI), and high-level input (HI) farms.
LI MI HI
Milk 86.5% 91.0% 87.6%
Lamb meat 12.5% 6.7% 9.9%
Sheep meat 0.4% 1.7% 2.0%
Wool 0.6% 0.6% 0.5%
3. Results and discussion 3.1. Inventory analysis
The life cycle inventory of the main impact categories for the total annual production of FPCM by farm is reported inTable 3. The variability of the input/output values reflects the differences between the three productive systems: LI farm showed the lowest values for all the impact
categories while HI farm showed the highest, with the exception of water and cypermethrin (a synthetic pyrethroid used as an insecticide), which appeared to be the largest impact categories for MI farm compared to LI and HI.
3.2. Evaluation of the environmental performances
The environmental impact assessment of each farm (LI, MI, and HI), conducted using the IPCC and ReCiPe methods is presented in the fol-lowing paragraphs.
3.2.1. IPCC
The estimated life-cycle greenhouse gas (GHG) emissions of 1 kg of FPCM were slightly higher in MI (Fig. 2). The GHG emissions per kg of FPCM from the observed production systems showed a little range of
Fig. 1. Flow chart of sheep milk production.
Table 3
Inventory of the impact categories for the total annual production of FPCM of three farms at different level of input consumption (low— LI, mid — MI, and high — HI).
Category Unit LI MI HI Water m3 188 4959 3652 CO2 kg 25,372 54,346 93,651 CO2biogenic kg 639 1496 2452 Methane kg 42 90 153 Methane biogenic kg 1043 3339 3679
Occupation, pasture and meadow ha year−1 12 47 53
Occupation, arable, non-irrigated ha year−1 0.1 8 10
Dinitrogen monoxide kg 6 85 176
Transformation from forest m2 25 833 1125
Phosphorus, in water kg 1.7 9.6 11.8
Nitrogen oxide kg 158 337 673
Isoproturon kg 0.1 1.4 3.0
Occupation industrial area m2
42 748 1024 Phosphate kg 26 72 128 Sulphur dioxide kg 56 149 240 Methane, tetrafluoride g 7 12 22 Sulphur hexafluoride g 1 2 3 Phosphorus, in ground g 6 17 28 Ethan, hexafluoride g 0.7 1.4 2.5 Cypermethrin mg 31 673 624 Nitrogen oxides kg 158 337 673 Particulates kg 29 53 102
Oil crude in ground kg 4707 10,746 18,979
Gas natural in ground m3
2266 4949 8282
Coal kg 4388 7935 13,321
Fig. 2. Mean values and standard errors of the Carbon Footprint (IPCC, 2006) of low- (LI), mid- (MI), and high-input level (HI) farms. The functional unit (FU) is 1 kg of FPCM (Fat and Protein Corrected Milk).
357 E. Vagnoni et al. / Science of the Total Environment 502 (2015) 354–361
variation with values approximately equal to 2.0 (LI), 2.2 (HI) and 2.3 (MI) kg of CO2-eq, and standard errors ranging from 0.20 (LI) to 0.29 (MI and HI) kg of CO2-eq. Differences between farming systems in GHG emissions were not significant, as illustrated inSection 3.4 dedicat-ed to the Monte Carlo analysis results. The lowest Carbon Footprint of LI compared to the more intensified farming systems of MI and HI can be explained by different factors which are crucial in determining the rela-tion between inputs and outputs. The most critical advantages of LI compared to MI and HI were (i) its lower use of agricultural machinery forfield operations, and (ii) its lower power consumptions. In addition, LI milk production showed larger values of fat and protein contents compared to both MI and HI, which implied a relevant improvement of the productive performance when the raw milk production was expressed in FPCM.
The comparison of the Carbon Footprint of MI and HI, which adopted more homogeneous farm management models, indicated similar performance results with a light advantage for the more intensified farming system HI. This result is in line with thefindings reported in previous research studies (FAO, 2010; Hayashi et al., 2006; Michael, 2011), where it was shown that more intensive systems have a lower environmental impact per kg product than extensive one.
When we compared our study with the little research studies conducted on sheep milk, our LCA results showed that the average Carbon Footprint of our three farm systems (2.17 kg CO2-eq/kg FPCM) was about 39% lower than that estimated byMichael (2011)on a typical Australian dairy farm, where the Carbon Footprint was equal to 3.57 kg CO2-eq/kg FPCM.
The study ofMichael (2011)was conducted on an intensive dairy sheep farming system characterized by East Friesian sheep bred with very high productivity (421 kg ewe−1year−1of milk) and feed require-ments, a stocking rate equal to 8 ewes ha−1, a phosphate fertilizer use of 200 kg ha−1year−1, a potash fertilizer use of 100 kg ha−1year−1 and a concentrate feed annual consumption of about 190 kg ewe−1t. The enteric emission factor for methane emission estimate (16.9 kg CH4ewe−1year−1) was based on the methodology proposed by theDepartment of Climate Change (2006), which adopted a more detailed approach than the IPCC's Tier 2 (IPCC, 2006). This source of GHG emissions represented the largest contributor (82%) to the total global warming potential, followed by fertilizer (9%).
Beyond the structural differences between Australian and Sardinian case studies, a relevant element that can likely explain what we obtain-ed comparing our Carbon Footprint results withMichael (2011) find-ings is the enteric methane emission factor we used. We adopted the methodology proposed byISPRA (2011), which is based on the more simplified IPCC's Tier 1 approach (IPCC, 2006), and hasfixed methane emission rates for sheep livestock in Italy (8.0 kg CH4ewe−1year−1). In other terms, the value of the methane emission factor used in our study is more than 50% lower than the emission factor used by
Michael (2011). However, also in our case studies the largest contribu-tor to the total global warming potential was the methane enteric emission, which contributed to a lesser extent (42% on average) than in the case study illustrated byMichael (2011).
3.2.2. ReCiPe
The results from the ReCiPe end-point method assessment followed a trend similar to IPCC method (Fig. 3). To facilitate the interpretation of results, only impact categories with scores higher than 10 milli-ecopoint (mPt) per 1 kg of FPCM are shown. The ReCiPe end-point results indi-cate scores for each farm equal to 309 (LI), 480 (MI), and 426 (HI) mPt, with standard errors approximately equal to 40, 77, and 64 mPt, respectively. The overall environmental performances of LI showed to be significantly different compared to the other farms (see also
Section 3.4). The comparison between MI and HI scores confirms the results obtained using the IPCC method: performances are similar, not significantly different, with a light advantage for the more intensified farming system HI.
For all farms, the most relevant impact category is represented by ‘Agricultural land occupation’, which resulted responsible of about 50% of the total estimated impact (from 48% for LI to 57% for MI). The impact category‘Climate change — Human Health’ contributed to the overall scores with values ranging from 13% to 18%, representing the second impact category for all farms. Other relevant impact categories for all farms were‘Fossil depletion’, and ‘Climate change — Ecosystems’, with an average value equal to about 10%, and‘Particulate matter formation’, which was responsible in average for about 4% of the overall impact. In the case of MI and HI, a further impact category significantly responsible for their overall scores was‘Natural land transformation’, with values around 10% of the total score.
The impact categories with scores less than 10 mPt (Remaining categories) represented less than 2.5% of the overall scores. For MI and HI farms, 94% of the impact determined by the‘Remaining categories’ was due to the categories‘Human toxicity’ (more than 60%), ‘Urban land occupation’, and ‘Terrestrial ecotoxicity’. For LI, the majority (94%) of the impacts determined by the‘Remaining categories’ was due to‘Human toxicity’ (more than 55%), ‘Urban land occupation’, and ‘Natural land transformation’.
The possible explanations of the results obtained using the ReCiPe method are similar to the reasons that explained the IPCC method findings. However, the ReCiPe method analysis revealed considerable differences between the farm with the lowest input level and the other farms, and indicated that a large part of this differences can be attributed to the impact category‘Agricultural land occupation’, which showed absolute scores approximately equal to 149, 278, and 222 for LI, MI, and HI, respectively, contributing to the 50% of the overall impact of each farm.
These results confirm that agricultural land occupation and, more generally, land use impact category are critical aspects of LCA analysis, in particular when the agricultural sector is investigated (Schmidinger and Stehfest, 2012).
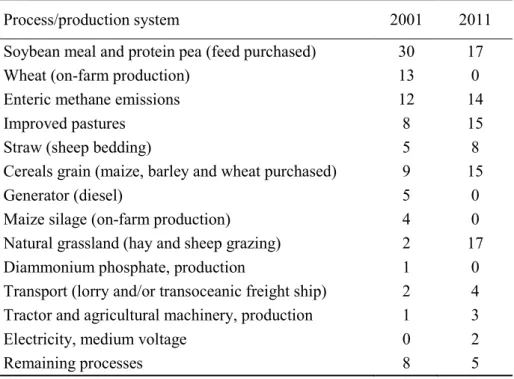
3.3. Contribution analysis
A detailed contribution analysis is reported in Table 4, which illustrates all processes that contributed with more than 1% to the total environmental impact of all farms for the two different evaluation methods adopted. In general, the analysis of the contributions of individual processes for the three farming systems and both evaluation methods showed a relevant role of enteric methane emissions,field operations (mainly tillage), electricity and production of agricultural machineries. In MI and HI, feed concentrates in the diet (in particular soy production) showed a relevant contribution, with percentages
Fig. 3. Mean values and standard errors obtained using the ReCiPe end-point impact assessment method for the functional unit 1 kg of FPCM for low- (LI), mid- (MI), and high-input level (HI) farms. Impact effects are expressed in milli-ecopoints (mPt). Impact categories with scores lower than 10 mPt are included in the group‘Remaining categories’.
ranging from 16% for HI (IPCC method) to 30% for MI (ReCiPe method). The natural and improved pastures utilization resulted in relevant contribution only for the ReCiPe assessment method (48% in LI, 45% in MI and 45% in HI), essentially for the effect of the Agricultural Land Occupation impact category. The contribution of agrochemicals was generally low (always less than 3%), due to their very limited use in all the three farms. However, the incidence of contribution of each process varied with the evaluation method utilized. For example, the enteric methane emission is the most important impact (an overall average of 42% of total impacts) for the IPCC method, which estimates the amount of GHG produced by each process and the relative contribution to global warming, but when the estimate is performed using the ReCiPe method, which takes into account 16 additional impact categories, the impact of the enteric methane emissions amounted on average to 11%, representing only thefifth highest-ranked impact. The combined use
of the two methods provided a balanced picture that resulted in a more comprehensive assessment of impacts.
The analysis of contributions has been also useful for identifying more specific strengths and weaknesses of each dairy sheep farming system, in order to improve their environmental performances.
Enteric methane emissions represented the most important envi-ronmental impact factor for all the farms when the IPCC method was used. This result is consistent with the actual knowledge about the role played by the enteric methane fermentation in ruminant livestock emissions, which are estimated to represent approximately 18% of the global anthropogenic GHG emissions (FAO, 2006). Few practical strate-gies can be followed for reducing enteric methane emissions of grazing animals (Hegarty et al., 2007), mainly by regulating the quantity and quality of feed consumed (Pelchen and Peters, 1998) or utilizing inhib-itors of enteric fermentation (Martin et al., 2010; Nolan et al., 2010; Puchala et al., 2005; Tiemann et al., 2008; Wallace et al., 2006). Howev-er, further research studies are needed to carefully analyze the complex-ity of relations among breeding techniques and enteric gas emissions (e.g., methane and nitrous oxide).
For ReCiPe method, the major contributions to the environmental impact of LI are due to land use on natural and improved pastures (48%),field operations (21%), enteric methane emissions (14%), and electricity (8%). The power consumption of LI depended mainly on milk cooling and therefore an improvement of the environmental performance of this farm could be achieved choosing the proper size of the cooling tank and/or adopting a more efficient cooling system, pos-sibly powered by renewable sources. In addition, LI showed a relevant contribution to the overall impact determined by tractor and other de-vices, such as pick-up and generator diesel (10% and 8% for IPCC and ReCiPe methods, respectively). This contribution is at least double com-pared to the contribution observed in the other farms and it can be likely due to the use of over-dimensional and power-consuming equipment compared to the farm needs.
The contribution offield operations (tillage and sowing) to the total environmental impact of the productive cycle of 1 kg of FPCM was large-ly lower in MI (with values never exceeding 8%) than in the other farms, for both methods. This result could be probably due to the minimum tillage practice used by MI for sowing of pasture mixtures. However, the environmental performances of MI could be improved by reducing the purchase of feed concentrates and consequently increasing the
Table 4
Percentage contribution of processes to the total environmental impact of low- (LI), mid-(MI) and high-input level (HI) farms, using two evaluation methods (IPCC and ReCiPe endpoint) and 1 kg of FPCM as functional unit. The process category“Remaining process-es” includes all the processes with a percentage contribution lower than 1% for all methods and farms.
Method IPCC ReCiPe
endpoint
Process/farm LI MI HI LI MI HI
Enteric methane emissions 45 46 34 14 10 8
Field operations (tillage and sowing) 27 8 16 21 4 8
Electricity, medium voltage 13 5 3 8 2 1
Natural pastures 1 2 0 31 24 9
Improved pastures 0 2 16 17 21 36
Concentrate feed 1 21 16 1 30 26
Lactating ewes (feed consumption and animal excretion) 1 1 1 0 0 0 Infrastructures (milking parlor, barn, etc.) 0 2 1 0 0 0 Irrigating (infrastructure and water consumption) – 0 0 – 0 0
Tractor, production 4 2 2 3 1 1
Pick-up vehicle, production 1 0 0 1 0 0
Agricultural machinery, production 5 3 2 4 1 2
Transport (lorry and/or transoceanic freight ship) 0 5 4 0 1 1 Water consumption (milking and irrigating excluded) 0 0 0 0 0 0
Agrochemicals (urea, glyphosate, etc.) – 0 3 – 0 2
Consumable materials (detergent, veterinary drugs, etc.) 0 0 0 0 0 0
Remaining processes 2 3 2 0 6 6
Fig. 4. Monte Carlo results of the comparisons between Carbon Footprints from low- (LI), mid- (MI), and high-input level (HI) farms. The analysis consisted in multiple comparisons involving each pair of mean values.
359 E. Vagnoni et al. / Science of the Total Environment 502 (2015) 354–361
amount of pasture and self-produced hay in the diet offlock. To achieve this result, an increase of the total surface sown with well adapted and high quality pasture mixtures may be suggested (Franca et al., 2008; Porqueddu and Maltoni, 2005). The overall high consumption of electricity suggests to introduce a farm strategy based on renewable source power supply. Finally, it may be appropriate to assess a proper sizing of the machinery stock, in relation to the needs of MI.
The contribution of concentrate feed was particularly large in MI, despite lower annual consumption per capita compared to HI (0.38 t ewe−1versus 0.55 t ewe−1). It is important to note that HI produced about 24% of its concentrate needs on-farm and had a larger annual milk yield per ewe compared to MI, which imported all concen-trate. In HI, improved pastures and concentrate feed contributed largely to its overall environmental impact. Taking this result into account, a possible strategy to reduce the environmental performances of HI could consist in increasing the agricultural surface area utilized for per-manent semi-natural pastures andfinding proper pasture management strategies (i.e., deferred grazing during spring to allow self-reseeding). Moreover, improving power supply strategy could represent an effec-tive way to enhance the HI environmental performance, as well as for the other farms.
3.4. Monte Carlo analysis
Figs. 4 and 5show the graphical results of the uncertainty analysis for the multiple comparisons between the farm environmental perfor-mances estimated using both theIPCC (2006)and the ReCiPe end-point methods.
Differences between the Carbon Footprint of farms (Fig. 4) were in general not significant with the higher level of statistical significance obtained for the comparison MI≥ LI (p N 85%). When the uncertainty analysis was performed using the ReCiPe end-point single scores (Fig. 5), the low-input farming system resulted significantly lower than the medium- and high-input systems with a level of statistical significance always higher than 99%. As discussed above, the relevant differences between the LI farm and the other farms when using the ReCiPe end-point single score can be largely attributed to the impact category‘Agricultural land occupation’.
4. Conclusions
In this work, LCA approach was used for comparing dairy sheep production systems at different input levels and for identifying the hotspots to improve their environmental performances. The LCA analy-sis, conducted using 1 kg of Fat Protein Corrected Milk as functional unit and two different assessment methods (IPCC and ReCiPe), provided a balanced picture of the environmental performances of the sheep farm-ing systems, resultfarm-ing in a more comprehensive assessment of impacts. The trends of the environmental performances of the studied farm-ing systems were similar for both evaluation methods. The low-input and medium-input farms showed the lowest and highest scores, respec-tively. Further, the GHG emissions revealed a little range of variation (from 2.0 to 2.3 kg CO2-eq per kg of FPCM) with differences between farming systems being not significant. The ReCiPe end-point results showed scores ranging from 309 (LI) to 480 mPt (MI) and environmental performances of LI significantly different compared to MI and HI farms.
In general, this study shows the relevant role played by enteric methane emissions,field operations, electricity and production of agricultural machineries in the overall environmental performances estimated by both evaluation methods. However, for ReCiPe end-point method the major contributions to the environmental impact are due to land use on natural and improved pastures.
In conclusion, future research will be devoted to (i) explore and better define the environmental implications of the land use impact category in the Mediterranean sheep farming systems, and (ii) contribute to revise and improve existing LCA dataset for Mediterranean farming systems. Acknowledgments
This study was conducted under the Project CISIA“Integrated knowl-edge for sustainability and innovation of Italian agri-food sector”, coordi-nated by the Agrifood Sciences Department of the National Research Council (CNR-DAA) and partially funded by MEF— Ministry of Economy and Finance of Italy, Act no. 191/2009. Moreover, a part of the work was carried out under the doctoral course on Agrometeorology and Ecophys-iology of Agricultural and Forestry Eco-Systems at the University of Sassari. The authors wish to acknowledge Mr. Daniele Nieddu for the technical help.
Fig. 5. Monte Carlo results of the comparisons between ReCiPe endpoint results from low- (LI), mid- (MI), and high-input level (HI) farms. The analysis consisted in multiple comparisons involving each pair of mean values.
References
Abdelguerfi A, Ameziane TE.Interactions between cereal cropping systems and pastoral areas as the basis for sustainable agricultural development in Mediterranean countries. In: Lemaire G, Hodgson J, Chabbi A, editors. Grassland productivity and ecosystem services. UK: CAB International Oxfordshire; 2011. p. 261–70.
ARAS. Data Warehouse of the Regional Association of Sardinian Farmers. Available on internet atwww.ara.sardegna.it, 2013. [last access: Jan 15, 2014].
Biswas WK, Graham J, Kelly K, John MB.Global warming contributions from wheat, sheep meat and wool production in Victoria, Australia, a life cycle assessment. J Clean Prod 2010;18(14):1386–92.
Brock P, Graham P, Madden P, Douglas JA.Greenhouse gas emissions profile for 1 kg of wool produced in the Yass Region, New South Wales: A Life Cycle Assessment approach. Anim Prod Sci 2013;53:445–508.
Browne NA, Eckard RJ, Behrendt R, Kingwell RS.A comparative analysis of on-farm green-house gas emissions from agricultural enterprises in south eastern Australia. Anim Feed Sci Technol 2011;166–167:641–52.
Caballero R, Fernández-Gonzáles F, Pérez Badia R, Molle G, Roggero PP, Bagella S, et al.
Grazing systems and biodiversity in Mediterranean areas: Spain, Italy and Greece. Pastos 2009;39:3–154.
Chen G, Orphant S, Kenman SJ, Chataway RG.Life cycle assessment of a representative dairy farm with limited irrigation pastures. Proceedings of the 4th Australian Conference on Life Cycle Assessment— Sustainability Measures for Decision Support; 2005. p. 1–11. [23–25 February 2005, Sydney, Australia].
Consultants PRé. Software LCA SimaPro 7.3; 2011 [Netherlands (www.pre.nl)]. De Boer IJM.Environmental impact assessment of conventional and organic milk
production. Livest Prod Sci 2003;80:69–77.
Department of Climate Change.Methodology for the estimation of greenhouse as emissions and sinks: agriculture. Department of Climate Change. Canberra, Australia: National Circuit; 2006.
Database available at EUROSTAThttp://epp.eurostat.ec.europa.eu/tgm/table.do?tab= table&init=1&plugin=1&language=en&pcode=tag00017, 2012. [last access: 10 Sep 2013].
FAO.Livestock's long shadow: environmental issues and options. Rome, Italy: Food and Agriculture Organization of the United Nations; 2006.
FAO.Greenhouse gas emissions from the dairy sector. A Life Cycle Assessment. Rome, Italy: Food and Agriculture Organization of the United Nations; 2010.
Franca A, Caredda S, Dettori D, Sanna F.Introducing new grass–legume mixtures for pasture improvement in agro-pastoral farming systems. Options Méditerr, Ser A 2008;79:203–6.
Furesi R, Madau FA, Pulina P.Technical efficiency in the sheep dairy industry: an application on the Sardinian (Italy) sector. Agric Food Econ 2013;1(4):1–11.
Goedkoop M, Heijungs R, Huijbregts MAJ, De Schryver A, Struijs J, van Zelm R.ReCiPe 2008. A life cycle impact assessment method which comprises harmonised category indicators at the midpoint and the endpoint levelFirst ed. ; 2009 [Report I: Character-isation, NL. www.lcia-recipe.net/last access: Jan 20, 2013].
Hayashi K, Gaillard G, Nemecek T.Life cycle assessment of agricultural production systems: current issues and future perspectives. Proceedings of the International Seminar on Technology Development for Good Agriculture Practice in Asia and Oceania; 2006. p. 98–109. [Taipei, Taiwan].
Hegarty RS, Goopy JP, Herd RM, McCorkell B.Cattle selected for lower residual feed intake have reduced daily methane production. J Anim Sci 2007;85:1479–86.
Idda L, Furesi R, Pulina P.Economia dell'allevamento ovino da latte. Franco Angeli Milano; 2010.
IDF.A common carbon footprint approach for dairy: the IDF guide to standard lifecycle assessment methodology for the dairy sector. Bull Int Dairy Fed 2010: 445.
IPCC. 2006 IPCC guidelines for national greenhouse gas inventories: volume 4: agriculture, forestry and other land use. Paris, France: Intergovernmental Panel on Climate Change; 2006 [http://www.ipcc-nggip.iges.or.jp/public/ 2006gl/vol4.htm].
ISMEA. Italian institute for food and agricultural products. Database available athttp:// www.ismea.it/flex/cm/pages/ServeBLOB.php/L/IT/IDPagina/4173, 2012. [last access: Dec 8, 2013].
ISO.ISO 14040 international standard. Environmental management— life cycle assess-ment— principles and framework. Geneva, Switzerland: International Organisation for Standardization; 2006a.
ISO.ISO 14044 international standard. Environmental management— life cycle assess-ment— requirements and guidelines. Geneva, Switzerland: International Organisa-tion for StandardisaOrganisa-tion; 2006b.
ISPRA.National greenhouse gas inventory system in Italy. Year 2011. Rome: Istituto Superiore per la Protezione e la Ricerca Ambientale; 2011.
Ledgard SF, Lieffering M, Coup D, O'Brien B.Carbon footprinting of New Zealand lamb from the perspective of an exporting nation. Anim Front 2011;1(1):40–5.
Martin C, Morgavi DP, Doreau M.Methane mitigation in ruminants: from microbe to the farm scale. Anim 2010;4:351–65.
Michael D.Carbon reduction benchmarks and strategies: new animal products. Australian Government, rural industries research and development corporation. RIRDC Publica-tion No. 11/063, RIRDC Project No. PRJ-003369; 2011. p. 115.
Nolan JV, Hegarty RS, Hegarty J, Godwin IR, Woodgate R.Effects of dietary nitrate on fermentation, methane production and digesta kinetics in sheep. Anim Prod Sci 2010;50:801–6.
Osservatorio Regionale per l'Agricoltura. Lafiliera ovicaprina in Sardegna. Report available athttp://www.sardegnaagricoltura.it/documenti/14_43_20131220133546.pdf, 2012. Pelchen A, Peters KJ.Methane emissions from sheep. Small Rumin Res 1998;27:37–150.
Peters GM, Wiedemann S, Rowley HV, Tucker R, Feitz AJ, Schulz M.Assessing agricultural soil acidification and nutrient management in life cycle assessment. Int. J. Life Cycle Assess. 2011;16:431–41.
Pirisi A, Piredda G, Scintu MF, Fois N.Effect of feeding diets on quality characteristics of milk and cheese produced from Sarda dairy ewes. Options Méditerr, Sér A 2001;46: 115–9.
Porqueddu C.Low-input farming systems in Southern Europe: the role of grasslands for sustainable livestock production. Proc. of the JRC Summer University: low input farm-ing systems: an opportunity to develop sustainable agriculture; 2008. p. 52–8. [Ranco, 2–5 July 2007].
Porqueddu C, Maltoni S.Evaluation of a range of rainfed grass–legume mixtures in a Mediterranean environment. Proceedings of COST 852 WG1 and WG2 meeting; 2005. p. 113. [Ystad, Sweden].
Porqueddu C, Fara G, Caredda S, Busu F, Sechi R, Pintus G.Sardinian cereal–dairy sheep farming systems: evaluation of the potential environmental impact using nutrients surplus estimation. Proceedings of the 17th General Meeting of the European Grassland Federation; 1998. p. 369–72. [Debrecen, Hungary, 18–21 May 1998].
Puchala R, Min BR, Goetsch AL, Sahlu T.The effect of a condensed tannin-containing forage on methane emission by goats. J Anim Sci 2005;83:182–6.
Pulina G, Nudda A.Milk production. In: Pulina G, editor. Dairy sheep feeding and nutri-tion; 2002. p. 11–3. [Edizioni Avenue media (Bologna)].
Ripoll-Bosch R, de Boer IJM, Bernués A, Vellinga TV.Accounting for multi-functionality of sheep farming in the carbon footprint of lamb: a comparison of three contrasting Mediterranean systems. Agr Syst 2013;116:60–8.
Schmidinger K, Stehfest E.Including CO2implications of land occupation in LCAs-method
and example for livestock products. Int J Life Cycle Ass 2012;17(8):962–72.
Tiemann TT, Lascano CE, Wettstein HR, Mayer AC, Kreuzer M, Hess HD.Effect of the tropical tannin-rich shrub legumes Calliandra calothyrsus and Flemingia macrophylla on methane emission and nitrogen and energy balance in growing lambs. Anim 2008;2:790–9.
Wallace RJ, Wood TA, Rowe A, Price J, Yanez DR, Williams SP, et al.Encapsulated fumaric acid as a means of decreasing ruminal methane emissions. In: Soliva CR, Takahashi J, Kreuzer M, editors. Greenhouse gases and animal agriculture: an update, International Congress Series No. 1293. The Netherlands: Elsevier; 2006. p. 148–51.
Williams A, Audsley E, Sandars D.A systems-LCA model of the stratified UK sheep industry. Proc. 8th Intl. Conference on LCA in the Agri-Food Sector; 2012. [October 1–4, 2012, Saint Malo. France].
361 E. Vagnoni et al. / Science of the Total Environment 502 (2015) 354–361