Doctoral School in Engineering
Mechanical and Industrial Engineering Section XXVII c.
P
RESENTING UNCERTAINTY IN
GENERAL AVIATION
UI
S FOR
SUPPORTING DECISIONS IN
SAFETY CRITICAL SITUATIONS
Candidate: Giuseppe Frau
ABSTRACT
This PhD research aims at studying the presentation of uncertain data to the operators of highly automated and safety critical systems such as pilots and air traffic controllers. Despite the efforts for increasing accuracy and predictability, uncertainty remains an intrinsic component in aviation and air traffic management (ATM) systems. Moreover, systems with high levels of automation, i.e. prediction algorithms, can produce further information characterized by uncertainty. In this work I present the design and development of an interface focusing on the uncertainty visualization method and solutions.
A literature review explores the relationships between the data, the highly automated systems and the human. The aspects embraced in the review describe, in addition, the nature of the visualization problem for the uncertain data.
Experimental results from three different case studies centred on the light general aviation domain are presented and discussed. Results from user observations and human in the loop simulation analysis indicate that uncertain data can be used and may provide concrete benefits, in the specific case on the situational awareness component. An accurate design process that supports the introduction of features involving uncertain data must be is in place, however, to observe the desired benefits. Such process must involve users and/or domain experts as it requires a set of specific information that it is unlikely to be elicited by other means. To support this process, a framework for the visualization of uncertain data is described at the end of the thesis.
The aim is to demonstrate that raising awareness about the uncertainty through the presentation on the user interface can be an effective approach to cope with the side effects of automation and may allow an effective usage of such information.
TABLE OF CONTENTS
ABSTRACT ... 1
LIST OF FIGURES ... 4
INTRODUCTION ... 7
Motivations and Problem Statement ... 7
Thesis Overview ... 9
LITERATURE REVIEW ON AUTOMATION AND UNCERTAINTY VISUALIZATION ... 11
Chapter overview ... 11
Automation and impacts of automation on humans ... 11
Uncertainty Visualization ... 27
LIGHT GENERAL AVIATION DOMAIN ... 35
Chapter overview ... 35
Light General Aviation Definition ... 35
Flight Freedom ... 38
Predictability of the flights ... 39
Relations with SESAR Program and Safety considerations ... 41
METHODOLOGICAL APPROACH ... 43
Planning the human centred process ... 44
Understanding the context of use ... 45
Specifying user requirements ... 46
Producing design solutions ... 47
Evaluate designs ... 48
EXPERIMENTS, RESULTS AND CONTRIBUTIONS ... 51
Automation and Uncertainty - SeparA Case Study ... 53
Usage of uncertain data to support safety critical decisions – ProGA Case Study ... 62
Concept Refinement – Predy Case Study ... 125
DISCUSSION ... 145
CONCLUSIONS ... 157 REFERENCES ... 160 APPENDIX 1 – Complete list of found issues ... 168
LIST OF FIGURES
Figure 1 - Four classes of functions in Parasuraman work ... 13
Figure 2 - Endsley Model of Situation Awareness ... 20
Figure 3 - Attention Management as a function of time (M. Cummings) ... 26
Figure 4 - Table from Pang et Al (1996) for classifying main uncertainty visualization methods ... 30
Figure 5 - Potter et Al. Anatomy of a Summary Plot ... 31
Figure 6 - Using sketchiness as visual variable to convey uncertainty ... 32
Figure 7 - Usage of glyphs from Pang 1996. Spherical glyphs scaled to radiosity differences (left). Uncertainty vectors glyphs (right) .. 32
Figure 8 - CESSNA 172 model. Typically used for training purposes 36 Figure 9 - Local flight. Basic training ... 40
Figure 10 - Cross country flight ... 41
Figure 11 - Human centred design for interactive systems (Adapted from ISO 9241:210) ... 43
Figure 12 - E-OCVM Operational Concepts life cycle ... 44
Figure 13 - Flow Chart of the SeparA Algorithm based on SGT ... 55
Figure 14 - SeparA interface developed by the project partners ... 58
Figure 15 - Number of manoeuvres suggested by the algorithm ... 60
Figure 16 - Illustration of the activities carried out in the ProGA case studies ... 64
Figure 17 - Emulation logic. The grey curve is the pre-recorded trajectory taken as input. ... 65
Figure 18 - Level-0 Prototype user-interface ... 67
Figure 19 - ProGA Prediction Concept ... 70
Figure 20 - ProGA. Overall Software Architecture ... 73
Figure 21 - ProGA Server (Central Unit) Software Architecture ... 75
Figure 22 - Traffic and Scenarios relationships ... 77
Figure 23 - Ownship information life-cycle ... 81
Figure 24 - Traffic Information Life-cycle ... 82
Figure 26 - Tablet Application Software Architecture ... 84
Figure 27 – Moving Map Component ... 87
Figure 28 - Compact Information Label ... 89
Figure 29 - Expanded Information Label ... 90
Figure 30 - Global Functions Menu ... 91
Figure 31 - Particles Visualization Mode ... 94
Figure 32 - Continuity property not respected with a low number of particles ... 95
Figure 33 – Heat map visualization mode ... 96
Figure 34 - Connected Particles Visualization Mode ... 97
Figure 35 - Altitude indication in the three visualization modes ... 98
Figure 36 - Overall HW Architecture of the simulation system ... 99
Figure 37 - Alternative HW architecture: decoupling central unit and flight simulator ... 100
Figure 38 - Picture of the actual prototype. Left: tablet with mobile app runnin. Right: flight controls. Top: 3D scene ... 100
Figure 39 - Closer image of the flight simulator communicating with the tablet application with the user interface for the usage of the traffic predictions. The position of the aircraft is decided by operating with the flight simulator and visualized on the tablet ... 101
Figure 40 - ProGA Case study evaluation approach ... 103
Figure 41 - Navigation Points used for the Real-Time simulation scenarios ... 106
Figure 42 - Discovered issues after each expert evaluation ... 116
Figure 43 - Distribution of the issues among the Nielsen's heuristics ... 117
Figure 44 - Overall Situation Awareness Results ... 124
Figure 45 - Standard Map Example ... 127
Figure 46 - Redesigned Map for Predy case study ... 129
Figure 47 - Time-Based clusterization. Result of the algorithm for a single time horizon set of particles ... 130
Figure 48 - Altitude representation for surrounding traffic ... 132
Figure 50 - Animation schema for time conveyance ... 134
Figure 51 - Predicted trajectory visualization redesigned ... 136
Figure 52 - Predicted trajectory visualization and sensing functionality ... 137
Figure 53 - Average scores for situation awareness without the usage of trajectory predictions (BASELINE) and with the usage trajectory prediction (SOLUTION) ... 140
Figure 54 - Situation Awareness average scores by level ... 141
Figure 55 - Projection level questions results ... 141
Figure 56 - Altitude representation related results ... 142
Figure 57 - Positional indications of the conflict in scenario 1 ... 143
Figure 58 - Positional indications of the conflict in scenario 2 ... 144
Figure 59 - Qualitative representation of accepted uncertainty in the different functions' class ... 146
INTRODUCTION
Motivations and Problem Statement
The aim of the present work is to study the presentation and hence the usage of uncertain data in a safety critical situation such as the one represented by a pilot operating an aircraft. In such circumstances, the pilot is required to interact with a set of avionic sub-systems that are part of the flight deck and, more in general, of a more complex aircraft system. Results in literature show that introducing automation in complex systems is far from being a deterministic process due to the subtle implications that are difficult to understand at design time (see LITERATURE REVIEW ON AUTOMATION AND UNCERTAINTY VISUALIZATION section for further details). Furthermore, the aircraft system is in fact part of an ATM system and relies on -for example- ground technological infrastructures to function accordingly to imposed rules and procedures.
On top of that, as the automation -even in its human centred approach- leads to a change in the interaction, tasks, and roles, it certainly modifies the kind of support the human operator can rely on. A typical support, in this perspective, is represented by the forecasting systems, namely systems aiming at providing a prediction of a set of elements in which the operator, or other systems are interested (e.g. future trajectories of surrounding traffic, weather situation etc.). To address this conventional kind of support, the main case study in this research is represented by the usage of predicted trajectories by general aviation pilots.
Adopting the approach in Parasuraman work [44] and his definition of Automation
“A device or system that accomplishes (partially or fully) a function that was previously, or conceivably could be, carried out (partially
or fully) by a human operator”
the system in the case study is accomplishing a cognitive function -the prediction of -the future trajectories of -the surrounding traffic- currently fulfilled by the pilot in order to "stay well clear".
In safety critical contexts, such as the aviation and ATM domains, in which the uncertainty is seen as a negative factor, the messages of this work are the followings:
- uncertainty in such complex and open systems can be reduced but not completely eliminated;
- automated system like forecasting system are common and by definition producing uncertain data;
- benefits can be derived from uncertain data but only through an accurate design of their usage and representation;
Therefore, the leading question moving this research can be summed up as following: can uncertain data be used effectively in safety critical systems and what are the most suitable ways to design the user interface to exploit this kind of data? This question, in turn, implies the understanding of what are the relations between automation, uncertainty and human system collaboration, the identification of the benefits that may arise from the usage of the data and the enablers such circumstances and design solutions for observing the benefits.
Motivations, however, are not only related to the automation and uncertainty implications. The present research is also embedded in (and in fact it is funded by) the SESAR program and its main case study is the concrete expression of the program objectives for the GA community.
SESAR is the technological pillar of the Single European Sky initiative aiming at restructure the architecture of the European ATM in order to meet future traffic capacities, augment safety and shift
from the local approach to an overall European management of the sky. The research and development activities in the program aim at studying and introducing a set of operational concepts that serve as cornerstones for reaching the above objectives. While the main technological and operational enablers of SESAR are most focused on the high end of the aviation domain (i.e. commercial aviation and business aviation) the efforts for the less pervasive communities such light GA are directed –especially in the long term research initiatives- at introducing concepts that can reduce the distances from the domains and make possible or smoother the coexistence of seemingly incompatible worlds. As it will be further explained, the concept behind the main case study can augment the predictability of the light GA community, the safety of the entire domain and be considered as a less stringent version of the 4d trajectory operational concept, therefore preserving the freedom requirements of the light GA users.
Thesis Overview
This thesis is presented in seven chapters. After the first introductory part- the present chapter- a literature review focused on the automation and uncertainty aspects is provided. The literature review touches several topics due to the multidisciplinary nature of the work. Its main goal was to represent a solid foundation about the implication of automation and uncertainty on the human operator and on the related user interfaces.
The review is followed by a description of the application field, namely the light general aviation domain.
The methodological approach is presented in the fourth chapter where, besides the overall approach, each activity is mapped with the thesis objectives.
The core of the work is described in the fifth chapter. As it will be noticed the research is shaped around three main case studies providing different insights about the usage, presentation and
possible benefits of uncertain data. In particular, the last two case studies, closely related to each other, investigate the usage and visualization of long term trajectory predictions.
The results are presented singularly for each case study and then jointly discussed in the discussion chapter that also presents a framework for the uncertainty visualization arising from the results and experiences gathered during the research.
LITERATURE
REVIEW
ON
AUTOMATION AND UNCERTAINTY
VISUALIZATION
Chapter overview
For the multidisciplinary nature of this work, there are more topics that need to be highlighted in the literature review. This chapter summarises the main theories regarding automation from the aviation and air traffic management points of view. The goal is to highlight the most important definitions, characterizations and impacts especially regarding the aspects related to the human operator and to the human machine interfaces that are used or are expected to be used to interact with the automated systems.
The second part of the chapter is focused on the uncertainty visualization methods and their application in several fields, included aviation related domains such as airt traffic management.
Automation and impacts of automation
on humans
The term “automation” is used in several scientific and industrial fields adopting different points of view and meaning nuances.
The Oxford English Dictionary (2016), for example, defines the automation as follows:
“The use or introduction of automatic equipment in a manufacturing or other process or facility”
As comparison, the Cambridge English Dictionary (2016) provides the following definition:
“The use of machines that operate automatically”
Both the definitions refer to the term “automatic” or “automatically” which is defined –in this case by the Oxford Dictionary- as
“(of a device or a process) working by itself with little or no direct human control”
When talking about machines, process etc. It is common to use term “automation” by including a component of independence from the human. For the purposes of this work, a suitable definition given, in scientific research, is the one provided by Parasuraman [44]
“A device or system that accomplishes (partially or fully) a function that was previously, or conceivably could be, carried out (partially
or fully) by a human operator”
The above definition is widely used in the aviation domain. It properly highlights the concepts of replacement of the human operator in the accomplishment of a function and, more importantly, the possibility of a partial replacement (“partially or fully”) in the function execution, therefore implying the existence of a so called human-automation collaboration. This view was first adopted by Sheridan in 1978 [54] by highlighting that automation is not ‘all or nothing’.
From this point on, the last mentioned concept of automation will be adopted.
The automation introduction in complex socio-technical systems followed, in its first years, a technology driven approach leading to initial benefits but also to subtle drawbacks and complications [52]. As a result, a substantial part of the research in automation focused on the following main interrelated flows:
• Improving the understanding of the existing socio-technical systems
• Assessing the impacts of the automation on the human operator (or on the factors that characterize the interaction between the operator and the automated system)
The first stream of research typically goes through the definition of theoretic automation models that can be used by researchers or
practitioners to adopt a structured view of the system and/or to redesign some of its parts.
The work of Parasuraman [44], already mentioned for the definition of automation, also provides a commonly used model for types and levels of automation focusing on the interaction with the human operator. Parasuraman identified four classes of function in which automation can be applied, he highlights how the automation is represented by a continuum of solution from manual control to full automated systems. Figure 1 shows a qualitative representation of two different automated systems (System A and System B) according to the Parasuraman model.
Figure 1 - Four classes of functions in Parasuraman work
Starting from a simplified model of the human information processing stages, Parasuraman proposed an analogy of system functions that can be automated, namely Information Acquisition, Information Analysis, Decision Selection and Action Implementation.
Similar functions were identified in the field of Nuclear Power Plants automation. O’Hara [42] for example refers to a set of five functions classified as follow:
• Monitoring and detection: represents the set of activities used for the information extraction and for establish the status of the plant
• Situation Assessment: refers to the activities involved in the evaluation of the current condition that is deciding if the status of the system is acceptable and if not, what are the reasons.
• Response Planning: represents the decisions of what are the actions that are considered suitable to be implemented in the current situation.
• Response Implementation: refers to the actual execution of the decided actions.
• Interface Management: refers to the actions required to configure the human machine interface, navigating, arranging information.
While O’Hara tried to characterize the automation on a broader framework (considering dimensions like levels, functions, processes, modes, flexibility and reliability), Parasuraman research focused on the identification of the functions and on their association with the automation levels. In their model, the authors proposed a ten levels scale of automation mainly for computer-based systems and for the Decision and Action selection stages. Similar classifications applied to teleoperated submerisble vehicles were firstly used by Sheridan in [54]. The identified automation levels are here reported from the highest to the lowest one.
10. The computer decides everything, acts, autonomously, ignoring the human
9. informs the human only if it, the computer, decides to 8. informs the human only if asked, or
6. allows the human a restricted time to veto before automatic execution, or
5. executes that suggestion if the human approves, or 4. suggests one alternative
3. narrows the selection down to a few, or
2. the computer offers a complete set of decision/action alternatives, or
1. the computer offers no assistance: human must take all decisions an actions
Two broad sets of criteria are then identified by Parasuraman [44] in order to help the designers in the selection of the most suitable levels of automation: human performance is the first criteria while automation reliability and cost of the decision and action consequences represent the second criteria.
As the authors state, their model does not claim to provide comprehensive design principles but it can be used in the early stages of the design to get a support about what types and levels of automation implement and what issues the designers are more likely to face as consequences of their choices. Endsley and Kaber in 1999 [20] proposed a very similar scale of automation levels associated with the roles played by the human operator and by the system in four different functions (monitoring, generating, selecting and implementing).
Limitations of these models, especially regarding its application in real cases, were also identified by Save, Feuerberg and Avia [53] who developed a new level of automation taxonomy after trying to apply the traditional automation frameworks to concrete automation examples. They noticed how the traditional theories are still useful to understand the variable nature of the automation support but sometimes not applicable to the concrete cases basically because specific levels of automation are not specified for each class of function. The authors argue that each class of function (Information Acquisition, Information Analysis, Decision and Selection and Action
Implementation) has peculiar levels of automation and they differ both in the number of levels and in the nature of support. Limitations of this approach can be found in the lost of comparison between the different functions: if each function has its own levels it’s not clear anymore how a level of one function is directly comparable with a level of a different function.
Many other studies have been carried on to characterize the automation and find suitable sets of dimensions to describe it comprehensively. Some works focused on the studies of a subset of these dimension. Automation modes, for examples are defined by O’Hara as follows
“modes involve performing the same functions in different ways. They provide capacity for a system to do different tasks or to accomplish the same task using different strategies under changing
conditions”
The work of Jamieson and Vicente provides an overview of the challenges related to the presence of modes in a system (mode transition design and mode awareness) and offers a set of principles for the automation design facing those issues. Degani [14] defines a mode as “the manner of behaviour of a given system” in which a behaviour is defined by the machine’s input, output, and state as a function of time. In his definition, Degani points out how a mode/behaviour can be imposed either by the machine or by the operator. He classified the modes according to two attributes: in terms of functions (for presenting different interface formats and for allowing different control behaviour) and in terms of transitions (those engaged by the operator, the automatic mode transitions, and both manual/automatic transition).
The adaptivity component of automation, instead, concerns the capacity of automation to change the responsibility and the allocation of a certain task or activity. The flexibility can be characterized in - The change of the levels of automation for a given task depending on some context parameters or some operator selections
- Delegation: the change of the task allocation of a subset of tasks: for example, a task belonging to the action implementation function can be dynamically assigned to the operator or to the system on the basis of the context information or, again, some operator selections.
Lastly, the reliability dimension refers to the degree of correctness in the results or behaviour of the automated system.
The following part of the chapter will review the main works regarding the impacts of automation on the operator and will explain how the present work fits in this field.
Interacting with automation
It is by now commonly accepted that the introduction of automation doesn’t imply that the human is not needed anymore. To characterize the automation through –among the other things- a set levels inside a continuum of different solutions, also means that a certain interaction between a human operator and the automated system is needed. The impact of the introduction of the automation on the human operators is therefore a subject studied in many works. Bainbridge in [2] argues that automation may expand some problems for the human operator rather than solve them. Although Bainbridge could not refer to the current automated systems –obviously more guided by a human centred approach than the ones in the Eighties- many highlighted “ironies” are still currently debated, and in some cases expanded [3]. In the same way, deciding which roles are more suitable for the human and which ones for the machines, represents a research topic initially influenced by the MABA-MABA list of Fitts [24]. However, with the growing complexity of the automated system and with the technology advancements, the approach of simply assigning a pre-existing task to the machine or to the human is now considered obsolete: in 2002 Dekker and Woods [15] argued that the implications of the automation introduction are not quantitative (“who does what”) but rather qualitative, leading the system to generate new kind of tasks and humans to change skills, routines in
different ways each time, therefore a design based only on such pre-defined tasks could not be suitable anymore.
In order to assess the effects of the automation on the human operator, many research efforts focused on the evaluation of the human performance and of the related human parameters (e.g. situation awareness, workload, fatigue, trust, vigilance and attention etc.) in presence of different automation solutions. For the purposes of this work, it is interesting to highlight the studies related to the effects on a subset of these parameters, namely on the situation awareness and on the workload.
Situation Awareness
The term “Situation Awareness” (SA) was born in the military environments [10] but its importance grown during the years in the aviation field. Pilots may informally or implicitly refer to the situational awareness in different ways. Probably, one of the most fitting ones is reported in [27]
“You should never take your aeroplane somewhere where your head hasn’t already been”
In the scientific literature several attempts to define and model SA can be found. Despite the vast debate, however, there is no universally accepted definition.
Smith and Hancock [56] defined it as the “up-to-the minute comprehension of the task relevant information that enables appropriate decision making under stress”, bounding the concept to a stress situation. Boy and Ferro [7] modelled SA as “a function of several quasi independent situation types: 1) the available situation, 2) the perceived situation, 3) the expected situation and 4) the inferred situation”.
Despite the lack of a universally accepted definition, there are some elements of SA that are commonly recognised, namely its placing in the working memory, the fact that SA is both a process and the
product of that process [16] and its influence in the decision making process, human error and human performance.
Perhaps, the most influencing characterization of SA –that includes all the elements above- was given by Endsley in [21] who elaborated her previous definition:
“SA is the perception of the elements in the environment within a volume of time and space, the comprehension of their meaning, and
the projection of their status in the near future” [22]
According to Endsley’s model, SA comprehends three distinct levels: L1 refers to the perception of the surrounding environment and of the relevant elements related to the goal. The second level, L2 concerns the comprehension of the meaning of these elements in order to acquire a sufficient understanding of the overall current situation. In the case of the flight deck, for example, a pilot would visually acquire an alarm signal, and then understand what is the alarm about and what are the causes. At this stage data start to become information. At level three L3, the current situation is projected in the near future in order to predict what is likely to happen and finally take a decision. Figure 2 shows a graphical representation of the Endsley’s model. It describes how SA can be influenced by external factors such as system design (typically user interface and system capabilities), workload, user-goals and user’s training and experience. It also shows the influence on the decision making process and the double nature of process and result the same process.
Figure 2 - Endsley Model of Situation Awareness
Endsley’s contribution was not only towards the characterization of the SA, but also over the methods and techniques for measuring it. Her technique, called SAGAT (Situation Awareness Global Assessment Technique) [22] uses a behavioural approach and employs a set of memory probes -defined by domain experts- that, during a simulation scenario, are randomly investigated by mean of questions asked to the participant. The questions are mapped on the different SA levels (L1, L2 and L3) and the answers are then compared with the real situation. The resulting SA is elaborated considering the degree of correctness of the answers to the different probes. Other behavioural techniques like the one presented by Durso [18] aim at eliminating the simulation interruptions by asking real-time probes about relevant information for the goal of the participant and by measuring both the accuracy and the time needed to answer, therefore following the assumption that less SA would require longer times to access relevant information.
In contrast to the behavioural approaches, rating scale based approaches use a self-rating questionnaire which is answered by the participant right after the execution of the task. Usually, multi-dimensional scale are employed: the SART technique [58] for example, one of the most used ones, comprises three different
dimensions (Attentional Demand, Attentional Supply and Understanding) each of which with different sub-scales. In Air Traffic Control tasks, the SASHA questionnaire [17] developed by Eurocontrol is commonly used and, with minor modifications, can also be applied to pilot’s tasks. It addresses three main aspects of S.A. namely, information extraction, integration and anticipation. It is composed of six items on a seven points liker scale and a scoring key is applied to calculate the overall SA score ranging from zero to six. If on the one hand, these kind of techniques have the advantages of being easier to implement as they do not require specialized software, they do not interrupt the tasks to investigate the probes but, on the other hand, they may suffer biases from a subjective interpretation of the questions and they are not suitable to express the continuous nature of the SA. Moreover, as Harris points out [27], the most serious drawback can be summarized by the following observation of a pilot:
“The problem is this: you only realise that you don’t have Situation Awareness shortly after you have lost it”
To mitigate the possible subjective biases of the participant, alternatives like the SARS technique [4] can be employed: the main difference in the application is that the rating is expressed by a subject matter expert who through the observation of the participant during the simulation scenario.
In general, SA seems to be affected by the other human factors in a uni-directional way [19]. The negative influence of high mental workload and stress is suggested by several works in different domains (e.g. ATM, Aviation, Automotive).
Several studies show evidences of automation affecting SA. This impact seems to be sensitive to the several factors of the automation above described. In particular, task allocation and level of automation appear to be the most contributing factors [35].
Parasuraman [44] points out that automating the decision-making functions may reduce the operator awareness due to the fact that humans are incline to pay less attention to changes made by other agents.
Dao et al [12] compared pilots SA across three automation concepts that varied in the responsibility of the traffic separation. In the first concept, pilots could use a conflict resolution tool that enabled self-separation and bad weather avoidance. The concept 2 consisted in the air traffic controller taking care of the traffic separation task but pilots still had the same tools on the flight deck. In the last concept a ground based automation was introduced and used for conflict detection and resolution; flight deck was equipped with a tool that allowed pilots to deviate in case of bad weather. The results showed pilots had higher SA in the first concept. This is an acknowledgement of both Parasuraman study and Dao [12] who performed a similar experiment on pilots and obtained a higher SA in manual and interactive concepts of automation.
Workload
As for many other cognitive constructs, there is no commonly accepted definition of mental workload. Being deeply related to the human information processing theory, in particular to the finite capacity of cognitive resources, cognitive workload can be expressed as the product of competition for limited information processing resources [27].
In generic terms, it can be defined as the cost to pay for accomplishing a task; as such, it is affected by individual differences as this cost is likely to be different in different persons. Glaser [25] highlights two components of workload: task load, associated to the actual demand required to accomplish the task, and experienced load referred to the subjective feeling of the participant. Jahns adopted a similar view [32] but identified three features, namely input load (essentially the task load), operator effort, referred to the effort used
by the operator to accomplish the task, and the task performance representing the results obtained in the task.
Results in literature about the impact of automation on mental workload are numerous and mixed. Endsley analysed the level of automation effects on performance, situation awareness and workload [20]. Results showed operator workload reduced when the decision making portion of the system was automated. This reduction however did not lead to significant performance improvements. Unfortunately, automation doesn’t always reach the goal of supporting the human operator and reducing his/her workload. Most of the times it only reduces physical workload, but in cognitive terms it may just change the human role to a more management based role, therefore incrementing the mental workload. For this reason, and because high levels of workload may negatively affect situation awareness, produce human errors and poor performance [19] it is important to monitor this construct whenever a new support is introduced in a complex system such a flight deck, or a controller working position.
As Sarter and Woods observed [52], in presence of automation, workload (and errors) was not reduced but only unevenly distributed over time –generating the so called clumsy automation- and sometimes also between the operators working as a team. The authors also point out how the workload changed in its quality dimension due to the fact that the typical tasks are no longer of active control type but they shift to supervisory control, generating attentional needs.
Regarding the estimation of mental workload, mainly four approaches can be identified [27]: analytical approaches are based on a decomposition of the tasks involved, in the identification of the concrete actions needed to accomplish the goal and the association with the cognitive processes behind each subtask. The analysis aims at identifying a weight for each component and finally assess the overall score for the task. These kind of techniques are useful in the early stages of the design of new systems in order to identify
potentially unbalanced tasks. However, the analysis may require a great effort if the tasks are complex or poorly defined. Behavioural approaches, instead, are based on the measurement of the human performance on one or two distinct tasks. In the first case, these techniques are based on the assumption that performance will decrease in presence of high workload induced by increasing the things to do in the unit of time. The validity of the single task based techniques has been questioned by several works as the observed workload is a direct response of the requirements of the task. The second category of behavioural techniques is represented by the secondary task based techniques where the underlying theory is that two compatible tasks (not requiring the same kind of resources, see [62] for further details) can be performed at the same time with no negative impact on the performances, until the working memory of the performer has sufficient capacity. The first task is the one requiring a workload assessment and the secondary task is usually a very simple unrelated task of which the performance is measured. Ideally, when the primary task is requiring a high workload, the performance of the secondary task will decrease. Sensitivity and diagnosticity of these techniques can be quite high but thy usually require complex setups and great efforts in the analysis of the results. Physiological approaches for the workload estimation are based on the measurement of certain human physiological parameters and their correlation with high workload situations. Typically, these measures are derived from electrocardiograms, electroencephalogram and electro-oculogram. For example, high workload is usually associated with an increase of the heart rate. Regarding neurophysiological measure, instead, the theta (over the frontal and occipital sites) and alpha (over the parietal sites) rhythms of EEG signals have been considered in many studies for their strong correlation with mental workload variation [1]. The main drawbacks of physiological measures are represented by the poor acceptance of the participants and by the efforts in the experimental setup. The poor reliability requires to carefully measure the baselines of each
participant. These measures are rarely used alone and they need to be integrated with other approaches to provide useful results [27]. Subjective approaches, finally, rely on directly asking the participant to assess his/her current workload. This can be done with several strategies: for example, in the ISA (Instantaneous Self Assessment) technique, the participant is periodically asked to indicate his/her level of workload in a scale of 5 points. This technique has the advantage to collect a workload profile along the whole task execution. It is a uni-dimensional workload scale, category that is shared with the Cooper Harper rating scale. In general, uni-dimensional rating scales are very easy to use as they guarantee a quick response and they do not need a specific training. In contrary, multi-dimensional techniques, allow to characterize the workload in its several dimension and to weight them according to the participant attitude. This is the approach used by the famous NASA-TLX [28]. This technique defines three dimension for the workload, namely mental demand, physical demand, temporal demand and three sources or reasons for it, namely performance, frustration and effort. These factors are first weighted and then rated by the participant right after completing the given task. An alternative to the NASA TLX is the SWAT methodology [46] that employs only three dimensions. Both the techniques are widely used in literature.
Feedbacks and attention
Related to the challenges in the task allocation and situation awareness introduced, the challenge of the feedbacks to the human operators was initially considered to be one of the main problems with automation [41]. Back in 1990, Norman claimed that the problem about automation is not the automation itself but rather the way it is designed, the poor and inadequate usage of feedbacks, which is connected to the insufficient level of intelligence of the automation: Norman stated that automation should be made either less intelligent or sensibly more intelligent in order to correctly support the operator in complex domains. Despite the growing intelligence of the current
automated systems, also the complexity of the tasks to be supported is became more complicated.
Norman also highlighted that the reason why automated systems provided poor feedback was because feedback was under considered by designers. Under-consideration, in turn, was due to the fact that automation doesn’t really need feedbacks or dialogues to work unless something goes wrong.
Due to the fact the the operator can be easily relegated to supervision roles, attention and boredom have been studied by several researchers facing automation challenges: Cummings in [11] set up a low task load experiment organized in three different levels that required operator input every 10, 20 and 30 minutes. The operators had to control unmanned aerial vehicles in a simulation environment. As expected, the top performer was the one who spent most of the time in an attention or divided attention state1.
Figure 3 - Attention Management as a function of time (M. Cummings)
1 Attention states were defined as following: directed, when participants were directing their gaze or
interacting with the interface, divided when participants were looking or glancing at the interface but also engaged with other tasks, and distracted when participants were not in a physical position to see the interface
Surprisingly, the other top 4 performers spent at least on third of their time in a distraction state suggesting that low task load environments that induce boring can be effectively managed with attention switching and supporting this practice can be a promising design strategy. Authors also highlighted how there was no observable relationship between amount of distraction and performances.
Uncertainty Visualization
The aim of the present work is to study a method to use and present uncertain data in a safety critical situation such as the one represented by a pilot operating an aircraft. The specific and main case of study is represented by the usage of predicted trajectories to augment the situation awareness of light GA pilots and therefore the safety of the overall operations. As the intrinsic difficulties to predict general aviation flight trajectories (see LIGHT GENERAL AVIATION DOMAIN section) and the challenges provided by the introduction of automation (see Automation and impacts of automation on humans section), the resulting data comes with a great amount of uncertainty. This section reviews the main concepts about uncertainty visualization, it summarizes the challenges characterizing this topic; theoretical perspectives and the techniques are then reported together with the considerations about research gaps.
Uncertainty visualization is by now a topic of importance in many scientific fields and it is considered one of the top scientific visualization research problems [34]. The growing of the computational capacity, of the data acquisition capabilities (e.g. cheap sensors, wearable devices etc.) and consequently of the available datasets have shift the attention to the need of more faithful ways to depict the available data.
This is one of the main goals of the uncertainty visualization. Raising awareness about the uncertainties in order to ultimately improve the decision making.
However, the challenges to face when representing uncertainty are diverse:
• No common definition. The absence of a commonly accepted definition and characterization of uncertainty makes difficult to define a set of common visualization solutions.
• Visual cluttering and complexity. The fields of application are such that the data involved are already complex (e.g. medical data, weather forecasts, scientific data) and adding the uncertainty information may easily increase visual cluttering and complexity.
• Data Concealment. As a consequence of the previous point, the main data attributes may result concealed by the new uncertainty layer.
• Conveyance. Finding good visualization metaphors that naturally guide the user to the meaning of uncertainty is hard and may vary with the context of use.
• Requirement diversity. Finally, the ubiquity of uncertainty makes its visualization applicable in different domains with diverse requirements.
On top of these challenges, it may become difficult in some cases to define whether the uncertainty is a secondary or primary attribute of the data; crossing the line between the visualization of uncertain data and the uncertainty visualization in many cases defines a good or a bad design.
Related to the first challenge, many researchers tried to describe the nature of uncertainty from the visualization point of view. Potter, for example, identified the types of uncertainty by the nature of its origins [47]. She claims that being aware of the origins of uncertainty may help in determining suitable visualization paradigms: Potter describes 4 types of uncertainties, namely experimental uncertainty, obtained by repeating an experiment multiple times; geometric uncertainty, related to the spatial position of a set of elements of interest (e.g. molecule position, trajectory predictions etc.); simulation uncertainty, arising from the usage of multiple models in
a simulation (e.g. weather forecast results); visualization uncertainty, arising from the visualization process itself (e.g. calculation of isosurfaces or colormap transfer functions).
Pang et Al [43] defined the types of uncertainty relating them to the visualization pipeline stages, thus identifying uncertainty in the acquisition stage, uncertainty in transformation and uncertainty in visualization. Plewe [49] identified uncertainties deriving from the conceptualization processes of a phenomenon and the ones deriving from the measurements. Typology of uncertainties can also be determined by the error components such as space, time, value, completeness and consistency [55].
It’s worth to underline that these categories may overlap when considering practical cases. For example, in the present work, the ProGA and Predy case studies (see sections Usage of uncertain data to support safety critical decisions – ProGA Case Study and Concept Refinement – Predy Case Study) make use of trajectory prediction data where the geometry uncertainty is probably prominent; however, the data come from a set of repeated simulation of particle dynamics, which can be considered a simulation uncertainty.
Such categorizations are therefore useful to have a better understanding of the data the designer is dealing with, helping in the selection of the most prominent nature and, eventually, the most suitable visualization approach.
In the previously mentioned work of Pang [43] a comprehensive classification of the approaches to uncertainty visualization is provided. Pang starts from general visualization classifications and combines some of them - [8] and [30]- in order to incorporate uncertainty information. Five characteristics are identified i.e. value, location, visualization extent and axes mapping. Value and visualization extent are then used as main characteristics to classify existing uncertainty visualization techniques.
Figure 4 - Table from Pang et Al (1996) for classifying main uncertainty visualization methods
Figure 4 shows the just mentioned classification and illustrates the scalar, multivariate, vector and tensor options for the “value” dimension. However, as discussed in [26] by Griethe, the available techniques are not balanced across these options and mostly concentrate on scalar values. For this reason, Griethe et al proposed a different and more intuitive classification based on the way uncertainty can be displayed: indirectly, by parameterization –for example by filtering elements of with low accuracy influencing the stages of the visualization pipeline- or directly by mean of new elements in the visualization. The direct methods can be further classified in those using free graphical variables, those adding new objects, using animation, interactive representations and finally the ones targeting other human senses. In most cases the techniques belong to this second category.
Among the specific methods, traditional ones include error bars added on histograms (showing for example standard deviation) and boxplots. These methods, specially the boxplots, have been then expanded to better integrate uncertainty. For example, Potter et al [48] proposed a redesigned version of the box plot called summary plot and, in the same work a further extension for two dimensional distributions aiming at integrating a better representing uncertainty.
Figure 5 - Potter et Al. Anatomy of a Summary Plot
Other extensions of boxplots for uncertain data can be found in [9] and [31].
This kind of approach, however, is not suitable for more complex data, for example dynamic data or elements with spatial components. Complex visualization cases are heavily dependent on the context of use and many efforts have been directed in finding the metaphors that best convey the uncertainty to the user. In this direction, probably, the study that acts as bridge between theoretical frameworks and practice, is the seminal work of Bertin about the semiology of graphics [5]. Bertin’s approach, has been revisited several times during the years adding new variables or suppressing the ones not applicable for the specific cases [38] [29] [6].
Techniques exploiting the visual variable principles, aim at mapping the uncertainty information on the attributes of the graphic elements like location, size, shape, orientation, colour value, colour hue and saturation, transparency, but also crispness and textures or combination of these elements. For example, the transparency visual
uncertainty and it does not require great technical effort to be implemented.
Boukhelifa et al in [6] for example, the sketchiness is used as visual variable to convey uncertainty.
Figure 6 - Using sketchiness as visual variable to convey uncertainty
Visual variables can be applied to already existing elements or to new elements like glyphs. The usage of glyphs is quite common in the uncertainty visualization techniques as they allow the designer to easily map many visual variables in one location.
Figure 7 - Usage of glyphs from Pang 1996. Spherical glyphs scaled to radiosity differences (left). Uncertainty vectors glyphs (right)
Other visualization techniques exploit the usage of animation of the elements. In this setup, the uncertainty is mapped to the animation parameters like speed, duration, type of motion. Finally, it is worth
highlighting the usage of the multiple window technique, where uncertainty information is visualized separately from the data.
In Air Traffic Management and aviation research uncertainty is usually considered a factor to reduce/remove from the system and most of the efforts focused on this direction. Works on uncertainty representation have nevertheless been developed: Van Doorn et al. presented in [60] a probabilistic conflict detection tool was evaluated with planning controllers providing promising results against the geometric approaches. Tielroojij et al. [59] describe a system for supporting air traffic controllers in the arrival management decisions taking into account arrival time uncertainty.
It appears there is still not a comprehensive knowledge about the factors that determine a good uncertain visualization. This is due to the fact that uncertainty visualization can be applied in several application fields in different and complicated situations. Therefore, results on most studies are difficult to generalize. A visual variable that naturally conveys uncertainty in one domain can be misleading in another domain. Moreover, there is an enormous number of possible combinations for mapping uncertainty to the visual attributes.
One of the main gap in the field is the almost complete absence of solutions for real-time contexts in which the user has short time to interact with the system and explore the presented information. In more dynamic and time pressure contexts (for example a pilot in the flight deck) most of the techniques found in literature are not suitable as they require a combination of time and attention not affordable for the user.
Regarding the future steps in the field, MacEachren [37] identifies a need to create methods that do not only address the depiction of uncertainty but also support the interaction with it. He identifies a total of 7 challenges: understanding the components of uncertainty and their relationships to domains, users, and information needs; understanding how knowledge of information uncertainty influences information analysis, decision making and decision outcomes;
understanding how (or whether) uncertainty visualization aids exploratory analysis, developing methods for capturing and encoding analysts or decision makers uncertainty; developing representation methods for depicting multiple kind of uncertainty; developing methods and tools for interacting with uncertainty depictions; and assessing the usability, utility of uncertainty capture, representation and interaction methods and tools.
LIGHT GENERAL AVIATION DOMAIN
Chapter overview
The present chapter describes the Light General Aviation Domain (Light GA) and aggregates the domain knowledge collected mainly during the first stages of my study and needed during the subsequent stages of applied research (see results and contribution section). The domain study has been conducted by means of Light GA pilots interviews, focus groups, Air Traffic Controllers interviews, and documental analysis.
The first part of the chapter is dedicated to the definition of the Light GA domain and its positioning inside the overall aviation context. Light GA operations are then analysed in order to provide a concrete overview of the typical flights operated in these conditions.
Finally, a discussion about the safety issues and the relevance for the SESAR Program are discussed.
Light General Aviation Definition
As a starting point it is important to set a precise definition of what it is meant by “Light General Aviation”. EASA proposes a description of light GA operations stating that “concern non-commercial operations of other-than-complex motor powered aeroplanes”. Therefore, a “definition by subtraction” is provided. The important terms of this description are the expressions “commercial” and “complex motor-powered aeroplane”. The term “commercial operations” refers to any operations conducted for remuneration focused on transportation of people and things. The complex moto-powered aircraft, instead, refers to the following categories
• Aeroplanes
o with a maximum certificated take-off mass exceeding 5700 Kg, or
o certificated for a maximum passenger seating configuration of more than 19
o certificated for operation with a minimum crew of at least two pilots, or
o equipped with turbojet engine or more than one turboprop engine
• Helicopters
o For a maximum take-off mass exceeding 3175 Kg • Tilt rotor aircraft
Ergo, the definition of light General Aviation excludes the just described categories. Figure 8 shows a photo of a common aircraft model in the light GA class. Typically, the flights embraced by this category are conducted for leisure or training purposes and the aircraft are navigated under Visual Flight Rules.
Figure 8 - CESSNA 172 model. Typically used for training purposes
In contrast with Instrumental Flight Rules, which are typical of the commercial aviation, VFR operations are permitted under more stringent circumstances related to the visibility and to the weather of the zone in which the pilot is going to fly. While when flying IFR, in fact, the navigation is based on a set of procedures and instruments that can overcome the visibility limits, the approach of the VFR operations is to navigate an aeroplane based only on the actual visual acquisition out of the window. For example, VHF Omni Directional
Radio Range (VOR) which are a radio navigation system, are not used by VFR flight.
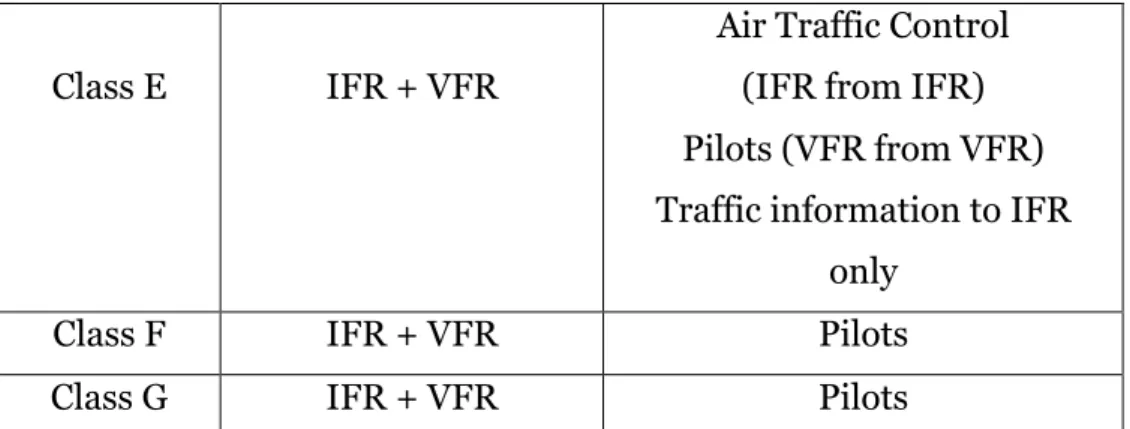
The other main difference compared with the commercial aviation is represented by the airspace classes of reference, and, as a consequence, by the services that are available to this class of airspace users. The overall European airspace, in fact, can be divided considering the the kind of operations and the related service provided by the Air Traffic Control. A total of 7 segments are currently defined (although one of the objectives in the next future is to simplify the categorization in only 2 main classes) with the names from Class A to Class G. To simplify, VFR flights are admitted from Class B to Class G, and the main distinction can be made by looking at who is responsible of the separation assurance. While Air Traffic Control provides the separation service in classes A to E, when flying in airspaces of class F and G, the single pilot is required to “stay well clear” from the surrounding traffic. This is synthesized in the following table Airspace Class Type of flight admitted Separation Responsibility
Class A IFR + SVFR2 Air Traffic Control
Class B IFR + SVFR + VFR Air Traffic Control Class C IFR + SVFR + VFR Air Traffic Control
(IFR from IFR from VFR). Pilots (VFR from VFR) Class D IFR + SVFR + VFR Air Traffic Control
(IFR from IFR) Pilots (VFR from VFR)
Traffic information is provided to both categories
Class E IFR + VFR
Air Traffic Control (IFR from IFR) Pilots (VFR from VFR) Traffic information to IFR
only
Class F IFR + VFR Pilots
Class G IFR + VFR Pilots
Table 1 - Airspace Classes and Separation Responsibility
Classes E, F and G are therefore the airspaces in which pilots can fly without the requirement of being in contact with ATC. This kind of classification is common in the whole European Sky. However, due to the peculiarities of each nation, the physical structures and rules that regulate the usage of the airspace can be different from place to place. The last two classes, in particular, are usually referred as “uncontrolled airspaces” and represent the main target of this study.
Flight Freedom
Flights operating in these airspaces, as already mentioned, do not need to contact ATC services to perform the flight. In fact, pilots are not even required to submit a flight plan and they can decide to take-off from a certain airfield at any moment if the conditions are suitable (compliant with the VFR standards). Having the highest degree of freedom is an essential requirement for the Light GA community and this is highlighted both in the absence of flight plans and in the freedom of action (within their airspaces of reference) during the navigation. The reasons at the base of this requirement are to be found in the overall goals of this kind of flights. As previously mentioned, the typical operations are related to leisure and training purposes. In the first case, the extemporary essence of the need hardly conciliates with the procedures and requirements for filing a flight plan and sticking to predefined routes. In the second case, instead, the dynamicity of the training exercises is the most
diverging factor from the predictability required by the regulations: depending on the current situations, in fact, flight instructor may decide for different kind of lessons; moreover, the poor experience of the students may easily lead to potentially unpredictable behaviours. Freedom, however, does not mean absence of rules: in order to guarantee an adequate level of safety, the flight operations –for example- have requirements regarding overflying populated areas: flights are only permitted above minimal altitudes in order to facilitate emergency landings, avoid crashes with buildings and reduce environmental impacts). Additionally, despite the absence of requirements regarding the submission of a flight plan to authorities or air traffic services, pilots do plan their flights in order to identify potentially critical situations, to have an anticipated geographic awareness. This is obviously done in less stringent ways than the commercial flight plans: for example, time estimations can be totally absent, and the points to flight over may be rather become areas. The resulting information can be rather call “intent” information of the pilot. This information is not operatively shared with other entities but more informally –through the usage of websites, forums, mobile apps- can be shared with other pilots of the community interested in the same area.
Predictability of the flights
Due to the reasons described in the previous sections, the predictability of the light GA operations is sensibly lower than the one characterizing the commercial flights. As a result, the task of predicting the trajectories of these aircraft is a challenging one and the algorithms for tackling it are likely to produce results loaded with uncertainty.
Among the typical factors affecting the predictability of a light GA, the extent of the flight and its purposes are probably the first that need to be considered. Local flights, for example, are characterized by
the fact that the departure and destination airfields are the same. Therefore, the flight travels to a series of remote locations of interest and then comes back to land at the original location. This is a typical behaviour of leisure and basic training flights. An example of this kind of path is given in the following picture.
Figure 9 - Local flight. Basic training
In Figure 9 the flight takes off and lands at the airfield situated on the bottom right of the image (LFPZ). It flies until it reaches an area where several exercises are performed and eventually heads back to the original airfield. It is important highlighting that considering a specific airspace, the segments of sky where exercises are performed are usually common to many flights, and so are places of interest that are visited for leisure reasons. This factors can be considered to form emerging patterns in the trajectories and therefore enhancing the predictability and the prediction of such flights.
In contrast with local flights, cross country flights, present a one way trip from one airfield to another. An example is given in Figure 10. The behaviour of this kind of flight is mainly affected by the pilot skills, by the technique used to flight and by external conditions such as weather conditions.
Figure 10 - Cross country flight
A prominent aspect of this kind of flights is the correlation with the specific geographic connotations or with the geographic position of navigation supports depending on the navigation technique used by the pilot. The presence of a river, or a road, for example, have a strong impact on the followed trajectory as these elements are typically used as visual reference in VFR flights. Populated areas are also an important factor as specific rules must be applied those are encountered. The just described rationales can be applied also in the local flights in the sub-parts of the trajectory to and from each remote location.
Relations with SESAR Program and
Safety considerations
The complexity and diversity of the actors involved in the light GA community makes difficult to trace precise and unique safety requirements. This aspect is made worse by the fact that data collection regarding GA flights is not a common practice, at least in a standardized and diffused way. Operational data is collected at individual or community level but rarely shared. Flying in uncontrolled airspaces, therefore, most of the times outside the coverage of the surveillance systems, is an additional negative factor for the safety related aspects.
Despite the lack of a centralized data collection, major safety relevant events are collected and analysed: the analysis reported in the Annual
collision of commercial aircraft, there are about 30 mid-air collisions involving General Aviation aircraft.
From the holistic perspective of the Air Traffic Management system, an additional safety need regarding the GA community is related to the airspace infringements risks: the differences in the pilot’s experiences and in the equipment of their aircraft are often a contributing factor when analysing controlled airspace violations. The proximity of this community with the new category of operations represented by the RPAS flights, and the further fragmentation (type of vehicles, performances, pilot’s experiences) of the latter, poses supplementary challenges of integration and consequently safety related aspects.
The top-layer of the GA –business and military aviation- navigating highly equipped aircraft have been fully addressed by the SESAR Program for their technological compliance with the introduced concepts. Projects like ProGA, the main case study presented in work, aim at fill up both the technological and operational concepts distances. In the specific case, a long-term prediction concept may represent the light GA instance of the 4D trajectory introduced by SESAR. This instance aims at making achievable the integration of this community in a smoother way: by addressing the requirements of freedom, and by exploiting informal and already existing behaviours (community sharing, flight patterns), it may represent a satisfying and promising trade-off with the more stringent constraints applied in the original concept.