45
Human capital, technology intensity, and growth
in a regional context
di Donata Favaro
*, Eniel Ninka
°, Margherita Turvani
àAbstract
In this article, we study the pattern of growth in one of the Italian best performing regions – the Veneto region – focusing on the role played by human capital and technology. Our aim is to verify the growth effect of human capital and technological intensity. The period considered is the pre-crisis period between 2001 and 2005. The results of the regressions clearly show how in the Veneto region the productive “specialization”, which has the greatest impact on growth, is the one in high-technology. However, human capital employed in high-technology intensive sectors does not explain growth significantly. This suggests an under-employment of human capital in the sectors at the frontier and the need to intervene with policies that develop high-technology industries.
Keywords: regional growth, human capital, technology intensity, spatial analysis. JEL Classification: O1, O3, C21.
Capitale umano, intensità di tecnologia e crescita in un contesto
regionale
Sommario
Questo articolo studia il modello di crescita della regione Veneto, approfondendo il ruolo giocato dal capitale umano e dalla tecnologia. Il periodo di analisi è quello degli anni precedenti la recente crisi economica e compresi tra il 2001 e il 2005. I risultati delle stime di crescita mostrano chiaramente come i settori ad alta tecnologia siano quelli che determinano una maggiore crescita economica nella regione. D’altra parte, il capitale umano impiegato in tali settori non è correlato significativamente con la crescita. Ciò suggerisce un utilizzo insoddisfacente del capitale umano nei settori di frontiera tecnologica e la necessità di intervenire con politiche che favoriscano lo sviluppo di imprese ad alta intensità tecnologica.
Parole chiave: crescita regionale, capitale umano, intensità di tecnologia, analisi spaziale Classificazione JEL: O1, O3, C21.
* Associate Professor, Department of Economics and Management “Marco Fanno”,
University of Padova, [email protected]
° Senior statistician, SOGETI Luxembourg and University IUAV of Venice,
à Associate Professor, Department of Planning, University IUAV of Venice,
Introduction
It is well known that Europe's average growth rate has been structurally lower than that of our competitors (OECD, 2003). In Europe, even the fastest growing regions before the crisis were experiencing difficulties in maintaining the targets imposed by the Lisbon strategy in terms of development of a knowledge-based economy (European Commission, 2010) and EU regions show persistent economic gaps (Cappelen et al., 1999, Cappelen, et al., 2003; Dunford and Smith, 2002).
Economic theory maintains that a major cause of differences in economic growth is the difference in the levels of investment in R&D and innovation and the gap in the availability of human capital. Human capital is important for economic sustained growth if it is applied where ideas are produced and where innovation eventually takes place; human capital endowment, as such, is the trigger for growth that is achieved through the creation of new products (Romer, 1990) or the improvement of the quality of existing products (Aghion and Howitt, 1992). Recent contributions highlight how human capital has a higher growth-enhancing effect closer to the technological frontier, and show the complementarity between skilled labour and proximity to the frontier (Acemoglu et al., 2006; Vandenbussche et al., 2006).
The aim of this article is to empirically verify the role played by human capital and technology in the process of growth. The analysis is carried out for one of the richest regions in Europe—the Veneto region—in the pre-crisis period (between 2001 and 2005). Among the European Union regions, the Veneto Region is characterized by relatively high levels of revenues per capita. However, a closer look shows a fragile economic structure, in which traditional sectors have experienced continuous economic decline and knowledge-based sectors have failed to become new drivers for growth (Regione Veneto, 2010). The resulting picture is that of a region exhibiting disparate patterns of growth in different subareas and districts and among different economic sectors. The analysis of growth and its relationship to human capital and technology intensity appear particularly interesting, especially in the Veneto region. The “core” of the Veneto Economy has been historically concentrated in sectors characterized by medium to medium-low levels of technological intensity. As a matter of fact, these sectors, although investing less as a percentage of revenues than high-technology firms, do nevertheless generate new products, particularly, production processes that have considerable aggregate impact (Robertson et al., 2009).
The analysis was carried out at the level of Local Labour Systems (LLSs). Growth equations were run taking account of spatial interactions among LLSs by means of different spatial models. Different specifications were considered. First, we studied the effect on growth of human capital and technological intensity separately considered. Then, we evaluated the growth effect of human capital employed in sectors characterised by different technological intensities.
The article is structured as follows: in Section 2, we briefly summarize some economic aspects of the territory of study; in Section 3 we define our empirical strategy, while in Section 4 we describe the dataset used for the empirical analysis; in Section 5 we discuss the results of the empirical analysis (OLS regressions and spatial estimations). Finally, we make some conclusive remarks in Section 6.
1. The Veneto Region in the European and Italian Context:
Human Capital Endowment and Technology Intensity
Veneto is one of the richest areas in Europe. In 2007, its GDP exceeded
147 billion Euros, making a contribution of 1.2% to the EU-27 GDP1.In
terms of GDP per capita, Veneto ranks in the top quartile of the richest
regions in Europe. It ranks sixth among the Italian regions2, and with a
GDP per capita equal to 123% of average EU-27, it holds the sixty-third
position in the ranking of European regions.3
In Veneto, as in the most advanced economies, the share of value-added produced by the industrial sector (35% in 2007) is declining (Regione Veneto, 2010); the region is, in fact, relocating part of the activities to the service sector. Between 2000 and 2007, the share of wealth produced by
this sector rose to the level of 62.6%4. Although Veneto is following a
sector relocation path from industry to services, a switch that highlights its dynamicity alongside the most advanced economies, at the same time it shows some aspects of weakness in long-term growth, particularly in
1 Eurostat, Regional Statistics,
http://epp.eurostat.ec.europa.eu/portal/page/portal/statistics/themes.
2 There are 20 regions in Italy. The region with the highest level of GDP per capita is
Lombardy, which reached 136.1% of the EU average and finished 37th at the European level.
3 We refer to the NUTS 2 division.
strategic sectors such as high-technology industries and those engaged in R&D. In the period 2002-2006, R&D spending was lower than the Italian average, which is modest compared to European standards, both as a percentage of GDP and in terms of the number of people employed in research (Regione Veneto, 2010). Veneto is the seventh Italian region in absolute terms of spending in R&D – with over 776 million Euros in 2005. In terms of R&D expenditure to GDP ratio, the region falls to the fifteenth place among all Italian regions. This weakness is confirmed by data on the employment in R&D sectors. In 2005, with only 2.2 employees per thousand inhabitants, against a national average of 3, Veneto ranks only eleventh among the Italian regions.
The ability of a territory to position itself strategically can be measured by its productive composition in terms of technological content. In terms of
active high technology manufacturing firms5, in 2007, Veneto was the
second region in Italy after Lombardy. Although the data would indicate Veneto as a centre of excellence for high technology, in 2007 more than half of the manufacturing industry in Veneto was low tech. Only 5.6% of
companies were in the high-technology sector6 (Regione Veneto, 2009).
Similarly, the Veneto region highlights the predominance of the traditional sectors, even in the aggregate of services. The tertiary sector, reclassified according to the varying degrees of knowledge, consists of mostly traditional services (61.5% of the entire sector in 2008).
The theoretical literature and empirical evidence point to the strong link between the ability to innovate, the productivity of labour, the dissemination of new technological knowledge, of products and processes, and the human capital of a territory. We therefore look at the educational
level of the population of Veneto in 20017 (which is the year of the last
census and the reference year for econometric analysis), in order to determine whether there is a link between the reduced propensity to innovate and the availability of human capital. The percentage of Veneto
inhabitants who have a tertiary education8 (only 6.5%) is lower than the
Italian average by one percentage point. Among the Veneto population, one in four holds a secondary school diploma (in line with the national average). The rest of the population, approximately 59%, has a lower
5 There follow Piemonte (8.8%), Lazio (8.7%) and Emilia-Romagna (8.4%).
6 52.8% in low technology, 26.9% in medium-low technology, and 14.7 in medium-high
technology sectors.
7 Resident Population aged 6 or older.
secondary school diploma (scuola media inferiore), professional training (avviamento professionale), or an elementary school diploma (licenza
elementare). About 9% of the population aged 6 years and over does not
hold a diploma (illiterate or without study title) (ISTAT, 2001).
2. The research question
The theoretical model on which we base our empirical analysis is the model of endogenous growth driven by sectors engaged in innovation and, to this end, using human capital. The main model of reference goes back to Romer (1990) that formalizes the correlation between human capital employed in R&D and growth of per capita income.
Our purpose is to verify the validity of this model at a sub-regional level by going through the breakdown of sectors according to their intensity of research and development, in a productive context, the Veneto region, that appears to be characterized by not particularly high rates of schooling and limited diffusion of high-tech sectors.
The literature that tests the hypotheses of the Romer model, also developed at a regional level, does not deal with human capital employment across sectors. Due to the limited availability of data and the lack of information on the content of human capital of the workforce among the sectors of economy, the Romer hypotheses have been only partially verified. These models include, among the explanatory variables, the dimension of human capital and the activity of R&D – usually measured by the number of patents – carried out in the territory of reference. Therefore, these models fail to test the hypothesis that human capital is crucial for growth when used in sectors that are engaged in R&D.
The model we propose attempts to fill this gap. By using matched employer-employee data on employment spells occurring in Veneto, we are able to determine, for each territory of analysis, the number of workers with a certain level of education working in a certain sector. This allows us to work at a higher disaggregation level with respect to that proposed by the literature. Moreover, it makes feasible a deeper investigation of the relationship between human capital, intensity of research and development activity, and development of different sectors. This also allows the testing of some of the most recent theoretical results that support the idea that human capital has a higher growth effect when it is employed in sectors closer to the technological frontier (Vandenbussche et al., 2006). As described in the following section, we can calculate not only the share of workers employed in different sectors (we have a 5-digit breakdown) and
percentages by level of education but also the measure of worker-months – that is, the number of workers weighted by the proportion of the year in which they have actually worked.
Following the OECD sector classification, industries will be classified in high, medium-high, medium-low and low technology industries (see Section 4). The territorial unit of reference is the Local Labour System (LLS).
The context of this study consists of an urbanized area spread along the flat part of the region where, despite the presence of large urban centres, we observed the phenomenon of urban sprawl, that is, an area with highly interconnected relationships and high mobility. In light of these facts, we were motivated to develop an empirical analysis by means of regression models that account for a possible spatial correlation between the observations, albeit the territorial unit we use (the LLS) already embodies part of that spatial dependence. Thus, the empirical analysis was conducted using both the OLS regression method and spatial regressions.
3. The Dataset and a First Descriptive Analysis
3.1 Constructing the DatasetThe study required the construction of an original dataset, both for the territorial level of reference and the variables that were created. By merging data from different sources and using a matched employee-employer database that contained detailed information on working spells in the Veneto region, we were able to recover information on human capital and technology contents of the Local Labour Systems (LLSs) of Veneto.
Regarding the definition of the territorial unit of analysis, it is necessary to remember that the Veneto region is characterized by strong territorial and productive differences. However, it has a highly developed and articulated infrastructural network and a workforce that presents a high degree of inter-communal mobility. The mobility of the workforce makes the definition of the territorial unit of reference very important. For this reason, our analysis has been carried out at the level of Local Labour Systems (LLSs), which are aggregations of municipalities that identify homogeneous labour markets. The LLSs were built on routes of commuting between home and work identified during the population census of 2001. As a result, our dataset consists of 34 LLSs.
Some of the variables we used in the study were obtained or constructed using the information provided by ISTAT (2008). We refer in particular to
data on value added expressed in industrial prices9 for the period
2001-2005, the resident population, and the number of employees in the industry and service sectors. Using ISTAT data, we were able to calculate the per capita value added produced by industry and services separately, as well as the growth rates of value added per capita and the I&S Concentration Index. Unfortunately, information available from ISTAT does not allow qualitative analysis of the workforce (at the local level), that is, in terms of educational attainment and professional content. Therefore, in order to overcome this lack of information and to carry out the study of the relationship between growth, human capital, and technological intensity, we merged ISTAT data with information retrieved from the database
Giove,10 which was provided by the Labour Agency of the Veneto Region,
Veneto Lavoro.11
This original database contains matched employee-employer data, including all employment spells in the Veneto region in the period
1995-200712. The distinctive feature of Giove is its uniqueness in the Italian
scene. Indeed, this database contains information on educational attainment and professional levels that allow the definition of the workforce’s human capital content. Moreover, considering that all the registered firms are classified according to their production sector at a very high level of disaggregation (5 digits), Giove allows the classification of firms according to their technological intensity. To the best of our knowledge, this paper is the first to make use of this database in order to build human capital and technology intensity indicators at such a disaggregated level.
Although Giove is very rich in information, it must be used with caution because the database has some limitations. Indeed, the registered employment spells are those derived from the obligatory recruitment communications that firms are supposed to deliver to the Regional Employment Centres. Therefore, Giove does not include information on those spells for which communication to the Regional Employment Centres is not compulsory, such as in the case of public servants and the
self-
9 To adjust for changes in the price level we use an industrial price index.
10 The Database Giove is the result of a corrective and integrative work on micro-data
extracted from the databases managed by the Regional Employment Centres –REC (in Italian Centri per l’Impiego - CPI) in the Veneto region. The version used in the present paper contains information updated to the end of December 2007. (Maurizio, 2006)
11 Veneto Lavoro, established in 1998, is a technical agency of Regione Veneto, with
organizational, accounting, administrative and financial autonomy.
12 However, to be able to match these data with ISTAT’s Value Added data, we use only
employed. In addition, employees hired prior to the computerization of obligatory communications – which became systematic in the second half of the 1990s – and still working in the same company on the date of
observation are not included in the dataset13. The first limitation of Giove
was not a problem in our study since our analysis was conducted on the private sector alone. Regarding the second limitation, also in this case our analysis is not affected by the problem. In fact, the dataset is reliable, and covers almost all workers surveyed by ISTAT, since the mid-90s (Maurizio, 2006).
With regard to the concept of human capital we refer to, it is uniquely related to the level of education of workers and not to the incremental component of the same stock that is normally generated during the working
life of the individual or by means of continuous vocational training.14
Furthermore, we refer to workers with a medium-high education, that is, an upper-secondary school diploma or a university degree –such as a university graduate or postgraduate diplomas –, which corresponds to levels 3 to 7 of the International Standard Classification of Education
(ISCED).15 Given this classification, which is supported by the structure of
the Italian schooling system and the actual use of different qualifications in the labour market, we calculated for each LLS the percentages of workers with a given level of education. Next, we constructed a measure of human capital for every LLS, given the percentage of workers with a diploma of secondary school or a university degree. Subsequently, the measures were refined by intersecting the information on human capital with the sector
where it is used.16
One of the limitations in using the number of workers to measure employment is the fact that many employment relationships last less than a year. As a result, if such short contractual arrangements are more frequent among workers with higher levels of education, then our measure of human capital would overestimate this productive factor. To overcome this limitation, a different measure of human capital was adopted by
13 There are absences also among the firms. It is the case of firms without employees or
firms that have not changed their structure since the beginning of the computerization era.
14 The data do not allow identifying other components of human capital.
15 In international terms, this corresponds to ISCED 3-7 educational levels.
16 Firstly considering the two macro-sectors of Industry and Services sectors and
recalculating all the variables described above in worker-months17
weighting each contract for its actual length in months.
As regards the industrial technological aggregation, we adopted the OECD classification (2004) that classifies industries in high-,
medium-high, medium-low and low technology industries.18 This classification is
based primarily on the intensity of R&D, that is, the expenditure on R&D19,
and therefore, it indicates the diverse propensity to spend on R&D. Moreover, it incorporates an index of the technological content in terms of the usage of the technology. This index weighs the intensity of technology embodied in intermediate goods and capital goods purchased by the sector itself.
The OECD classification may well represent, in our opinion, the differing propensities to perform R&D. In fact, as can be seen from a survey on patents held in Italy (Trigilia and Ramella, 2008), innovative activity is particularly common in sectors that incorporate a medium-high technology. More than a half of patent applications registered at the European Patent Office in 2008 fall in this OECD category (50.4%). The remaining half is shared by high- (23.87%), medium-low (18.13%), and
low-technology firms (7.57%).20
17 The rule that we adopted in contract duration calculation in year 2001 consisted in
assigning a full month if the employment spell lasted at least 15 days and zero otherwise.
18 High-technology industries: Aeronautics and Aerospace, Pharmaceuticals, Office
machinery and computers, radios and television and communications, medical, surgical and orthopaedic instruments and machines of precision and control, optical instruments and photographic equipment. Medium-high technology industries: machinery and apparatus n.e.c (not elsewhere classified), motor vehicles, trailers and other transport equipment n.e.c, chemicals and synthetic fibbers (not pharmaceuticals), machinery and equipment n.e.c. Medium-low technology industries: shipbuilding, rubber and plastics, coke, refineries, nuclear fuel processing, products non-metallic mineral processing, metal products and processing and other alloys. Low-technology sector: manufacturing n.e.c., recycling and recovery, wood pulp, paper, publishing and printing, food, beverages and tobacco manufacture of textiles, leather products, leather and footwear.
19 The data used by the OECD are built considering the expenditure on R&D for the
period 1973-1995, disaggregated by industrial sectors for 15 OECD countries (Analytical
Business Enterprise Research and Development –ANBERD data).
20 Among high-technology industries, those with the highest concentration of patents are
pharmaceuticals, medical apparatus and orthopaedic surgery, radio, television and communications and, finally, manufacture of machinery and precision instruments and control. In the category of medium to high technology companies stand out for their patenting firms in the sector of machinery and mechanical appliances (with 31.1% of total patents), followed, with much lower performance, but not less negligible, the chemical and automotive industries (both around 7% of national patents). These percentages are also
3.2 A geographical analysis of human capital and technology
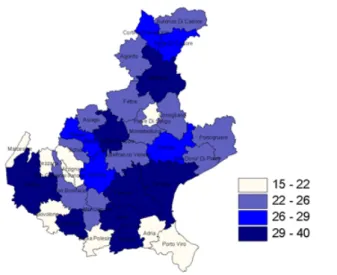
Before discussing the empirical model, we make a brief descriptive analysis of the region's employment of human capital and technology based on the data we have compiled and discussed in the previous section. This exercise, conducted at the level of LLS, allows us to highlight the variety and diversity in human capital use and technological content of industries from the Veneto region. Evidence of this heterogeneity is clear from the following figures that summarize the regional distribution across LLSs of human capital and technology (and their interaction). Figures related to human capital show the percentage of workers employed in every LLS having at least an upper-secondary school diploma. Figures related to the technology “content” of industrial sectors summarize, for every LLS, the percentage of workers employed in industries classified as high-, medium-high, medium-low and low- technology industries. The last figures show the percentage of human capital employed in industries with different technology content. In each figure, different colours represent different quartiles of the distribution of the variable of interest. The lower and upper limits of each quartile are shown in the right-hand scale. We chose to discuss the data related to 2001, because this is the starting year of our econometric analysis of the growth rate of GDP per capita between 2001 and 2005; LLS growth rates were regressed on the initial values (year 2001) of the characteristics of interest.
Figure 1 clearly shows that the proportion of human capital of total workforce is less or equal to 26% in half of Veneto’s LLSs, meaning a limited use of workers with a high level of education and/or a low availability of human capital across the region. However, despite the low proportion of employees endowed with high levels of education, we can observe a high dispersion of human capital; the human capital proportion of employees varies between a minimum of 15% and a maximum of 40%. The highest percentages are detected in correspondence with LLSs that incorporate the provincial capitals of Venice, Padua and Verona and their surrounding areas. Those capitals are also the cities with universities.
registered among the best sectors in terms of patenting, companies to medium-low technology: the fields of rubber and plastic processing and metal and other alloys.
Fig. 1 – Proportion of human capital over total employment in industries and services (percentage in each LLS). Year 2001.
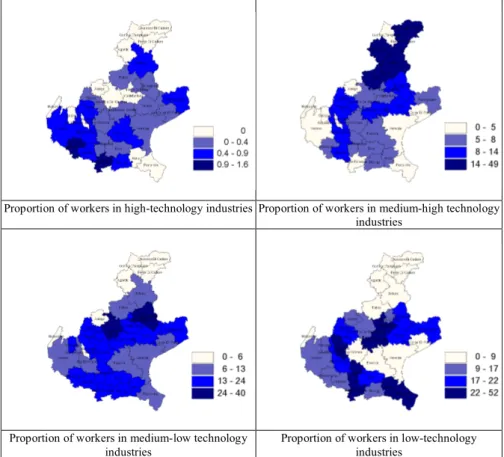
In Figure 2 we represent, for each LLS, the percentage of workers employed in industries classified according to their technology intensity: high-, medium-high, medium-low and low-technology industries (over the total of workers employed in manufacturing and services). According to the figure, high- and medium-high technology industries are not very well-developed in the region. The percentage of workers in high-technology industries is rather low: it does not exceed 1.6% in any LLS and it is almost null in a quarter of them. Also for the measure of human capital, the best data are shown in those LLSs that include some of the provincial capitals: in particular, Verona, Padua and Belluno. Similar figures are shown for medium-high technology industries. In this case, Verona, Vicenza and Belluno are the best performing LLSs of the region.
A different picture emerges with respect to high and medium-low technology industries. The share of employment in these cases can reach quite high percentages. However, while medium-high industries are rather concentrated in the LLS of the province of Belluno with employment shares of almost 50%, and they are largely absent in the rest of the region with labour shares of less than 15%, medium-low industries are widely spread across all LLSs with higher employment shares. Medium-low industry is the most representative in the region in terms of employment.
Low-technology industries are among those with the highest employment shares compared to the others. However, the territorial pattern is rather different from the other types of productions: low-technology industries are mainly concentrated in peripheral LLSs, far from the largest urban centres.
Fig. 2 – Proportion of workers in industries with different technology intensity over total employment in industries and services (percentage in each LLS). Year 2001
Proportion of workers in high-technology industries Proportion of workers in medium-high technology industries
Proportion of workers in medium-low technology industries
Proportion of workers in low-technology industries
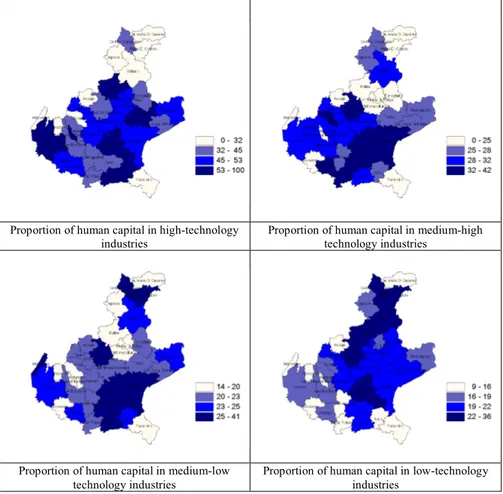
Figure 3 shows the territorial distribution of human capital interacted with technology intensity, i.e. the percentage of workers with at least an upper-secondary school diploma employed in high-, medium-high, medium-low and low-technology industries. This figure is particularly interesting if interpreted in connection with Figure 2. In general, we can observe decreasing human capital shares as industrial technology intensity diminishes, confirming the theoretical predictions on the correlation between human capital and technology. As a consequence, the territorial
distribution of the share of human capital is strictly correlated to LLS “specialisation” in high- and medium-high technology industries and much less correlated to the territorial pattern of medium-low and low-technology industries. These pictures seem to highlight how high- and medium-high technology industries are the most efficient in employing human capital in the Veneto region as well.
Fig. 3 – Proportion of human capital in industries with different technology intensity over total employment in industries and services (percentage in each LLS). Year 2001
Proportion of human capital in high-technology industries
Proportion of human capital in medium-high technology industries
Proportion of human capital in medium-low technology industries
Proportion of human capital in low-technology industries
4. The results of the empirical analysis
4.1 The OLS modelThe first results that we are about to discuss are related to the OLS estimates reported in Table 1. The table also includes the estimates of the simplest specifications, from which we began our empirical analysis and helped in defining the more detailed specifications. Only Models 4 and 5 have been estimated also using variables defined on employment corrected for actual months of work (Models 4' and 5'). The models do not show correlation problems between the explanatory variables; therefore, the
significance level is reliable.21
The starting model (Model 1) is a simple specification to check how growth is affected by human capital availability and proportion of employment in the service sector. Hence, the equation is the following:
𝛾"#$"%,' = 𝛼 + 𝛽%∗ log0𝑉𝐴3.5._"%,'7 + 𝛽8∗ 0𝐼&𝑆<=_"%,'7 + 𝛽>∗
0𝐿. 𝑆ℎ𝑎𝑟𝑒. 𝑆"%,'7 + 𝛽D∗ 0𝐻𝑢𝑚. 𝐶𝑎𝑝."%,'7 + 𝜀 (1)
where 𝛾"#$"% is the growth rate of per-capita value added in Industry and
Services between year 2005 and 2001; log0𝑉𝐴3.5._"%,'7 is the logarithm of
per-capita value added in Industry and Services; 𝐼&𝑆<=_"%,' is the Industry
and Services Concentration Index calculated as the ratio between the number of employees in Industry and Services and resident population;
𝐿. 𝑆ℎ𝑎𝑟𝑒. 𝑆"%,' is the percentage of workers in Services; 𝐻𝑢𝑚. 𝐶𝑎𝑝."%,' is
the percentage of workers with at least upper-secondary education; 𝜀 is the error term that is assumed to be normally distributed with unitary variance and null correlation. All explicative variables are measured at LLS level in year 2001.
The results (Table 1) show how all variables are statistically significant and the model explains 47% of growth variability. It appears that the LLSs of the Veneto region follow a path of convergence, the concentration of production creates positive growth externalities, and a greater specialization
21 The models, whose results are discussed here, are the ones that have a correlation
between the regressors lower than 0.5 (in absolute value). Upon request, we can provide the correlation matrices.
in services is highly correlated with growth. Finally, and most importantly, human capital and growth are highly related.
Tab. 1 – Growth, human capital and sector intensity. OLS regressions
Estimates with heads of workers Estimates with man-months
Dependent variable: growth rate of per capita Value Added
in Industry and Services (I&S) - 2001-2005 Model 1 Model 2 Model 3 Model 4 Model 5 Model 4’ Model 5’ Log per capita Value Added. Industry and Services 2001 -.442
(-5.40) (-5.39) -.442 (-4.38) -.436 (-5.13) -.315 (-3.53) -.369 (-5.77) -.352 (-5.60) -.445 I&S concentration index .004
(3.71) .004 (5.02) .005 (3.23) .003 (3.93) .005 (5.83) .004 (4.14) .005 (6.66) % workers in Services .003 (3.08) (2.12) .004 (1.91) .004 % workers with at least upper-secondary education .006
(2.25)
Sectors’ technology intensity
% of workers in high tech sectors .054 (1.73)
.046 (1.52) % of workers in medium-high tech sectors .000
(0.16)
.001 (0.36) % of workers in medium-low tech sectors .006
(2.74) (2.56) .006 % of workers in low tech sectors -.000
(-0.16) (-0.35) -.001
Interaction between workers’ educational level and macro-sectors of work
% workers in Industry with a professional diploma -.012 (-0.76) % workers in Services with a professional diploma -.004
(-0.18) % workers in Industry with at least upper-secondary
education (1.30) .006 (1.28) .008 % workers in Services with at least upper-secondary
education (3.09) .012 (2.25) .012 (1.83) .008 (2.39) .010
Interaction between workers’ human capital and sectors’ technology intensity
% of workers in high tech sectors with at least
upper-secondary education (1.33) .089 (1.49) .077 % of workers in medium-high tech sectors with at least
upper-secondary education (0.15) .002 (0.29) .002 % of workers in medium-low tech sectors with at least
upper-secondary education (1.91) .027 (2.35) .024 % of workers in low tech sectors with at least
upper-secondary education (-0.47) -.005 (-1.16) -.010
Observations 34 34 34 34 34 34 34
R2 0.47 0.56 0.54 0.69 0.69 0.67 0.69
Note: t-statistics in parenthesis. All models include constants. Robust estimates.
In Models 2 and 3, we added interactions between macro-sector intensity (Industry kept distinct from Services) and variables of human capital use. In Model 3, we also added a variable measuring the proportion of workers with vocational training education in order to determine whether this kind of education can be strategic for growth.
Estimation results show a greater explanatory power of these models than the basic one. On the one hand, they confirm the presence of a convergence path of per capita value added and the presence of positive externalities of production increasing local capacity to grow. On the other hand, growth does not seem to be influenced in any way (neither positively nor negatively) by the use of the workers endowed with vocational
education, regardless of the macro-sector of employment. Instead, human capital appears to be correlated with growth when used in Services rather than in Industry. The last result suggested us to proceed with a further sector breakdown, following the theoretical idea (discussed above) that human capital employed in sectors at least partially innovative may be a key driver of growth.
Following the OECD sector classification mentioned above, we enriched the model specification by including the percentage of workers in high, medium-high, medium-low and low technology intensity (Model 4) and successively by specifying the intensity of human capital employed in each of these sectors and in services (Model 5). The results clearly show how, in the Veneto region, the sector that significantly explains the growth path is the medium-low technological intensity one. On the other hand, the productive “specialization” which has potentially the greatest impact on LLSs growth is the one in high-technology sectors, with an estimated coefficient (in Model 4) equal to 0.54, against 0.06 in the medium-low technology industries. However, although the high technology-intensive sector is significant as a whole, the human capital employed in it does not enter significantly the growth equation (Model 5), unlike what happens with the intensity of human capital employed in the firms in the medium-low technology sector.
This result seems to be indicative of an insufficient use of highly educated workers in this sector. Moreover, observing the results of Models 4' and 5', in which variables are built considering worker-months rather than simply the number of workers, this sector seems to lose in terms of the ability to explain growth. This result indicates that high technology industries are strongly characterized by the use of temporary labour. This can have dual effects on productivity: firstly, temporary employment can cause the employee to commit less to achieve good results; and secondly, firms using mainly temporary employment may have no incentive to invest
in specific training, which negatively affects system productivity22.
4.2 The Spatial models
The context in this study consists of an urbanized area spread along the flat part of the region where, despite the presence of large urban centres, we
observed the phenomenon of urban sprawl, that is, an area with highly interconnected relationships and high mobility. In light of these facts, we were motivated to develop further an empirical analysis by means of regression models that account for a possible spatial correlation between the observations, albeit the territorial unit we use (the LLS) already embodies part of that spatial dependence.
We estimated two different spatial models. Both specifications required the ex-ante definition of the matrix of spatial relations that best captures spatial dependence (Anselin, 1988), whether it is observed in the dependent variable or in the error term. The empirical results we are going to discuss have been obtained on the basis of a spatial dependence matrix defined on the criterion of contiguity between LLSs. Each i-th row of the matrix records a set of contiguity relations associated with one of the 34 LLSs. For example, the matrix element in row 1, column 2 would record the presence (represented by a 1) or absence (denoted by 0) of a contiguity relationship between LLSs 1 and 2. There are alternative ways to define the presence of contiguity (LeSage and Kelley Pace, 2004); the criterion we adopted consists in defining each matrix element equal to 1 if LLSs share a common
side or a common vertex with the LLS of interest.23
The first model we tested is the classical mixed regressive-spatial autoregressive model, in which some part of the total variation in the dependent variable across the spatial sample would be explained by each observation’s dependence on its neighbours, according to a parameter that will capture that dependence, measuring the average influence of neighbouring or contiguous observations on observations in the vector y. Again, using the matrix notation, the model can be summarized in the following equations:
𝑦 = 𝜌𝑊𝑦 + 𝑋𝛽 + 𝜀
𝜀~𝑁(0, 𝜎8𝐼
U) (1)
where y contains the 34x1 vector of cross-LLS dependent variables – the growth rates of per capita value added between 2001 and 2005 – and X represents the 34xk matrix of explanatory variables. As to W, this is the
23 Estimates have also been carried out by using a standardized matrix. Results in terms
of significance and coefficient levels are not significantly different from the results we are discussing. Due to a lack of space, we do not include these results.
34x34 spatial weight matrix we defined above, with zeroes on the main diagonal, zeroes in positions associated with non-contiguous observational units and ones in positions reflecting neighbouring units that are (first-order) contiguous. Parameter ρ captures the average influence in the dependent variable of neighbouring or contiguous observations. The error terms are normally distributed with unitary variance and null correlation.
A possible source of spatial dependence could arise because of the exclusion of explicative variables spatially correlated, which may affect the independence of the error terms. For that reason, we proceeded to estimate a second spatial specification with autoregressive disturbances. Spatial error correlation is modelled as follows:
𝑦 = 𝑋𝛽 + 𝑢 𝑢 = 𝜆𝑊𝑢 + 𝜀
𝜀~𝑁(0, 𝜎8𝐼
U) (2)
where u is the vector of spatially autoregressive error terms and parameter ɛ is a coefficient on the spatially correlated errors analogous to the serial correlation in time series. We proceed in estimating Equations 1 and 2 by using both regressors defined in terms of head of workers and worker-months.
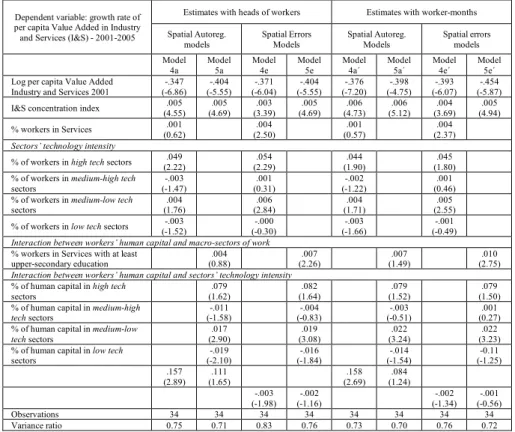
In Table 2 we report the results of spatial estimates run on the specification of Models 4 and 5 (previously estimated with OLS). Our results show that any source of spatial correlation we model, whether in the dependent variable or in the error term, is particularly high in Model 4, i.e. when the explicative variables include sector disaggregation of employment, but exclude sector breakdown of the use of human capital. When we introduce this sector breakdown (in Model 5), spatial dependence is less important; this happens both in the autoregressive model and in the specification with spatially correlated errors. This result may suggest that the
more detailed models are able to capture most of the spatial correlation24.
Going through the results of both OLS and spatial estimates and taking into account the most appropriate model, we can highlight the significant
24 Respecting the numbers assigned to the models estimated using the heads of workers
and worker-months (numbers with apostrophe), spatial models were numbered following the same principle, adding subscripts to distinguish models with spatial errors (subscript e) from models with spatial correction on the dependent variable (subscript a).
and positive relevance for growth of the relative magnitude of the sector with the highest technological intensity. High-technology industries have a higher growth effect than the one induced by medium-low technology industries. The growth effect of high-technology industries is almost ten-time higher than the effect of medium-low technology “specialization”. The different effect on growth of the two industries is still clear when only the human capital content of the workforce is considered. However, in this last case the effect of human capital working in high-technology industries is not so significant at 10%. This result seems to be indicative of an
inefficient use of highly educated workers in this sector.25
Tab. 2 – Growth, human capital and sector intensity. Spatial models (a: autoregressive; e: correlated errors)
Dependent variable: growth rate of per capita Value Added in Industry and Services (I&S) - 2001-2005
Estimates with heads of workers Estimates with worker-months Spatial Autoreg.
models Spatial Errors Models Spatial Autoreg. Models Spatial errors models Model
4a Model 5a Model 4e Model 5e Model 4a´ Model 5a´ Model 4e´ Model 5e´ Log per capita Value Added
Industry and Services 2001
-.347 (-6.86) -.404 (-5.55) -.371 (-6.04) -.404 (-5.55) -.376 (-7.20) -.398 (-4.75) -.393 (-6.07) -.454 (-5.87) I&S concentration index (4.55) .005 (4.69) .005 (3.39) .003 (4.69) .005 (4.73) .006 (5.12) .006 (3.69) .004 (4.94) .005 % workers in Services .001 (0.62) .004 (2.50) .001 (0.57) .004 (2.37)
Sectors’ technology intensity
% of workers in high tech sectors (2.22) .049 (2.29) .054 (1.90) .044 (1.80) .045 % of workers in medium-high tech
sectors -.003 (-1.47) .001 (0.31) -.002 (-1.22) .001 (0.46) % of workers in medium-low tech
sectors (1.76) .004 (2.84) .006 (1.71) .004 (2.55) .005 % of workers in low tech sectors (-1.52) -.003 (-0.30) -.000 (-1.66) -.003 (-0.49) -.001
Interaction between workers’ human capital and macro-sectors of work
% workers in Services with at least
upper-secondary education (0.88) .004 (2.26) .007 (1.49) .007 (2.75) .010
Interaction between workers’ human capital and sectors’ technology intensity
% of human capital in high tech sectors .079 (1.62) .082 (1.64) .079 (1.52) .079 (1.50) % of human capital in medium-high
tech sectors (-1.58) -.011 (-0.83) -.004 (-0.51) -.003 (0.27) .001
% of human capital in medium-low
tech sectors (2.90) .017 (3.08) .019 (3.24) .022 (3.23) .022
% of human capital in low tech
sectors (-2.10) -.019 (-1.84) -.016 (-1.54) -.014 (-1.25) -0.11 .157 (2.89) (1.65) .111 (2.69) .158 (1.24) .084 -.003 (-1.98) -.002 (-1.16) -.002 (-1.34) -.001 (-0.56) Observations 34 34 34 34 34 34 34 34 Variance ratio 0.75 0.71 0.83 0.76 0.73 0.70 0.76 0.72 Note: z-statistics in parenthesis. All models include constants. Robust estimates.
Conclusions
In this article, we study the role of human capital in promoting overall economic growth. The analysis is carried out for the Veneto region, using original matched employer-employee data that allow to measure the availability of human capital at firm level. Data are aggregated at LLS, and industries are classified as high-, medium-high, medium-low and low-technology intensive. The empirical analysis proposes OLS and spatial regressions.
The results clearly show how in the Veneto region the productive “specialization” which is potentially much correlated with growth is the one in high-technology. This confirms, even for a region like Veneto mainly specialized in medium-low technology industries, the relevance for growth of production specialization closer to the technology frontier (Acemoglu et al., 2006; Vandenbussche et al., 2006). However, although the high technology-intensive sector is important as a whole, human capital employed in it does not appear to be significantly correlated with growth, unlike what happens with the intensity of human capital employed in medium-low technology firms. This result seems to suggest that employment of human capital in high-technology firms is not yet sufficiently large to enhance growth.
These results suggest the need to promote the development of technology industries and the greater use of human capital in high-technology industries, to give Veneto the capacity to maintain its potential
for future growth.26 It could be of interest, for future research, to analyse
whether the recent economic crisis has affected the productive system of the region and if it has changed the relationships we found.
Acknowledgements
The authors acknowledge funding support from CO.RI.LA (Consorzio per la Gestione del Centro di Coordinamento delle Attività di Ricerca inerenti il Sistema Lagunare di Venezia) on behalf of Venice Water Authoriry (Magistrato alle acque). Research programme: “La Laguna di Venezia nel quadro dei cambiamenti climatici, delle misure di mitigazione e adattamento e dell’evoluzione degli usi del territorio”.
References
Acemoglu, D., Aghion P., & Zilibotti, F. (2006). Distance to frontier, selection, and economic growth. Journal of the Economic Association, 4, 37-74. DOI: 10.1162/jeea.2006.4.1.37.
Aghion, P., & Howitt, P. (1992). A model of growth through creative destruction.
Econometrica, 60, 323-351. DOI: 10.3386/w3223.
Anselin, L. (1988). Spatial econometrics: methods and models. Boston, Kluwer Academic Publishers.
Bank of Italy (2009). L’economia del Veneto nell’anno 2008. Venezia, Bank of Italy. Cappelen, A., Castellacci, F., Fagerberg, J., & Verspagen, B. (2003). The impact of EU
regional support on growth and convergence in the European Union. Journal of
Common Market Studies, 41, 621-644. DOI: 10.1111/1468-5965.00438.
Cappelen, A., Fagerberg, J., & Verspagen, B. (1999). Lack of Regional Convergence. In J. Fagerberg, P. Guerrieri & B. Verspagen (Eds), The Economic Challenge for Europe.
Adapting to Innovation Based Growth. Cheltenham, Edward Elgar Publishing.
Dunford, M., & Smith, A. (2002). Catching up or falling behind? Economic performance and the trajectories of economic development in an enlarged Europe. Economic
Geography, 76, 169-195. DOI: 10.1111/j.1944-8287.2000.tb00139.x.
European Commission (2009). Europe’s regional research systems: Current trends and
structures. Luxembourg, Office for Official Publications of the European Communities.
European Commission (2010). EUROPE 2020 A strategy for smart, sustainable and
inclusive growth. Brussels, European Commission.
Fadda, S. (2016). Labour coefficients reduction and working time reduction. Argomenti, (4), 67-87. DOI: http://dx.doi.org/10.14276/1971-8357.557.
Hauknes, J. & Knell, M. (2009). Embodied knowledge and sector linkages: an input-output approach to the interaction of high- and low-tech industries. Research Policy, 38, 459-469. DOI: 10.1016/j.respol.2008.10.012.
ISTAT (2001). General Census of Population 2001. Rome, ISTAT. web: dawinci.istat.it/MD/index.html.
ISTAT (2008). Valore aggiunto e occupati interni per Sistema Locale del Lavoro. Anni 2001-2005, Rome, ISTAT.
LeSage, J.P., & Kelley Pace, R. (2004). Spatial and spatiotemporal econometrics. Amsterdam, Elsevier.
Lucchese, M., Nascia, L., & Pianta, M. (2016). Una politica industriale e tecnologica per l’Italia. Argomenti, (4), 25-50. DOI: http://dx.doi.org/10.14276/1971-8357.568
Maurizio, D. (2006). GIOVE: Un database statistico sul mercato del lavoro Veneto. Costruzione e indicazioni per l’utilizzo. I Tartufi, 22.
Marra, C., & Turcio, S. (2016). Insider e outsider nel mercato del lavoro italiano. Argomenti, (4), 89-134. DOI: http://dx.doi.org/10.14276/1971-8357.524.
OECD (2003). The Sources of Economic Growth in OECD Countries. Paris, OECD. OECD (2004). Using patent data as science and technology indicators – patent manual
1994. OECD/GD, 94, 114.
Regione Veneto (2009). Statistical Report, Venezia, Regione Veneto. Regione Veneto (2010). Statistical Report. Venezia, Regione Veneto.
Robertson, P., Smith, K., & von Tunzelmann, N. (2009). Innovation in low- and
medium-technology industries. Research Policy, 38, 441-446. DOI:
Romer, P.M. (1990). Endogenous technological change. Journal of Political Economy, 98, 71-102. DOI: 10.3386/w3210.
Stevens, P., & Weale, M. (2004). Education and Economic Growth. In G. Johmes & J. Johnes (eds), International Handbook on the Economics of Education. Cheltenham, Edward Elgar Publishing.
Trigilia, C., & Ramella, F. (Eds.) (2008). Il Rapporto 2008. I Rapporti di Artimino sullo
Sviluppo Locale.
Vandenbussche, J., Aghion, P., & Meghir, C. (2006). Growth, distance to frontier and composition of human capital. Journal of Economic Growth, 11, 97-127. DOI: 10.1007/s10887-006-9002-y.