UNIVERSITÀ DEGLI STUDI DI ROMA
"TOR VERGATA"
FACOLTA' DI MEDICINA E CHIRURGIA
DOTTORATO DI RICERCA IN BIOTECNOLOGIE MEDICHE e MEDICINA
MOLECOLARE
CICLO DEL CORSO : XXII
Pharmacokinetics of Gemcitabine at Fixed Dose Rate Infusion in
Patients with Normal and Impaired Hepatic Function
Dottorando: Alessandra Felici
A.A. 2009/2010
INTRODUCTION
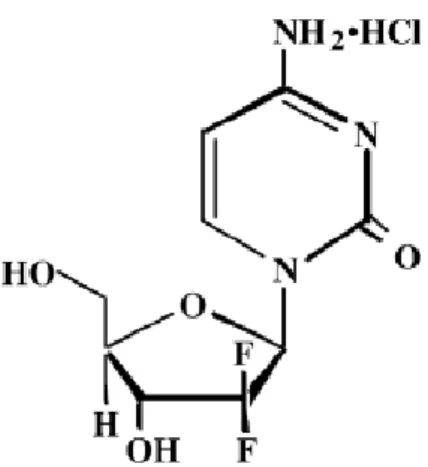
Gemcitabine (2,2-difluorodeoxycytidine, dFdC) (figure 1) is a fluorinated analog of deoxycytidine, which has shown a broad spectrum of activity against several solid tumors [1, 2]. Gemcitabine has been tested extensively as single agents or in combination with different chemotherapeutic agents, and its therapeutic indications are: non-small cell lung cancer, pancreatic adenocarcinoma, ovarian cancer, breast cancer and urothelial cancer. Because gemcitabine also seems to be a powerful radiosensitizer, there are trials in which it is combined with radiation therapy [3].
Gemcitabine exhibits cell phase specificity, primary killing cells undergoing DNA synthesis (S-phase) and also blocking the progression of cells through the G1/S-phase boundary. The drug is metabolized intracellularly to the active diphosphate (dFdCDP) and thriphosphate (dFdCTP) nucleosides. The cytotoxic effect of gemcitabine is attributed to a combination of two actions of the diphosphate and thriphosphate nucleosides, which leads to inhibition of DNA synthesis. First, gemcitabine diphosphate inhibits ribonucleotide reductase, which is responsible for catalyzing the reactions that generate the deoxynucleside triphosphates for DNA synthesis. Inhibition of this enzyme by the diphosphate nucleoside causes a reduction in the concentrations of deoxynucleotides, including dCTP. Second, gemcitabine triphosphate competes with dCTP for incorporation into DNA. The reduction in the intracellular concentration of dCTP (by the action of the diphosphate) enhances the incorporation of gemcitabine triphosphate into DNA (self-potentiation). After the gemcitabine nucleoside is incorporated into DNA, only one additional nucleotide is added to the growing DNA strands. After this addition, there is inhibition of further synthesis, resulting in apoptosis.
Gemcitabine is almost entirely excreted in the urine, and with the inactive uracil metabolite,2’-deoxy-2’,2’-difluorouridine (dFdU) accounted for 99% of the excreted dose; its plasma protein binding is negligible. The drug clearance was lower in women and in elderly resulting in higher concentrations of gemcitabine for any given dose. The volume of distribution is significantly influenced by duration of infusion and gender. Differences in either clearance or volume of distribution based on patient characteristics or the duration of infusion result in changes in half-life and plasma concentrations.
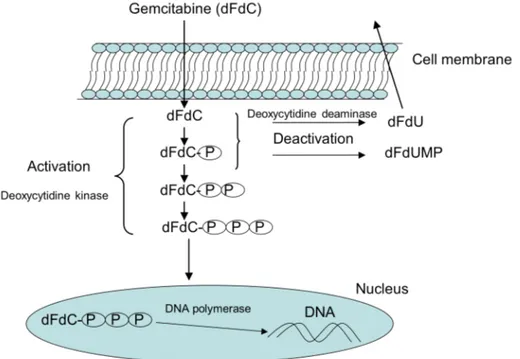
As anticipated, dFdC is a prodrug that requires intracellular activation (figure 2): after its uptake, the nucleoside analog is converted by deoxycitidine kinase in its monophosphate form (dFdCMP), followed by subsequent phosphorilation steps to diphosphate (dFdCDP) and triphosphate forms (dFdCTP) [4]. Gemcitabine undergoes also intracellular and extracellular metabolism by cytidine deaminase (CDA), the enzyme that converts the prodrug into its inactive metabolite difluorodeoxyuridine (dFdU); the dFdC deamination occurs principally in liver and kidney. The rate-limiting step in the intracellular accumulation of dFdCDP e dFdCTP is the conversion of dFdC in dFdCMP by deoxycitidine kinase [5]. It has been demonstrated that deoxycytidine kinase has a saturable kinetic and the optimal plasma dFdC concentration to obtain maximal dFdCTP formation and accumulation by mononuclear cells is 10-20 µmol/L [6]. Incubation of mononuclear cells or fresh leukemia cells in vitro with a spectrum of dFdC concentrations demonstrated that the rate of dFdCTP accumulation was saturated at plasma concentration greater than 10µmol/L, plateau reachable with a calculated dose rate of 300 mg/m2/30 min [5]. A phase I and cellular pharmacology study of
gemcitabine in patients with advanced solid tumors confirmed these data [6].
Preclinical data, using primary human tumor cultures growing in soft agar and human tumor cell lines (including pancreatic carcinoma cell line), have suggested a possible
(>2000 mg/m2/w) of gemcitabine in some studies, independent of infusion duration, might correlate with improved cytoxicity and enhanced clinical effectiveness.
In clinical practice, several schedules of gemcitabine are employed, with doses ranging from 1000 to 1500 mg/m2 weekly for 2 or 3 weeks every 21 or 28 days; in pancreatic cancer patients a loading schedule of gemcitabine at 1000 mg/m2 for 7 continuously weeks, then for three weeks with one week rest, is recently considered the standard treatment. Commonly, doses of gemcitabine ranging between 800 and 2800 mg/m2 are generally administered by intravenous infusion over 30 minutes [8,9], there is evidence that this generates plasma gemcitabine concentrations that greatly exceed (>60µmol/L) the levels that saturate the rate of triphoshate accumulation (10 to 20 µmol/L) [6,10]. Under these conditions, target cells may not use a substantial portion of the drug due to metabolic clearance. The concentration of 10 to 20 µmol/L of gemcitabine is achieved in plasma when the drug is infused at a dose rate of 6 to 10 mg/m2/min. Therefore fixed dose rate (FDR) of 10 mg/m2/min has been proposed to escape this hitch and achieve the plasma steady-state concentrations that optimizes the intracellular dFdCTP accumulation [10-12].
The half-hour administration of gemcitabine has been the most used schedule and has been termed the standards dose schedule. Saturation kinetics that led to a defined dose rate has been observed, at the beginning, for cytarabine, a prototype of nucleoside analogs. The reason that phosphorylated moieties of cytarabine and gemcitabine are the active and cytotoxic metabolites of these nucleoside analogs further underscored the importance of the dose rate infusion during clinical trials.
In order to compare the standard 30-minutes gemcitabine infusion with the fixed-dose rate infusion schedule (10 mg/m2/min), a phase II randomized trial has been conducted by Tempero and colleagues [13]. In this prospective trial, 92 patients with locally advanced and metastatic pancreatic adenocarcinoma were treated with 2,200 mg/m2 gemcitabine over 30 minutes or 1,500 mg/m2 gemcitabine over 150 minutes (FDR
arm) on days 1,8,15 of every 4-weeks cycle. The median overall survival was 5,0 months in the standard arm and 8,0 months in the FDR arm (p=.013); the time to treatment failure, the primary aim of the study, was comparable in both arms. Patients in the FDR infusion experienced consistently more hematological toxicity, and the PK analyses revealed a two-fold increase in intracellular gemcitabine triphosphate concentration in the FDR arm (p=,046). Hematological toxicity was the most significant adverse effect, and patients in the FDR arm experienced consistently more WHO grade 3 or 4 thrombocytopenia (37,2% vs 10,2%), neutropenia (48,8% vs 26,5%), and grade 4 anemia (9,3% vs 2%). Some episodes (7,3%) of hypertransaminasemia were seen in the FDR arm, but did not lead dose modification. Other nonhematological toxic effects were comparable between the two treatment arms. The pharmacokinetic analysis has been conducted in peripheral blood cells from 10 patients in the standard arm and in six patients in the experimental arm. The rate of gemcitabine triphosphate accumulation in the 30 minutes infusion arm decreased markedly after the end of the infusion; the mean peak triphosphate level at 30 minutes was 103 µmol/L. In contrast, in patients who received gemcitabine as an infusion over 150 minutes, the median triphosphate value, at this lower dose rate, was 66 µmol/L after 30 minutes, but this increased to a median of 398 µmol/L after 150 minutes. The mean plasma gemcitabine concentration at the end of the standard infusion was 99,5 µmol/L, whereas that of patients in the FDR arm was 25,5 µmol/L. The twice concentration of triphosphate accumulated in the FDR arm, was reached with only 68% of the dose used in the standard arm.
After the Tempero’s study, several head-to-head comparison of the two schedules, in patients with advanced solid tumor, especially pancreatic and non-small-cell lung cancer, have been published.
30 minutes infusion. After the standard time of infusion, the plasma concentration remained above the saturation level of 10-20 µmol/L, whereas after 1,2 or 3 h infusion it remained below the saturation level for most of the time (being in the range 2.5-10 µmol/L); in details, the 3 h infusion schedule produced the highest accumulation of gemcitabine triphosphate.
Patel et al [15] conducted a clinical investigation to evaluate in the same patients the different intracellular (in peripheral blood mononuclear cells -PBMCs-) dFdCTP accumulation after a standard 30 minutes and an experimental 150 minutes gemcitabine infusion. The gemcitabine triphosphate accumulation when dFdC was infused over 150 minutes resulted 1.4-fold increased when compared with the 30 minutes infusion. All patients received the standard dose on week 1 and the FDR dose on week 2, but the reverse schedule was not investigated. This deficiencies was fulfilled by Grimison et al. [16] who performed a randomized crossover study in 33 patients who received gemcitabine 1000 mg/m2 either by 30 minutes infusion or by 100-minutes administration; on the second week the same patients were crossed over the alternate schedule. The authors observed that, irrespective of the dose rate, there was an autoinduction of gemcitabine triphosphate accumulation during the second week. The data demonstrated that there was a schedule-dependent increase in gemcitabine triphosphate during the second week infusion, which was consistent with self-induction of gemcitabine accumulation. Authors hypothesize that this was because of an increase in the threshold required to saturate dFdCTP accumulation. The implication of this increase is that the optimal dose rate for saturation of intracellular accumulation may change over time, and 10 mg/m2/min may not be optimal for all patients all of the time. It also implies that the pharmacologic benefit of a prolonged dose-rate infusion would be overestimated in studies that take samples only on week 1.
The optimal benefit of any schedule or dose is when a clinical advantage is observed. Despite these initial promising results, other studies with gemcitabine alone or in
combination with other drugs (cisplatin, carboplatin, paclitaxel) failed to show any clinical benefit in favor of FDR infusion [9]. Our Institution in collaboration with other Italian Centers [17] reported a similar survival for patients with NSCLC (non-small cell lung cancer) treated with gemcitabine 1000 mg/m2 in 30 minutes standard infusion or 100 minutes. A clinical benefit for FDR infusion was observed for patients with brain metastases.
In pancreatic adenocarcinoma, a phase III trial [18] was conducted to compare overall survival of standard weekly gemcitabine 1000 mg/m2/30 minutes, versus gemcitabine FDR 1500 mg/m2/150 minutes or gemcitabine 1000 mg/m2/100 minutes day1 plus oxaliplatin 100 mg/m2/day2 every 14 days; neither the FDR regimen nor the combination schedule resulted in substantially improved survival or symptom benefit over standard gemcitabine.
The pharmacokinetic of gemcitabine, as clearance or metabolic capacity, can be influenced by abnormal hepatic function due to liver metastases, primary pancreatic/biliary tract carcinoma or other hepatic diseases, such as cirrhosis and hepatitis. The liver impairment is a frequent condition in oncological practice, however the extensive clinical evaluation of gemcitabine has been performed in patients with normal hepatic function. To analyze this issue, Venook et al. [19] explored the pharmacokinetic disposition of gemcitabine given as 30 minutes standard infusion in patients with liver and renal impairment. Adults with tumors appropriate for gemcitabine therapy and who had abnormal liver or renal function (divided in cohorts) where treated with escalating dose of gemcitabine and they were study, at their first dose, for pharmacokinetic assessment. A dose reduction for patients with elevated bilirubin levels, due to elevated risk of hepatic toxicity, has been suggested; the dose recommended was 800 mg/m2, to be subsequently escalated, if well tolerated. This observation came from the transient hyperbilirubinemia detected in patients with
peak plasma concentration of gemcitabine and dFdU (ranging from 3,3 and 23,8 µg/mL, and 17 and 45,7 µg/mL, respectively); only the peak plasma concentration of dFdU increased with increasing doses, but not varies systematically with cohort. At the end of infusion the concentration of gemcitabine declined rapidly; in contrast with the long terminal half-life of dFdU. There were no differences in the AUC and clearance of gemcitabine among the doses used or cohort studied. The PK analysis of gemcitabine and its metabolite, in this study, failed to reveal statistically significant differences among patients with renal or hepatic dysfunction. There also did not seem to be any relationship between baseline characteristics, such as prior chemotherapy or performance status, and toxicity, neither with PK drug disposition.
Because gemcitabine is widely used at FDR infusion in patients with pancreatic/biliary tract carcinoma, who frequent present high bilirubin level, we performed a pharmacological study to evaluate the safety of gemcitabine 1000 mg/m2 at 10 mg/m2/min infusion on days 1, 8 and 15 every 4 weeks, in patients with normal and impaired hepatic function. The principal aim of this study was to define the pharmacokinetic disposition of dFdC and dFdU in the two cohorts of patients. Secondary end points were to evaluate the toxicity in both groups, starting from the same dose of gemcitabine, and to confirm the repeatability of the pharmacokinetic parameters analyzed within the same patient in two different cycles.
MATERIALS AND METHODS
Patient Selection
Patients with cytological or histological diagnosis of recurrent or metastatic pancreatic adenocarcinoma or biliary tract carcinoma were included into the study. Eligibility criteria included: age ≥ 18 years; WHO Performance status of 0 to 2; life expectancy of two months or longer; more than 4 weeks since prior systemic chemotherapy, major surgery or radiation therapy; granulocyte >1,500 cells/µL, platelet count >100,000 cells/µL, albumin level >2.0 g/dl, serum creatinine level less than 1.6 mg/dl; compliance of the patients with testing. To limit entry to patients with hepatic dysfunction, other eligibly criteria were: AST/ALT level greater than or equal to two times the upper limit of normal with normal bilirubin levels; total bilirubin levels 1.6 to 7.0 mg/dL with any AST/ALT level. All patients signed an informed consent approved by the Institutional Ethical Committee.
Exclusions criteria included: prior treatment with gemcitabine; known untreated brain metastases; uncontrolled or severe cardiac disease; concomitant medication that could affect hepatic function; pregnant or lactating patients; patients with reproductive potential not implementing adequate contraceptives measures; patients who cannot be regularly followed up for psychological, social, familial or geographic reasons.
Patients were enrolled in two different cohorts: control patients with normal liver function in cohort I (serum bilirubin level less than 1,6 mg/dl and aspartate aminotransferase/alanine aminotransferase (AST/ALT) level less than two times the upper limit of normal (ULN)), and patients with impaired liver function in cohort II (serum bilirubin level less than 1.6 mg/dL and AST/ALT level greater than or equal to
Study Design
This single centre study focused on gemcitabine 1000 mg/m2 at FDR infusion administered on days 1,8,15 every 28 days until progressive disease or unacceptable toxicity, in patients with normal and hepatic dysfunctions. Drug toxicity and pharmacokinetics were analyzed in patients with impaired hepatic function and compared with patients with normal liver parameters. The safety dose of gemcitabine and the dose reduction required, were evaluated for a maximum of 6 cycles. Sampling for PK analysis were performed at day 1 of cycle 1 and repeated at day 1 of cycle 2, to calculate the variability of PK parameters in the same patient (each patient being his own control).
No systemic anticancer agent other than the study drug was administered, and a concomitant treatment with corticosteroids was discouraged at least from day -2 to day 2 at cycle 1 and 2. Granulocyte-colony stimulating factors (G-CSF) were not allowed in the first two cycles.
Clinical biochemistry and hematology were assessed within 7 days before starting treatment; in particular, a complete blood and platelet count as well as liver function tests (serum total and fractionated bilirubin, AST/ALT level) were obtained at baseline and weekly during treatment course. A physical examination and a record of concomitant medications were carried out at baseline and before every cycle. An electrocardiogram and chest X-ray were obtained at baseline, at discontinuation off the study treatment, and at any time when clinically indicated during the trial. Patients with measurable disease were assessed for response every three cycles with CT scan or ultrasound of the abdomen (and of other disease sites as appropriate). Responses were documented using RECIST criteria [20]. After the off-treatment visit, patients were followed up monthly with clinical and instrumental evaluation.
Values of white blood cells, platelets, hemoglobin, red blood cells, neutrophils, PT (prothrombin time), PTT (partial thromboplastin time), bilirubin, AST/ALT, AP
(alkaline phosphatase), total protein and albumin were recorded at baseline and every each cycle to evaluate a possible relationship between blood value, drug disposition and toxicity.
Evaluation of toxicity and dose modifications
The starting dose of gemcitabine was 1000 mg/m2 infused at 10 mg/m2/min; dose modifications were applied on the basis of toxicity. Administration of gemcitabine was delayed on day 1, until hematological recovery (ANC ≥1500/µL and/or PLT ≥100,000/µL and/or Hb ≥9 g/dL) up to a maximum of 3 weeks; for day 8 and 15 the dose was reduced as follows: ANC ≥1500/µL and/or PLT ≥100.000/µL: full dose; ANC:1.500-1.000/µL and/or PLT:99.999-75.000/µL: 75% of full dose; ANC:1.000-500/µL and/or PLT: 74.999-50.000/µL: 50% of full dose; ANC ≤ANC:1.000-500/µL and/or PLT≤50.000/µL: omission. Patients who required a delay of >2 weeks but <3 weeks received dose reduction of 25%. If ANC ≤500/µL, PLT ≤50,000/µL, Hb≤ 7g/dL for a period longer than 5 days, in any case of febrile neutropenia or stomatitis toxicity ≥G3 the doses of gemcitabine was reduced by 25% in the next cycles. A 25% dose reduction was planned for gastrointestinal grade 3 and 4 toxicities. For liver toxicity, doses of gemcitabine were delayed when bilirubin and AST/ALT levels were >2.5 and >5 from baseline (the starting values of each patients), respectively; doses were reduced by 50% when bilirubin and AST/ALT levels were from 1.5 to 2.5 and from 2.5 to 5 respectively from baseline. Patients who require a delay of >2 weeks but <3 weeks will receive dose reduction of 25%; patients who were not recover after 3 weeks were considered off protocol.
Blood samples (5 to 10 mL each patient) were drawn via an indwelling peripheral catheter or peripheral venipuncture, into tubes containing heparin. Tetrahydrouridine (Calbiochem-Novabiochem Corp La Jolla Ca), a cytidine deaminase inhibitor, was then added (0.1 ml of a 10 mg/ml solution) to prevent ex vivo Gemcitabine deamination. Samples were collected 30 minutes before Gemcitabine infusion, at 30, 60 and 80 minutes during the infusion, at the end of the infusion, and at 5, 30, 90, 180 and 240 minutes after the completion of the infusion.
Blood samples were immediately centrifuged at room temperature for 10 minutes at 1000 rpm. The resulting plasma was frozen and stored at -20°C until analysis.
Determination of Gemcitabine and dFdU
All the analysis was performed at the Regina Elena National Cancer Institute, Rome, Italy. Gemcitabine and dFdU plasma levels were determined using the hyphenated technique HPLC-MS/MS (high performance liquid chromatography tandem mass spectrometry). Gemcitabine (Ly188011) and dFdU (Ly198791) were kindly supplied by Eli Lilly Co, (Indianapolis, IN), 2’-deoxycytidine (dC) was purchased at Sigma Aldrich. 10 µl of Internal Standard (20γ/ml) were added to 0,2 ml of each plasma sample and the mixture was extracted with 200µl of Isopropilic Alchool and then 400µl of Ethyl Acetate. Samples were vortexed and then centrifuged for 10 minutes. The supernatant was transferred to a glass tube and the organic phase evaporated to dryness under nitrogen stream. 200µl of HPLC grade Water with 0.5% Acetic Acid, were added to each sample to reconstitute the dried residue and the mixture was vortexed and then centrifuged for ten minutes at 4000g. 20 µL of the reconstituted solution were injected into HPLC system.
HPLC analysis was performed by using an Agilent 1100 series system (Agilent Technologies, Palo Alto, CA, USA) equipped with a binary pump, an automatic injector and vacuum degasser. The separation was carried out on a Symmetry C18
(4.6*250mm I.D, 5µm particle size) protected by a sentry guard column Symmetry C18 (3.9*20mm). Mobile Phase: A, 0.5% Acetic Acid in Water; B, 0.5% Acetic Acid in Acetonitrile. Gradient elute procedure: B 2% for 2 min, B 2-50% in 10 min, B 50-70% in 1 min, B 50-70% for 4 min, B 2% in 2 min, B 2% for 3 min. The flow-rate was 1 mL/min and the HPLC output was directly interfaced to the ESI ion source, the LC/MSD ion trap mass spectrometer 1100 (Agilent Technologies). The mass spectrometer was equipped with an ESI source and operated in the positive ion mode. The ESI conditions were the following: capillary voltage -3.5 kV; end plate offset voltage-500 V; capillary exit voltage 110.9 V; nebulizer pressure 70 psi; drying gas flow 12 L min_1; temperature 350°C.
The ESI-MS analyses were MRM (multiple reaction monitoring) experiments, performed by ion fragmentation (Gemcitabine: 264→112 m/z, dC (2’-deoxycytidine)): 228→112 m/z; dFdU: 265→113 m/z) and the scan range was from m/z 100–300. In these analytical conditions, retention times for dC, Gem and dFdU were respectively 2.3, 3.8 and 6.5 minutes.
The extraction and the analysis were carried on modifying previously published methods [21,22].
Quant Analysis software was used to process the quantitative data. Plasma concentrations for Gemcitabine and dFdU were calculated from the ratio of the Gemcitabine and dFdU peaks area to the area of Internal Standard using least squares linear regression. Lower limit of quantitation for both Gemcitabine and dFdU was 0.05 µg/ml and linearity was assessed from 0.078 µg/ml and 15 µg/ml. Within-day and between-day variability (measured as coefficient of variation) was < 12.00%.
Principal PK parameters were estimated for each patient by non-compartmental method analysis; parameters include: plasmatic peak concentration (Cmax, µg/mL), determined graphically from the observed experimental values; experimental area under the plasma concentration-time curve (AUCexp,µg*h/ml), calculated according to the trapezoidal rule, from the first to the last sampling time; infinite AUC (AUCinf µg*h/ml ) area under plasma concentration-time curve extrapolated to infinity; total plasma clearance (Cl, L*h/m2), calculated as ratio of dose in µg and AUC; rate of elimination (K, h-1),calculated as the negative slope estimated from the log-linear regression of the terminal part of the plasma concentration–time curve; terminal half life (t1/2 ) defined as ln2/K. The pharmacokinetics of gemcitabine was described by all the above parameters; for dFdU only Cmax and AUCexp have been calculated according to the sampling period performed (until 4 hours after the completion of the infusion) and the documented terminal half life of the metabolite, reported to be >10 h [6].
Statistical Analysis
Summary statistics are presented as mean, standard deviation, coefficient of variation, median and range or frequency for descriptive purposes. Differences between cohort I and II were analyzed with analysis of variance (ANOVA) for continuous variables at the 1st cycle. The normality assumptions for ANOVA were assessed with the tests available. If the normality assumption was violated, the Mann-Whitney U non-parametric test was used. Paired t tests were used to compare Cmax, AUCexp, AUCinf, t1/2, clearance and K at different time for a given group; the same test was employed to compare PK parameters among patients experiencing different grades of toxicity. A t student test has been also performed using Cmax, AUC and clearance of gemcitabine and Cmax and AUCexp of dFdU in order to compare patients experiencing toxicities ≥ grade 3 with patients experiencing toxicities ≥ grade2. A repeated measures ANOVA
for all PK parameters using patient, cohort and cycle factors as variables has been performed. The Kaplan-Meier method was used to calculate overall survival and progression-free survival, reported with their 95% confidence interval. All analyses were done with SPSS 11.0.
RESULTS
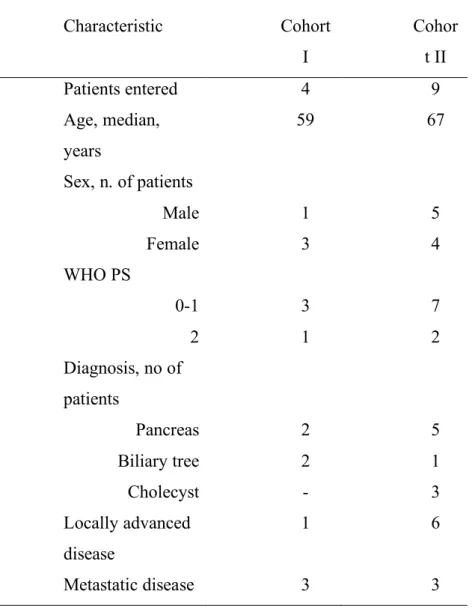
Thirteen patients were enrolled into this study; all of them were assessable for toxicity and pharmacokinetic analysis at cycle one. The characteristics of the 13 patients are listed in Table 1. Seven of them were females and the median age was 63 years (range, 27 to 75 years). Seven patients had locally advanced or metastatic pancreatic adenocarcinoma, three had biliary tree carcinoma and the remainder three presented advanced gallbladder adenocarcinoma. None of them received prior chemo- or radiotherapy, and liver was the major site of metastatic disease. The median ECOG performance status was 1 (range 0-2). Four patients had normal hepatic function with serum bilirubin <1.6 mg/dl, and AST, ALT <2 upper normal limit (UNL (cohort I); nine patients had hepatic dysfunction with serum bilirubin >1.6 mg/dl, and/or AST, ALT >2 UNL (cohort II). All patients received gemcitabine 1000 mg/m2/min at FDR days 1,8,15 every 4 weeks. One patient in the control arm had a 25% dose reduction at the second cycle due to hematological toxicity, while two patients in the experimental arm never started the second cycle, one for disseminated intravascular coagulation (DIC) after the first cycle and the other for deterioration of general conditions (rapid worsening of his performance status). The baseline laboratory parameters are listed in Table 2. The only statistical significant difference in the baseline laboratory values between the two cohorts was in two hepatic function parameters, total bilirubin level (p=0,04) and AST level (p=0,01), whereas no significant difference was observed for ALT level (p=0,16) and for all other blood parameters reported on Table 2. Only the total bilirubin level had statistical significant decrease from the first to the second cycle in cohort II (5,29 mg/dl vs 1,90 mg/dl, p= 0.03), while all other laboratory values had comparable means between the first two cycles in both groups of patients.
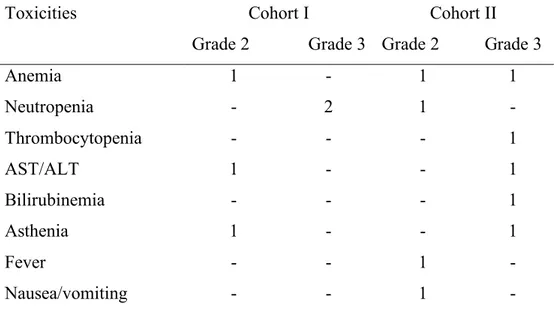
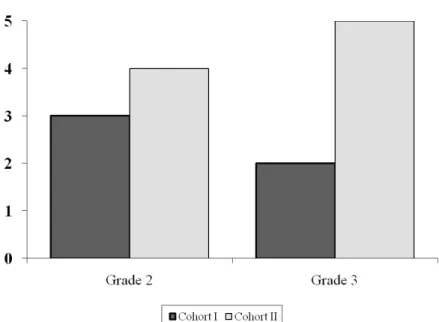
The main toxicities were reported after the first cycle and detailed on Table 3. Although more patients in cohort II experienced grade 3 toxicities, this difference did not result to be statistically significant (figure 3); moreover, patient with bilirubin and/or transaminases elevation did not require dose reduction of gemcitabine. Even though no patient experienced grade 4 toxicity, hematological toxicity represented the major side effect. Two patients experienced grade 3 neutropenia in the control arm, one patient grade 3 thrombocytopenia and one patient grade 3 anemia in the cohort II. Laboratory toxicities were low in both groups, although two episodes of transient grade 3 elevation in serum bilirubin and transaminases from baseline values were seen in one patient in cohort II. Other toxicities concerned mainly asthenia and fever. The mean decrease of neutrophils from baseline to the value at the nadir during the first cycle was 24.6% (SD 58,1) in cohort I and 53% (SD 26,6) in cohort II
All patients met criteria for measurable disease; one complete response was observed in the control group, three patients had partial response, two stable disease and six patients experienced progressive disease. One patient was not evaluable for response due to a serious adverse event (DIC) after the first cycle. At a median follow-up of 19 weeks (1- 167) the median progression-free survival was 15 weeks (95% C.I. 9-22) and the median overall survival was 20 weeks (95% C.I. 12-50).
Pharmacokinetic Results
Pharmacokinetic analysis was performed on 13 patients at the first cycle and on 9 of the 11 patients receiving the second cycle. Two of the patients never started the second cycle due to adverse events. All patients were studied at dose of 1000 mg/m2 at the fixed dose rate infusion of 10 mg/m2 per minute (FDR). Patients in cohort I had normal hepatic function (serum bilirubin <1.6 mg/dl, and AST, ALT <2 UNL), and patients in
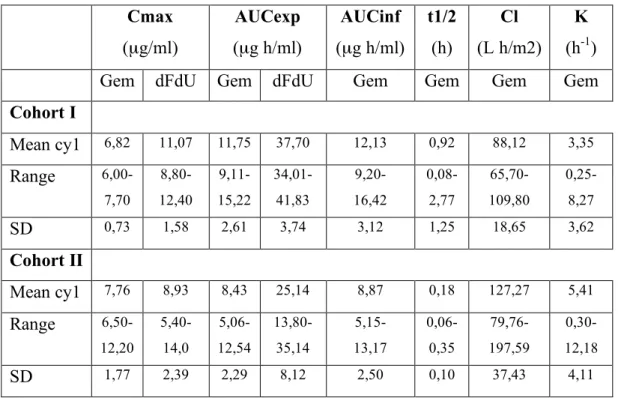
normal or impaired hepatic function, the maximum gemcitabine concentration was similar in the two groups: 6.83 µg/ml (± 0.73) and 7.76 µg/ml (± 1.77) respectively (figure 4). The variability in peak plasma concentration was not very high, ranging from 6.0 to 7.7 µl/ml for gemcitabine and from 6.5 to 12.2 µl/ml for dFdU (Figure 3). The peak plasma concentration of dFdU was measured in all patients at the end of gemcitabine infusion (after 100 minutes from the start of infusion) or after 5 minutes from the end of infusion. After the end of fixed-rate infusion, the plasma concentration of gemcitabine declined rapidly in all patients (figure 5). The overall mean clearance (± SD) of gemcitabine was 88.12 (± 18.65) and 127.27 (± 37.43) L h/m2 in cohort I and II respectively, with no significant difference between the two groups (figure 6). No relationship was found between serum bilirubin concentration and gemcitabine clearance (figure 7). A regression analysis performed also for other variables of hepatic function (transaminases, alkaline phosphatase, PT, PTT) did not show any statistically significant result. The mean of expected total area under the plasma concentration-time curve for gemcitabine was higher in patients with normal hepatic function (11.75 µg*h/ml) than in patients with impaired liver function (8.43 µg*h/ml), and the difference was statistically significant (p=0.04). When the area under the plasma concentration-time curve of gemcitabine was extrapolated from zero to infinite, the mean values results 12.13 µg*h/ml and 8.87 µg*h/ml for cohort I and II, respectively (p=0.07). The mean of dFdU AUCexp for cohort I was 37.70 µg*h/ml and for cohort II was 25.14 µg*h/ml; the difference between the two AUC values was statistically significant, p=0.01. There were no significant differences in the terminal half-life of gemcitabine in both cohorts. Similarly, there were no significant differences among the cohorts in the elimination rate constant for gemcitabine (3.35 h-1 in control group and 5.41 h-1 in patients with altered liver function).
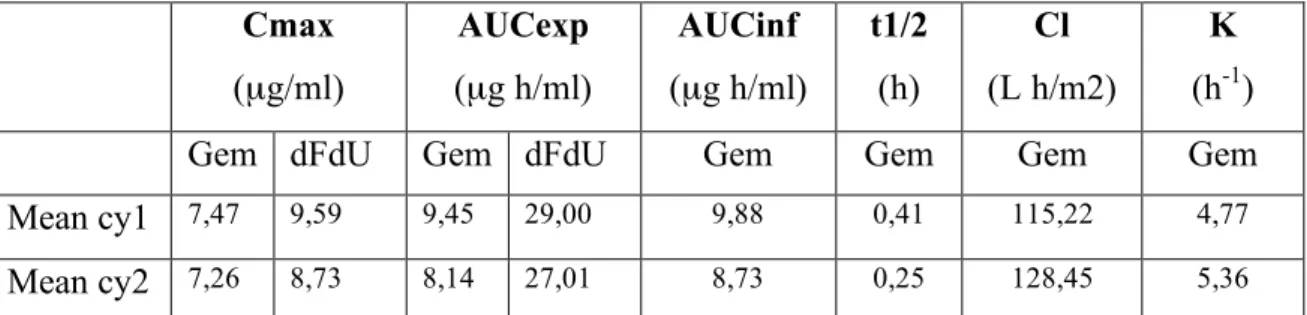
In 9 patients the pharmacokinetic analysis was performed also at the second cycle, in order to evaluate the variability of the PK parameters in two consecutive cycles. No
statistical difference was verified for all the parameters analyzed between cycle 1 and cycle 2 in the two groups (Table 5). The data of gemcitabine clearance at cycle 1 and 2 are reported in figure 8.
Finally we investigated whether pharmacokinetic alterations could be associated with any altered toxicity profile. We identified four patients with grade ≥3 myelotoxicity, two in the control arm and two in the experimental arm; only one patient in cohort II had grade ≥3 hyperbiliribinemia. The Cmax of dFdU resulted significantly higher (p=0.02) in patients with grade 3 hematological toxicity. The patient with hepatic side effects presented an higher dFdU AUCexp value when compared with all the other patients in the same cohort (34.63 µg*h/ml vs 28.5 µg*h/ml, p=0.046), a lower gemcitabine AUCexp (5.06 µg*h/ml vs 9.82 µg*h/ml, p<0.0001), and AUCinf (5.15 µg*h/ml vs 10.27µg*h/ml , p<0.0001); furthermore, the gemcitabine clearance was 197.59 L h/m2 in this patient and 108.36 L h/m2 in other patients of cohort II (p<0.0001). A graphic distribution of the ratio of gemcitabine and dFdU AUCexp, underlying patients that experienced grade 3 adverse events, is illustrated in figure 9.
DISCUSSION
The pharmacokinetics and the toxicity profile of chemotherapeutic agents are usually evaluated in phase I studies and in patients with normal organ function. This methodology precludes the possibility to evaluate specific dose recommendations in patients with organ dysfunctions. Gemcitabine is a drug with a broad spectrum of activity and a favorable toxicity profile. Literature data reported an increased incidence of transient hepatic toxicity in patients with liver metastases [19] and a phase I escalation study of gemcitabine over 30 minutes recommend to reduce the dose to 800 mg/m2 in patients with elevated bilirubin level [19].
Gemcitabine infusion at the FDR of 10 mg/m2/min has been demonstrated to maximize the rate of triphosphate accumulation, its major intracellular metabolite [10,11]. Despite this robust pharmacological data, several phase II and III studies comparing different doses of gemcitabine in standard 30 minutes and FDR infusion, have failed to demonstrate a substantial clinical benefit for the main outcome.
Based on these data, we were interested in evaluating the hepatic toxicity of gemcitabine at FDR infusion in patients already affected by impaired liver function. This is a frequent condition in patients with pancreatic and biliary tree carcinoma: hepatic function is compromised directly by cancer. We decided to use gemcitabine at 1000 mg/m2 in patients with pancreatic and biliary tree carcinoma, based on a current lack of evidence that clinical gemcitabine activity is improved by increasing its dose [24].
Although the limited number of patients included in this series, based on our clinical and pharmacokinetics results, we do not recommend to start gemcitabine with a reduced dose in patients with impaired liver function. In fact, we observed grade 3 myelosuppression either in patients with normal or altered hepatic function and a slight
increased incidence of non-hematological toxicity in patients with hepatic dysfunction. All toxicities occurred were manageable and patients experienced grade 3 side effects in cohort II did not require dose adjustment. The only dose reduction was performed in a patient with normal hepatic function.
The pharmacokinetic analysis shows no significant difference for Cmax, CL and t1/2 between the two cohorts, but reveals a significant low AUCexp for gemcitabine and dFdU in patients with impaired liver function when compared to control group. Although the sample size is too small to confirm or refuse a meaningful difference of this parameter, the overall drug exposition is lower in patients with hepatic dysfunction.
Another aim of this study was to verify and confirm the repeatability of the pharmacokinetic parameters analyzed within the same patient in two different cycles. For all the variables analyzed, no one appears significantly different from cycle 1 to cycle 2.
Finally, we investigated whether patients with increased toxicity, compared with patients with a better tolerability, presented a different pharmacokinetic disposition of gemcitabine and/or dFdU. Actually, our analysis failed to reveal a statistically significant difference in the pharmacokinetics of both agents in patients with altered toxicity profile (≥ grade 3) when compared with patients with grade 1-2 toxicities. Moreover, we have not identified a PK parameter that correlate with a pharmacodynamic outcome, such as myelosuppression.
More accurate relationship between toxicity and gemcitabine disposition should be provided testing the pharmacokinetics of the triphosphate metabolite. In fact, gemcitabine is not the active drug but a pro-drug that requires a series of activations to be transformed into its triphosphate form. In addition, the correlation between plasma [25].
are not related with an high grade of toxicity; on the contrary, more side effects are proved for FDR infusion when compared with standard treatment. This data could be the clinical confirmation of the activity of gemcitabine triphosphate and of its saturable mechanism of accumulation into cells. Recently Grimson et al. demonstrated that, irrespective of the dose rate administered, the gemcitabine triphosphate was increase in the second week infusion. Authors hypothesize that the autoinduction of the active form was due to an increase in the threshold of the saturation mechanism. This means that the benefit of the FDR infusion is overestimated in studies analyzing the PK data only at cycle 1. This observation can be a possible explanation way the biological advantage of the dFdCTP accumulation in the FDR infusion is not really translated in a clinical advantage. Our study analyzes the gemcitabine disposition also at cycle 2, and although the dFdCTP was not measured, the differences of dFdC and dFdU between the two cycles were not statistically significant. This may also be explained by the weak relationship between plasma gemcitabine levels and its triphosphate form, as was recently published [16].
A limit of this study is the lack of the triphosphate dosage, but all studies dosing the gemcitabine active form have the caveat that the cellular pharmacokinetic data are obtained from a surrogate tissue (circulating PBMCs) rather that from the target solid tumor tissue. It is technically challenging to design a study capable of measuring the dose of the active metabolite and the levels of enzymes involved in the metabolic pathway of gemcitabine.
Only one patient, in our study, presented a transient elevation of bilirubin and transaminases in cohort II. This singular evidence is not enough to confirm the transient hepatic toxicity observed in the Tempero’s study [13] in the FDR arm, and the reason of the temporary hepatic dysfunction remains unclear. The analysis of the gemcitabine and dFdU disposition in this specific patient revealed, compared with all other patients included, a significant lower gemcitabine AUC, and an higher
gemcitabine clearance. We are unable to extrapolate this information from the only case observed, but we are currently analyzing other patients with transient hepatic toxicity in order to confirm this data.
It is difficult to compare our PK data with the PK data of gemcitabine reported in the literature, due to the different doses and time of infusion employed. Soo et al [26] reported the results of gemcitabine administered at 1000 mg/m2 in 30 minutes infusion and at 750 mg/m2 in 75 minutes infusions combined with carboplatin. We combined our data concerning the clearance of gemcitabine with the data presented by Soo (figure 10). The mean clearance of our patients in both cohorts is lower of that reported by Soo, but the PK results reported in literature are very variable.
Our results seem to exclude a possible increased toxicity of gemcitabine when administered at FDR infusion in patients with impaired hepatic function, and the dose of 1000 mg/m2 can be administered with no additional toxicities. Nevertheless, we believe that patients with organ dysfunction do require specific studies to verify the correct drug dose and tolerability. These data can not be extrapolated from conventional phase I trials and deserve further specifically designed investigations.
REFERENCES
1. Stadler WM, Kuzel T, Roth B, et al: Phase II study of single-agent gemcitabine in previously untreated patients with metastatic urothelial cancer. J Clin Oncol 1997;15: 3394-3398
2. Moore MJ, Tannock IF, Ernst DS, et al: Gemcitabine: A promising new agent in the treatment of advanced urothelial cancer. J Clin Oncol 1997;15: 3441-3445
3. Fabi A., Mirri A., Felici A., et al.: Fixed dose-rate gemcitabine as radiosensitizer for newly diagnosed glioblastoma: a dose-finding study. J Neurooncol. 2008 87(1): 79-84 4. Heinemann V, Hertel LW, Grindey GB, Plunkett W: Comparison of the cellular
pharmacokinetics and toxicity of 2',2'-diflurodeoxycitidine and 1β-D-arabinofuranosylcytosine. Cancer Res 1988;48: 4024-4031
5. Grunewald R, Kantarjian H, Keating MJ, et al. Pharmacologically directed design of the dose rate and schedule of 2,2-diflouorodeoxycytidineadministration in leukaemia, Cancer Res 1990;50: 6823-6826
6. Abbruzzese JL, Grunewald R, Weeks EA, et al: A phase I clinical, plasma and cellular pharmacology study of Gemcitabine. J Clin Oncol 1991;9:491-498
7. Von Hoff DD.: Activity of gemcitabine in a human tumor cloning assay as a basis for clinical trials with Gemcitabine: San Antonio Drug Development Team. Invest New Drugs 1996 14:265-270
8. Heinemann V, Xu YZ, Chubb S, et al: Inhibition of ribonucleotide reduction in CCRF-CEM cells by 2,2-diflouorodeoxycytidine. Mol Pharmacol 1990;38:567-572
9. Gandhi V.: Questions about gemcitabine dose rate: answered or unanswered? J Clin Oncol 2007;25(36): 5691-5694
10. Grunewald R, Abbruzzese JL, Tarassoff P, et al: Saturation of 2',2'-difluorodeoxycytidine 5'-triphosphate accumulation by mononuclear cells during a phase I trial of Gemcitabine. Cancer Chemother Pharmacol 1991;27:258-262
11. Grunewald R, Kantarjian H, Du M, et al. Gemcitabine in leukaemia: A phase I clinical, plasma, and cellular pharmacology study of gemcitabine. J Clin Oncol. 1991;9:491-498 12. Brand R, Capadano M, Tempero M. A phase I trial of weekly Gemcitabine
administered as a prolonged infusion in patients with pancreatic cancer and other solid tumors. Invest New Drugs 1997;15:331–341
13. Tempero M., Plunkett W., Ruiz Van Haperen V., Hainsworth J., Hochester H., Lenzi R., Abbruzzese J. Randomized Phase II Comparison Of Dose Intense Gemcitabine: Thirty Minute Infusion And Fixed Dose Rate Infusion In Patients With Pancreatic Adenocarcinoma. J Clin Oncol. 2003;21: 3402-8
14. Cattel L., Airoldi M., Delprino L., et al.: Pharmacokinetic evaluation of gemcitabine and 2’,2’-difluorodeoxycytidine-5’-triphosphate after prolonged infusion in patients affected by different solid tumors. Annals Oncology 2006: 17 (Supp 5).v142-147 15. Patel SR, Gandhi V, Jenkins J, et al. Phase II clinical investigation of Gemcitabine in
advanced soft tissue sarcomas and window evaluation of dose rate on Gemcitabine triphosphate accumulation. J Clin Oncol 2001;19:3483–3489
16. Grimison P., Galettis P., Manners S., et al.: Randomized crossover study evaluating the effect of gemcitabine infusion rate: evidence of autoinduction of gemcitabine accumulation. J Clin Oncol 2007;25(36): 5704-5709
17. Ceribelli A., Gridelli C., De Marinis F, et al.: Prolonged gemcitabine infusion in advanced non-small cell lung carcinoma: a randomized phase II study of two different schedules in combination with cisplatin. Cancer 2003 98:337-343
18. Poplin E., Feng Y., Berlin J., et al.: Phase III randomized study with gemcitabine and oxaliplatin versus gemcitabine (fixed-dose rate infusion) compared with gemcitabine
(30-minutes infusion) in patient with pancreatic carcinoma E6201: a trial of the Eastern Cooperative Oncology Group. J Clin Oncol 2009 27(23)3778
19. Venook A,. Egorin M J, Rosner G, Hollis D, Mani S, Hawkins M, Byrd J, Hohl R, Budman D, Meropol N.J, Ratain MJ Phase I and Pharmacokinetic Trial of Gemcitabine in Patients With Hepatic or Renal Dysfunction: Cancer and Leukemia Group B 9565; J Clin Oncol. 2000;18:2780-2787
20. Therasse P, Arbuck SG, Eisenhauer EA, Wanders J, Kaplan RS, Rubinstein L, Verweij J, Van Glabbeke M, van Oosterom AT, Christian MC, Gwyther SG. New guidelines to evaluate the response to treatment in solid tumors. European Organization for Research and Treatment of Cancer, National Cancer Institute of the United States, National Cancer Institute of Canada. J Natl Cancer Inst. 2000;92(3):205-16
21. Sottani C, Massimo Zucchetti M, Zaffaroni M et al.:Validated procedure for simultaneous trace leveldetermination of the anti-cancer agent gemcitabine and its metabolite in human urine by high-performance liquid chromatography with tandem mass spectrometry. Rapid Commun. Mass Spectrom 2004;18:1017-1023
22. Fogli S., Danesi R., Gennai A., Donati S., Conte P.F., Del Tacca M. Gemcitabine, epirubicin and paclitaxel: pharmacokinetic and pharmacodynamic interactions in advanced breast cancer. Ann Oncol. 2002;13(6):919-27
23. Sessa C., Aamdal S., Wolff I., et al.: Gemcitabine in patients with advanced malignant melanoma or gastric cancer: Phase II studies of the EORTC Early Clinical Trias group. Ann Oncol 1994;5: 471-472
24. Gelibter A., Malaguti P., Di Cosimo S., et al.: Fixed dose-rate gemcitabine infusion as first-line treatment for advanced-stage carcinoma of the pancreas and biliary tree. Cancer. 2005;104(6): 1237-1245
25. Fossella F.V., Lippman S.M., Shin D.M., et al.: Maximum-tolerated dose defined for single-agent gemcitabine: A phase I dose.escalation study in chemotherapy-naïve patients with advanced non-small-cell-lung cancer. J Clin Oncol 1997;15:310-316
26. Soo R.A., Wang L.Z., Tham L.A., et al.: A multicenter randomized phase II study of carboplatin I combination with gemcitabine at standard rate or fixed dose rate infusion in patients with advanced stage non-small cell lung cancer. Ann Oncol 2006; 17(7): 1128-33.
Data presented above have been published in Clin Phatmacokinetic 2009;48(2):131-41 (Pharmacokinetics of gemcitabine at fixed dose rate infusion in patients with normal and impaired hepatic function; Felici A., Di Segni S., Milella M., Colantonio S., Sperduti I., Nuvoli B., Contestabile M., Sacconi A, Zaratti M., Citro G., Cognetti F.)
Table 1. Patient Characteristic Characteristic Cohort I Cohor t II Patients entered 4 9 Age, median, years 59 67 Sex, n. of patients Male 1 5 Female 3 4 WHO PS 0-1 3 7 2 1 2 Diagnosis, no of patients Pancreas 2 5 Biliary tree 2 1 Cholecyst - 3 Locally advanced disease 1 6 Metastatic disease 3 3
Table 2. Baseline Laboratory Values Parameters Cohort I Mean (±SD) Range Cohort II Mean (±SD) Range WBC count, x103cells/µL 6,27 (2,06) 4,81-9,30 11,86 (7,08) 5,90- 28,00 PLT count, x103cells/µL 159,000 (65,15) 96,000-236,000 369,000 (232,55) 146,000-775,000 Hgb, g/dL 11,7 (1,91) 10,3- 14,5 11,16 (1,43) 9,3- 14,0
Total bilirubin level, mg/dl 0,80 (0,35) 0,55-1,33 5,29 (3,83) 0,66-14,24
Direct bilirubin level, mg/dl 0,39 (0,39) 0,15- 0,85 2,58 (1,41) 0,22-4,52
AST level, U/L 32 (14) 16- 46 70 (48) 23- 168
ALT level, U/L 39 (18) 17-62 92 (32) 43-134
AP level, U/L 710 (487) 365-1055 1278 (625) 420-2258
Creatinine level, mg/dl 0,72 (0,08) 0,66-0,85 0,73 (0,35) 0,05-1,21
Total protein, g/dl 6,50 (0,60) 6,10-7,20 6,58 (0,72) 5,10-7,50
PT time, % 99 (6,4) 95-107 97 (9,8) 86-115
PTT, time, sec 31 (2,6) 29-34 32 (4,2) 28-41
Abbreviations: WBC: white blood cells; PLT: platelet; AST: aspartate transaminase; ALT: alanine transaminase; AP: alkaline phosphatase; PT: prothrombin time; PTT: partial thromboplatin time; SD: standard deviation
Table 3. Toxicity Summary (n. of toxicities) Toxicities Cohort I Grade 2 Grade 3 Cohort II Grade 2 Grade 3 Anemia 1 - 1 1 Neutropenia - 2 1 - Thrombocytopenia - - - 1 AST/ALT 1 - - 1 Bilirubinemia - - - 1 Asthenia 1 - - 1 Fever - - 1 - Nausea/vomiting - - 1 -
Table 4. Pharmacokinetic results Cmax (µg/ml) AUCexp (µg h/ml) AUCinf (µg h/ml) t1/2 (h) Cl (L h/m2) K (h-1)
Gem dFdU Gem dFdU Gem Gem Gem Gem
Cohort I Mean cy1 6,82 11,07 11,75 37,70 12,13 0,92 88,12 3,35 Range 6,00-7,70 8,80-12,40 9,11-15,22 34,01-41,83 9,20- 16,42 0,08-2,77 65,70-109,80 0,25-8,27 SD 0,73 1,58 2,61 3,74 3,12 1,25 18,65 3,62 Cohort II Mean cy1 7,76 8,93 8,43 25,14 8,87 0,18 127,27 5,41 Range 6,50-12,20 5,40-14,0 5,06-12,54 13,80-35,14 5,15- 13,17 0,06-0,35 79,76-197,59 0,30-12,18 SD 1,77 2,39 2,29 8,12 2,50 0,10 37,43 4,11
Cmax: plasmatic peak concentration; AUCexp: experimental area under the plasma concentration-time curve; AUCinf: infinite area under the plasma concentration-concentration-time curve; t1/2:terminal half
Table 5. Total pharmacokinetic results at cycle I and cycle II Cmax (µg/ml) AUCexp (µg h/ml) AUCinf (µg h/ml) t1/2 (h) Cl (L h/m2) K (h-1)
Gem dFdU Gem dFdU Gem Gem Gem Gem
Mean cy1 7,47 9,59 9,45 29,00 9,88 0,41 115,22 4,77
Mean cy2 7,26 8,73 8,14 27,01 8,73 0,25 128,45 5,36 Cmax: plasmatic peak concentration; AUCexp: experimental area under the plasma concentration-time curve; AUCinf: infinite area under the plasma concentration-concentration-time curve; t1/2: terminal
Figure 4. The maximum concentration (Cmax) of gemcitabine (dFdC) and its metabolite (dFdU) in cohort I and II
Figure 5. Plasma concentration-time profile of gemcitabine (dFdC) (a) and of dFdU (b) at the first cycle in patient with normal hepatic function (cohort I) and in patients with altered hepatic function (cohort II)
Figure 6. Gemcitabine clearance in patients with normal (cohort I) and impaired (cohort II) liver function
Figure 7. Regression of dFdC (gemcitabine) and dFdU clearance as function of total bilirubin
Figure 8. Interpatient variability: gemcitabine clearance of patients performing pharmacokinetics at cycle 1 and 2
Figure 9. Ratio of gemcitabine and dFdU AUCexp. The black spots represents patients experiencing grade adverse events ≥ 3 in cohort I and II
Figure 10. Values of gemcitabine clearance administered at 1000 mg/m2 over 30 minutes infusion, 750 mg/m2 over 75 minutes infusion [22] , and 1000 mg/m2 over 100 minutes infusion