ALMA MATER STUDIORUM
UNIVERSIT `
A DEGLI STUDI DI BOLOGNA
Dipartimento di Fisica e Astronomia
Dottorato di ricerca in Astronomia
Ciclo XXIX
Tesi di Dottorato
The origin and fate of the multiphase circumgalactic medium of disc
galaxies using high-resolution hydrodynamical simulations
CANDIDATO: RELATORE:
Lucia Armillotta Prof. Filippo Fraternali
CO-RELATORE: Dr. Federico Marinacci COORDINATORE: Prof. Francesco Rosario Ferraro
Esame finale anno 2016
Settore concorsuale: 02/C1 – Astronomia, Astrofisica, Fisica della Terra e dei Pianeti Settore scientifico-disciplinare: FIS/05 – Astronomia e Astrofisica
Contents
Contents iii
1 Introduction 1
1.1 Halo gas in disc galaxies . . . 2
1.1.1 Cold neutral gas . . . 2
1.1.2 Cold ionized gas . . . 6
1.1.3 Warm gas . . . 8
1.1.4 Hot gas . . . 9
1.2 Origin of the halo gas . . . 11
1.2.1 Accretion from IGM . . . 11
1.2.2 Satellite Accretion . . . 12
1.2.3 Feedback . . . 13
1.3 Gas accretion and feeding of star formation . . . 14
1.3.1 Disc-corona interface . . . 16
1.4 This thesis . . . 19
2 The origin of the HVC Complex C 21 2.1 Introduction . . . 21
2.2 Method . . . 23
2.2.1 Dynamical model . . . 23
2.2.2 Hydrodynamical simulation . . . 26
2.3 Results . . . 28
2.3.1 The metallicity of Complex C . . . 31
2.4 Technical Discussion . . . 34
2.5 Discussion and Conclusions . . . 37
3 Implementation of new physics modules in ATHENA 41 3.1 Introduction . . . 41
3.3 Structure of ATHENA . . . 44
3.3.1 Reconstruction method . . . 46
3.3.2 Riemann solver . . . 47
3.4 Radiative cooling and heating . . . 48
3.4.1 Collisional ionization equilibrium . . . 49
3.4.2 Photoionization and collisional ionization . . . 51
3.5 Thermal Conduction . . . 54
3.5.1 Analytic theory . . . 55
3.5.2 Including thermal conduction in ATHENA . . . 57
3.5.3 Testing the algorithm . . . 61
4 Efficiency of gas cooling and accretion at the disc-corona interface 67 4.1 Introduction . . . 67
4.2 Numerical simulations . . . 69
4.2.1 Thermal Conduction . . . 72
4.3 Results . . . 73
4.3.1 Thermal conduction effects at Tcor = 2 × 10⁶K . . . 73
4.3.2 Condensation of coronal material . . . 75
4.3.3 Resolution . . . 77
4.3.4 Thermal conduction effects at different Tcor . . . 79
4.3.5 Condensation at different Tcor . . . 82
4.4 Discussion . . . 83
4.4.1 Limitations of our results . . . 83
4.4.2 Simulations including gravity . . . 86
4.4.3 Implications for gas accretion in disc galaxies . . . 88
4.5 Summary and conclusions . . . 91
5 Survival of gas clouds in the CGM of Milky Way-like galaxies 93 5.1 Introduction . . . 93
5.2 Hydrodynamical simulations . . . 95
5.2.1 The numerical scheme . . . 97
5.3 Results . . . 99
5.3.1 The role of thermal conduction . . . 102
5.3.2 Column densities: comparison with COS-Halos data . . . 103
5.4 Discussion . . . 107
5.5 Conclusions . . . 109
Contents v
6.1 Summary . . . 111
6.2 Gas feeding in disc galaxies . . . 114
6.2.1 Disc-corona interface . . . 114
6.2.2 Gas from the Circumgalactic Medium . . . 116
Bibliography 119
1
Chapter
Introduction
In recent years, sensitive observations have revealed the presence of multiphase gas in the halo regions of low-redshift disc galaxies. This multiphase halo gas, also called circumgalactic medium (CGM), is explained by the existence of flows of gas towards and away from galaxies, showing a strong connection between discs of star-forming galaxies and their baryon-rich intergalactic surroundings. Thus, the study of the gaseous haloes is of fundamental importance to understand how galaxies evolve in their environment.
In this Introduction, we list the main observational properties of the gaseous haloes of nearby disc galaxies and of the Milky Way (Sec. 1.1) and we illustrate the main theoretical ideas concerning their origin (Sec.1.2). Finally, in Sec.1.3, we discuss the requirement of star-forming galaxies to accrete fresh gas to sustain their star formation at the current observed rates. Throughout this Thesis, we distinguish three different ranges of temperature:
• cool gas: gas at T < 105 K, both neutral and ionized (see Sec. 1.1.1 &1.1.2);
• warm gas: gas at 105 ≤ T ≤ 106 K (see Sec. 1.1.3);
• hot gas: gas at T > 106 K (see Sec.1.1.4);
Figure 1.1: Extra-planar gas in the edge-on nearby galaxy NGC 891 (adapted from Oosterloo, Fraternali & Sancisi, 2007). Left panel : total Hi map (blue) overlaid on the optical image (orange). Contours are at 0.1, 0.2, 0.5, 1 × 1020cm−2 in Hi column density.
Right panel : Hi rotation curves, the dotted/dashed lines show the rotation curves at different heights from the disc, while the solid line shows the rotation curve in the plane.
to refer to the gaseous environments surrounding low-redshift disc galaxies out to the virial radius (∼ 230 kpc for the Milky Way). Instead, we use the term extra-planar gas to refer to gas close to the galactic disc (within a few kpc above it), mainly observed through Hi and Hα emission.
1.1
Halo gas in disc galaxies
1.1.1 Cold neutral gas
The cold neutral phase is composed by gas at temperature . 104 K and it is mainly
detected through the 21-cm emission line of the neutral hydrogen (Hi). Thick layers of extra-planar neutral gas have been revealed around the Milky Way and several nearby spiral galaxies (Sancisi et al., 2008). Hi observations of edge-on galaxies,
where the halo emission can be easily separated from disc emission, have shown that ∼ 10 − 25 % of the Hi content associated to these galaxies is generally located at distances from a few to ∼ 10 kpc from the galactic plane (e.g. Swaters, Sancisi & van der Hulst,1997; Matthews & Wood,2003). Fig.1.1 shows the Hi emission map
of the outstanding case of NGC 891. The extra-planar layer of this galaxy comprises ∼ 30% of the total Hi mass (Oosterloo, Fraternali & Sancisi, 2007).
Overall, the extra-planar Hi kinematics is quite regular: it rotates more slowly than the neutral gas component within the thin disc and its rotational velocity de-creases with increasing height above the galactic plane. A vertical velocity gradient
1.1. Halo gas in disc galaxies 3
of ∼ 15 − 30 km s−1 kpc−1 has been measured in a significant number of spiral galaxies, including the Milky Way (e.g. Fraternali et al., 2002; Heald et al., 2007; Oosterloo, Fraternali & Sancisi, 2007; Zschaechner et al., 2011). The right panel of Fig. 1.1 shows the Hi rotation curves derived at different heights from the disc
of NGC 891. The extra-planar Hi also shows the presence of non-circular motions and in particular a possible large-scale radial inflow (Fraternali et al., 2001). Most of this gas is thought to be produced by the so-called ‘galactic fountain’, i.e. gas ejected from the disc by stellar feedback (Bregman,1980; Houck & Bregman,1990), that travels through the halo and eventually falls back to the disc in a time-scale of ∼ 80 − 100 Myr.
In the Milky Way, deep and high-resolution observations has allowed to reveal extra-planar Hi in the form of anomalous clouds, the so-called ‘High-Velocity Clouds’ (HVCs) (e.g. Muller, Oort & Raimond,1963; Wakker,1991; Wakker & van Woerden,
1997). HVCs are defined as Hi clouds whose velocities in the local standard of
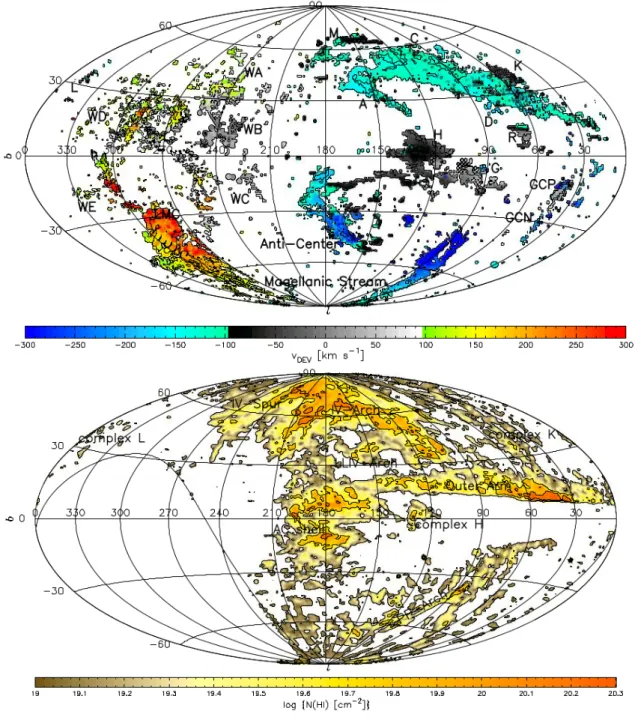
rest deviate by more than ∼ 90 km s−1 from the speed predicted by a differentially rotating thin disc (Wakker, 1991). The top panel of Fig. 1.2 shows the all-sky map of the HVCs around the Milky Way. The extended structures indicate the high-velocity complexes. Each complex is composed by clouds of different sizes, related by the same spatial and kinematic proximity (Hsu et al., 2011; Putman, Peek & Joung, 2012). Beyond the largest HVCs, there is a large amount of small clouds called ‘compact HVCs’. The sky at negative latitudes is dominated by the HVC Magellanic Stream (MS) and its leading arm (Complexes WE and WD in the top panel of Fig. 1.2). These structures originated from the interaction between two satellite dwarf galaxies, Large Magellanic Cloud (LMC, visible in Fig.1.2) and Small Magellanic Cloud (SMC), and the Milky Way.
The knowledge of the distances of the HVCs is very important to derive their physical properties and, in particular, their masses. The best method to estimate the distance of a HVC is to use halo stars of known distances in the direction of the cloud and search for absorption lines at the velocity of the HVC in the star’s spectrum. The presence or absence of absorption lines indicates that the cloud is in front of or behind the star. Recent works have revealed that the HVCs are located at typical distances . 10 kpc from the Sun (e.g Wakker et al.,2007; Thom et al., 2008), except the MS, situated in a range of distances of ∼ 50 − 200 kpc (Putman, Peek & Joung,2012). Their metallicities are subsolar, between 0.1 and 0.4 Z (Wakker,
2001), which supports the idea of an extragalactic origin for these clouds. The Hi
masses of the HVCs complexes are in the range of 105− 5 × 10⁶M
(Putman, Peek
& Joung, 2012), except for Complex C with a mass of ∼ 107M (Wakker et al.,
2007).
In nearby galaxies, Hi halo clouds are very hard to detect in Hi emission because of their low column densities. For instance, the typical Hi column density, NHI, in
Figure 1.2: Aitoff projection all-sky map of the HVCs (top panel ) and the IVCs (bottom panel ) of the Milky Way (from van Woerden et al., 2004). Top panel : contours are at 2 and 20 × 1018 cm−2 in Hi column density, while colors show deviation velocities, vDEV,
which is the difference between the observed velocity in the local standard of rest and the highest line-of-sight velocity predicted by a rotating disc model (Wakker, 1991). Bottom panel : contours are at 1, 5 and 12 × 1019cm−2 in Hi column density.
1.1. Halo gas in disc galaxies 5
Figure 1.3: Aitoff projection all-sky map of the Hi halo of the Milky Way including both HVCs and IVCs (from Marasco & Fraternali,2011). This Hi map was obtained from the LAB Survey after removing the disk emission, the Magellanic Clouds, the Magellanic Stream and the Outer Arm (Hi warp of the Milky Way’s disc). Contours are at 0.5, 10, 50 and 120 × 1018 cm−2 in Hi column density.
the disc is ∼ 1021 cm−2, while in the halo (extra-planar) region is ∼ 1019−20 cm−2. High-resolution observations of nearby galaxies often have a sensitivity of ∼ 1020
cm−2, which is close to the maximum Hi column density of the Milky-Way’s HVCs. However, two galaxies have been mapped out to column densities of ∼ 1018 cm−2,
they are M 31 (Thilker et al., 2004) and NGC 891 (Oosterloo, Fraternali & Sancisi,
2007). These galaxies show clouds with features similar to the HVCs in our Galaxy. In M 31, Hi clouds are located out to distances & 50 kpc from the disc (Lewis et al.,2013), with masses that range from few times 104 to 6 × 10⁵M
(Westmeier,
Braun & Thilker,2005). However, most of them are likely associated with the tidal interaction between M 31 and its massive satellite galaxy M 33 (Westmeier, Br¨uns & Kerp, 2008).
In addition to the HVCs, in the Milky Way, Hi observations have identified a population of cold clouds at the disc-halo interface, the so-called ‘Intermediate-Velocity Clouds’ (IVCs). They are distinguished from the HVCs both for their velocities, that, in the local standard of rest deviate by 35−90 km s−1 from the speed predicted by a differentially rotating thin disc, and for their solar-like metallicity, probing a possible internal origin (Wakker, 2001; van Woerden et al., 2004). The IVCs are located within ∼ 1 − 2 kpc from the Galactic disc, with masses in the range of 0.5 − 8 × 10⁵M
(Putman, Peek & Joung, 2012). The bottom panel of Fig. 1.2
shows an all-sky view of these clouds around the Milky Way. A large number of small and discrete Hi clouds with mass of ∼ 50 M have been identified in the lower
halo of our Galaxy, between 4 and 8 kpc from the Galactic centre (Lockman,2002; Ford, Lockman & McClure-Griffiths, 2010). These clouds extend to about 1 kpc above the disc and show kinematic features similar to the more massive IVCs (Saul et al.,2012).
Finally, Marasco & Fraternali (2011) showed that the IVCs and, to some extent the HVCs, are the local (Solar neighborhood) counterparts of a more diffuse medium that constitutes the extra-planar Hi layer of the Milky Way. This layer is analogous to that found in external galaxies (see Fig.1.1). To extract its properties, they used the Leiden-Argentine-Bonn Hi survey (LAB, Kalberla et al.,2005) and kinematically separated the extra-planar emission from the disc emission, also excluding the MS. They found that the extra-planar Hi covers the entire sky (see Fig. 1.3). Its total mass is of ∼ 3 × 10⁸M
(10% of the total Hi mass) and it shows a vertical rotational
gradient of ∼ 15 km s−1 kpc−1.
1.1.2 Cold ionized gas
Extra-planar cold ionized gas (T ∼ 104−5 K) has been observed through Hα
emis-sion lines and absorption lines of low/intermediate ionization elements against back-ground quasi-stellar objects (QSO).
Hα emission has been detected around several nearby edge-on spiral galaxies. This emission is usually concentrated in layers, called diffuse ionized gas (DIG) layers, extending up to ∼ 5 kpc from disc (Hoopes, Walterbos & Rand,1999; Collins & Rand, 2001). Several pieces of evidence indicate that these layers could be the ionized counterpart of the extra-planar Hi. Their extent scales with the galaxy’s SFR (Rossa & Dettmar, 2003), pointing to an internal origin of the extra-planar ionized gas. Moreover, the Hα kinematics is consistent with that of the extra-planar Hi, showing both a rotation lag, with a vertical gradient of ∼ 15 − 25 km s−1, similar to that observed in Hi (Heald et al.,2006,2007), and non-circular motions (Fraternali, Oosterloo & Sancisi,2004). Therefore, the DIG layers are likely the result of extra-planar Hi photoionized by stellar radiation of the disc, and, as for the neutral phase, most of this gas could be produced by galactic fountains.
In the Milky Way, the Hα emission observed within ∼ 1 − 2 kpc from the Galactic plane is known as the ‘Reynolds’ layer’ (Reynolds, 1991). This gas can be considered the counterpart of the Hi gas observed at the disc-halo interface in our Galaxy (see Sec. 1.1.1). Moreover, high-velocity Hα emission is also detected on top or near Hi HVCs (Putman, Peek & Joung, 2012). In some cases, as the MS, simple photoionization by stellar radiation is not sufficient to explain the particularly bright Hα emission (e.g., Putman et al.,2003) that must be contributed by collisional ionization mechanisms, due to the interaction between Hi clouds and the surrounding hot gas phase (e.g., Bland-Hawthorn et al.,2007).
1.1. Halo gas in disc galaxies 7
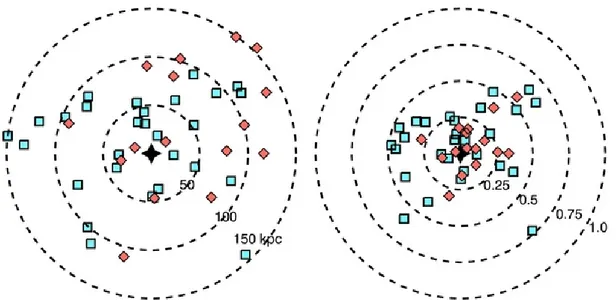
Figure 1.4: Distribution of Lyα absorptions on the sky with respect to the target galaxies (shifted to the center) (from Tumlinson et al., 2013). Star-forming galaxies are shown in blue, while passive galaxies are shown in red. Left panel : the radial coordinate is the physical distance projected on the sky (impact parameter) between each galaxy and its associated Lyα detection. Right panel : the radial coordinate is the ratio between the impact parameter and the virial radius of each galaxy, Rvir.
Besides the DIG, galaxies appear to be surrounded by a much more extended cold ionized circumgalactic medium (CGM). Both in the Milky Way and in other spiral galaxies, absorption line observations have allowed to detect lower column densities but at similar temperatures as the Hα emission. In the Milky Way, absorption lines of different low/intermediate ionization elements (e.g. Siii, Siiii, Cii, Ciii, Oi, Mgii), probing weakly ionized material, show a covering fraction close to 70 − 90% of the sky (Savage et al.,2003; Shull et al.,2009; Lehner et al.,2012). Some of these features are detected against halo stars showing that they are located within ∼ 15 kpc from the Sun. In several cases, as for the Hα emission, they are the ionized component of the Hi HVCs (e.g., Lehner & Howk, 2011).
Recently, the COS-Halos survey has constrained the physical properties of the CGM in nearby galaxies, both star-forming and passive, (Werk et al., 2012; Tum-linson et al.,2013), detecting gas through absorption lines against background QSO spectra for a sample of galaxies in the low-redshift (0.1 < z < 0.35) Universe. The picture that has emerged is that almost all galaxies, regardless of their morphologi-cal type, are surrounded by a cold and predominantly ionized gas component. Both Lyα absorbers and low/intermediate ionization elements (Cii, Ciii, Mgii, Siii, Siiii) have shown strong column densities out to impact parameters of 150 kpc from the galaxies and, for the star-forming galaxies, a covering fraction close to 100 % (see Fig.1.4, Tumlinson et al., 2013; Werk et al., 2013). Werk et al. (2013) estimated a total mass of cold gas (neutral + ionized) larger than 109 M within 150 kpc (limit
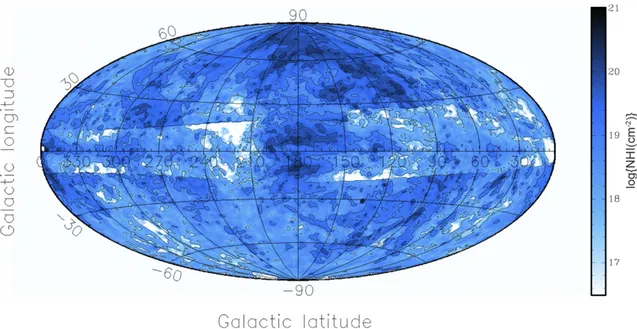
Figure 1.5: Milky Way: all-sky map of the high-velocity Ovi absorptions (large filled circles) overlapping the distribution of the Hi HVCs (from Sembach et al.,2003). The color of each circle indicates velocity on the same color scale used for the Hi emission. If more than one Ovi detection is present, the circle is split in more sections and the velocities are color-coded in each section of the circle. Small open circles indicate non-detections. The two crosses indicate the locations of two stellar sight lines in the sample.
of the survey) from galaxies. This value is approximately an order of magnitude higher than the mass estimated for cold gas in the Milky Way (estimated to be of the order of 108M
, Shull et al., 2009). This may be due to uncertainties in the
distances - and then in the masses - of the Milky Way features.
1.1.3 Warm gas
In the low-redshift CGM, a warmer gas phase (T ∼ 105−6 K) has been detected
through Ovi absorptions in QSO spectra. These features have a covering fraction of ∼ 70 − 80 % within 200-400 kpc from galaxies (Wakker & Savage,2009; Prochaska et al., 2011). Tumlinson et al. (2011), through the COS-Halos survey, found that the amount of Ovi around star-forming galaxies is larger than around galaxies with little or no star formation, suggesting that the lack of a warm gas halo could be related to the quenching of the star formation. As a consequence, only star-forming galaxies are surrounded by a large amount of both cold and warm gas (Tumlinson et al.,2011; Werk et al., 2013).
Ovi absorbers have also been observed around the Milky Way. However, in our Galaxy constraining the distances of these absorbers is hard. Fig. 1.5 shows Ovi
1.1. Halo gas in disc galaxies 9
detections overlapping the Hi map of the HVCs. It appears that the majority of the Ovi absorptions are in the spatial and kinematic vicinity of the Hi complexes. Two absorptions in Fig.1.5 have been detected towards halo stars, indicating that they are located within ∼ 15 kpc from the Sun (e.g., Sembach et al., 2003). Overall, a covering fraction larger than 60% on the sky has been found for our Galaxy (Sembach et al.,2003). Ionization models (e.g. CLOUDY, Ferland et al.,1998), that reproduce the observed ionized gas for all lines of sight, found that, while low/intermediate ionization elements largely represent material photoionized by stellar radiation from the disc, high ionization elements represent collisionally ionized material, due to the interaction between cold clouds and the hot corona of the Milky Way (e.g. Sembach et al., 2003; Fox et al., 2010). Marasco, Marinacci & Fraternali (2013) reproduced the observational finding of most of the cold/warm absorbers around the Milky Way through a model in which both warm and cold absorbers mainly originate from the interaction between cold fountain clouds and the hot medium.
1.1.4 Hot gas
On the basis of a combination of Big Bang nucleosynthesis theory and observations of the cosmic microwave background, it has been found that galaxies are missing a large fraction of the baryons that should be associated to their dark matter halos. It is widely accepted that most of the warm-hot component of these missing baryons resides in the haloes around galaxies (e.g., Komatsu et al., 2009; Shull, Smith & Danforth,2012). Thus, spiral galaxies, like our own Milky Way, should be embedded in hot gas atmospheres at virial temperature (T & 106 K), the so-called ‘coronae’,
extending out to hundreds of kpc from the galaxy centers (e.g., Fukugita & Peebles,
2006).
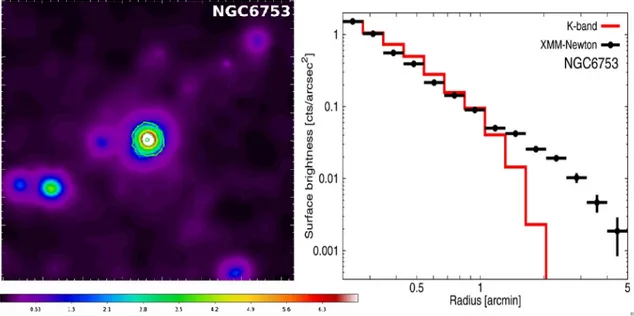
Unfortunately, the X-ray surface brightness of these coronae is close to the de-tection limit of the current generation of instruments (Bregman, 2007). As a con-sequence, to date, haloes of hot gas have only been observed around some massive spiral galaxies (see Fig.1.6). In the giant spirals NGC 1961, NGC 6753, UGC 12591 and NGC 266, X-ray emission has been detected beyond 50 kpc from the center, indicating the presence of extended structures of hot gas (Dai et al., 2012; Bogd´an et al., 2013; Anderson, Churazov & Bregman, 2016). The mass of these coronae is comparable with the disc baryonic mass (∼ 1011M
), accounting for 10 − 50%
of the missing baryons associated to those galaxies. Recent estimates, obtained by combining observations of Ovi absorbers around star-forming galaxies by the COS-Halos survey (see Sec. 1.1.3) with the Ovii and Oviii absorptions associated with
our Galaxy in a single model of corona, constrained the coronal gas mass of a Milky Way-like galaxy to 1 − 2 × 10¹¹ M
(Faerman, Sternberg & McKee,2016). In
agree-ment with theoretical expectations (see Sec.1.2.1), the metallicity of these coronae is quite low, close to 0.1 Z (Bogd´an et al., 2013; Hodges-Kluck & Bregman, 2013).
Figure 1.6: Hot corona in NGC 6753 (adapted from Bogd´an et al.,2013). Left panel : X-ray surface brightness image based on the combined XMM-Newton EPIC data sets. The size length of the image is 10’, which corresponds to 126.7 kpc at the distance of the galaxy. The image reveals large-scale extended emission surrounding the galaxy originating from the hot X-ray emitting gas. Right panel : X-ray surface brightness profile in the 0.3–2 keV band obtained from the combined data of XMM-Newton EPIC PN and EPIC MOS cameras. The K-band profile is also plotted, normalized to match the level of X-ray emission in the innermost bin. The excess of emission beyond ∼ 1.5 arcmin (20 kpc) cannot be produced by disc (stellar) emission.
In the Milky Way, the existence of a hot corona was originally hypothesized by Spitzer (1956) as the medium that provides pressure confinement to the High-Velocity Clouds. Most of the evidence that we have is indirect and comes from the head-tail structure of several HVCs (Putman, Saul & Mets,2011), the rotation measure of pulsars in the Large Magellanic Cloud (Anderson & Bregman,2010) and ram pressure stripping of dwarf galaxies in the Local Group (Grcevich & Putman,
2009; Gatto et al., 2013; Salem et al., 2015). Hot medium around the Galactic disc was detected and characterized through Ovii and Oviii emission lines in the soft X-ray background and Ovii and Oviii absorption lines in quasar spectra. The mass inferred from these detections is ∼ 4 × 10¹⁰M
within 250 kpc, a value comparable
with the disc stellar mass of our Galaxy, but ∼ 6 times smaller than the mass of the missing baryons associated with it (Miller & Bregman, 2015). The coronal metallicity of the Milky Way is not well constrained, but studies through both Far Ultraviolet absorption spectra and emission/absorption lines of Ovii and Oviii estimate a value between 0.1 and 0.3 Z (Sembach et al., 2003; Miller & Bregman,
1.2. Origin of the halo gas 11
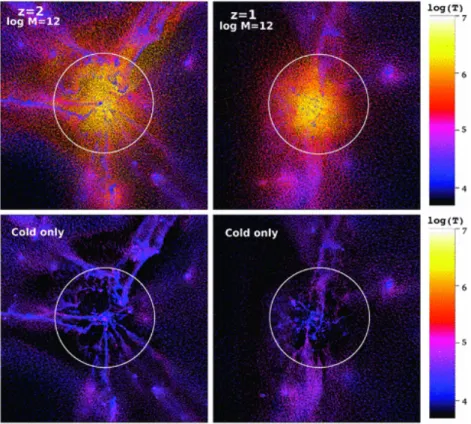
Figure 1.7: Temperature snapshots of a cosmological ΛCDM simulation of a Milky Way galaxy from (Kereˇs et al., 2009). The box region is 1 h−1 Mpc (comoving) on a side and 1 h−1 Mpc (comoving) in projected depth. Left panels show the galaxy at z = 2 (Mvir = 1.1 × 10¹²M ), right panels show the galaxy at z = 1 (Mvir = 1.2 × 10¹²M ).
Upper panels show all the gas particles, lower panels show only the gas with T < 105 K but with the same colour scale (indicated on the right-hand side). The circles indicate the virial radius.
1.2
Origin of the halo gas
The origin of the multiphase halo gas is currently uncertain because the processes that regulate its formation and evolution are difficult to constrain both theoretically and observationally. Several scenarios have been proposed but the debate is still open. In the following section, we show the main processes that are currently thought to be at work.
1.2.1 Accretion from IGM
Classical models of galaxy formation predict that galaxies form from the collapse of overdense regions of matter: baryonic matter collapses in dark-matter potential wells and it is heated by continuous shocks until it forms an isotropic and spherical halo in hydrostatic equilibrium at virial temperature (White & Rees, 1978; White & Frenk,1991).
Recently, cosmological ΛCDM simulations and analytic models have revised this classical picture. They showed that gas accretion from the IGM can occur in two modes: the cold mode accretion occurs through gas flows along overdense dark matter filaments that reach the central galaxy without being shock-heated to the virial temperature (see Fig.1.7); in the hot mode accretion instead the gas is shock-heated to the virial temperature and forms a hot and rarefied corona around the galaxy (see Sec.1.1.4) (e.g., Birnboim & Dekel,2003; Dekel & Birnboim,2006). Cold mode accretion is similar to what proposed by Binney (1977) and it is expected to dominate the global growth of all galaxies at high redshifts (z & 2) and the growth of low-mass star-forming galaxies in the low-redshift Universe. Indeed, virial shocks can not form in low mass haloes because of the short cooling times of the gas. Hot mode accretion dominates the growth of galaxies with dynamical mass Mvir & 2 − 3 × 10¹¹M or baryonic mass Mbar & 2 − 3 × 10¹⁰M at low redshift
(z < 1) (Kereˇs et al., 2009). As shown in Fig. 1.7, filamentary structures of cold mode accretion exist even above the threshold mass at z = 1 and directly feed the central galaxy, but progressively decrease at lower redshifts. The transition redshift and the mass threshold are still uncertain and depend on the type of hydrodynamic solvers of the simulations (e.g., Nelson et al., 2013).
Accretion on the Milky Way, which has a virial mass of Mvir ∼ 2 × 10¹²M (e.g.,
Li & White,2008; Reid et al., 2009), is expected to be currently dominated by hot mode accretion. As a consequence, most of the accreted gas does not directly connect to the disc. Because of strong shocks, cold filaments dissipate their own kinetic energy and contribute to heating of the surrounding hot medium. Cosmological simulations of Milky Way-like galaxies find that the temperature of these filaments lies in the range of 104.5−5.5K (Joung et al.,2012). Observationally, these filamentary
structures could be represented by the diffuse ionized gas, both cold and warm, detected through absorption lines of ions (see Sec.1.1.2and 1.1.3). The outer parts of the filaments are instead heated to higher temperatures, T & 106 K, becoming part of the hot and diffuse corona. The same simulations show that the densest parts of the cold mode filaments could survive the journey through the corona and infall on the disc (Fern´andez, Joung & Putman, 2012; Joung et al., 2012). Such filaments are currently not revealed in Hi emission (see Sec. 1.1.1), although this may be due to the fact that these observations do not have enough sensitivity.
1.2.2 Satellite Accretion
Part of the multiphase halo surrounding spiral galaxies could be composed by gas lost from gas-rich dwarf galaxy satellites during their own motion through the host galaxy’s corona (Putman et al.,2003; Grcevich & Putman,2009). High-resolution N-body+SPH simulations show that dwarf galaxies lose their own gas mainly because of ram pressure stripping exerted by the coronal medium, although tidal stripping,
1.2. Origin of the halo gas 13
due to tidal force by the host galaxy, can also play an important role (Mayer et al.,
2006). ΛCMD models predict that galaxies experience a small number a major mergers at high redshift, and an almost continuous infall of dwarf galaxies (e.g., Lacey & Cole, 1993). Indeed, ΛCMD simulations shows that 40% of Milky Way galaxies host a bright satellite (L ∼ 109L , e.g. LMC) within their virial radius and
this result is consistent with the SDSS observations (Tollerud et al.,2011; Putman, Peek & Joung,2012).
In the Milky Way’s halo, the Magellanic System (Stream + Bridge) has been produced by tidal interaction between the two satellite galaxies LMC and SMC and their subsequent interaction with the Milky Way (see Sec. 1.1.1). The total gas mass of this complex is ∼ 2 × 10⁹M
, of which 25% is composed by Hi (more than
∼ 30−50% of the Hi mass of our Galaxy, Br¨uns et al.,2005), while 75% is composed by ionized gas, both cold and warm (Fox et al., 2014). During its own trip toward the galactic disc, a fraction of cold neutral gas stripped from satellites mixes with the hot medium creating warmer gas at intermediate temperatures. Observationally, this could explain the spatial and kinematic proximity between ion absorptions and the main Hi complexes in the Milky Way (see Sec. 1.1.2 and 1.1.3).
1.2.3 Feedback
Central black holes and disc stars emit into the CGM a fraction of gas metal-enriched by stellar processes, respectively through AGN and stellar feedback (supernovae explosions and stellar winds). These processes can provide a significant amount of gas and energy in the haloes of galaxies.
Feedback driven by AGN or powerful starbursts can have triggered gas out-flows in Milky Way-like galaxies at redshift z > 1. Recent cosmological simulations that study the nature and origin of CGM, incorporate these feedback prescriptions, needed to reproduce the number density of observed galaxies (e.g., Benson et al.,
2003). They show that most of the observed cold/warm absorbers in the haloes of galaxies is due to gas that was ejected from galaxies through large-scale galactic out-flows with velocity between 200 km s−1 and 1000 km s−1 (e.g., Stinson et al.,2012; Joung et al., 2012; Ford et al., 2013). In this range, higher-velocity gas escaped the galaxy’s halo, while lower-velocity gas contributes to enrich the halo out to virial radii (see Sec.1.1.2and 1.1.3). This halo gas may eventually fall back onto the star-forming disc. The idea that powerful outflows ejected a large amount of material into the haloes of galaxies is confirmed by the recent findings that galaxies seem to be missing more than half of the metals that the disc stars have produced during their evolution (Zahid et al.,2012; Peeples et al.,2014). Galactic outflows have been effectively detected through multi-wavelength observations: they are composed by hot plasma at temperature of 107−8 K observed in X-rays (well measured in M 82,
opti-cal and near-UV wavelengths (e.g., Martin et al., 2012), and even molecular gas at temperature of 101−3 K observed at radio wavelengths (e.g., Bolatto et al., 2013).
In Milky Way galaxies at low redshift, galactic fountains are the main feedback mechanism (Shapiro & Field,1976; Bregman, 1980). Galactic fountains differ from large-scale galactic winds: they are driven by the blowout of superbubbles and affect the whole galactic disc, unlike AGN and starburst phenomena that occur in inner regions of galaxies. The classical theory predicts that galactic fountains are composed by ionized gas (T & 104 K) travelling through the galactic halo out
to a few kpc above the plane. This gas cools very quickly during its orbit and, given that its ejection velocity is typically much lower than the escape velocity from galaxy, falls back onto the disc in the form of cold dense clouds and filaments (e.g., Houck & Bregman, 1990; Melioli et al., 2008). As mentioned in Sec. 1.1.1, galactic fountains explain the origin of most of extra-planar gas at the disc-corona interface. In the Milky Way, the disc-like metallicity of the IVCs is consistent with a fountain origin. Moreover, the large population of small disc-halo clouds can be related to star-formation activity in the Galactic disc (Ford, Lockman & McClure-Griffiths,
2010). In Chapter2, we show that the most prominent Galactic HVC, Complex C, can also originate from galactic fountain clouds ejected from the Milky Way’s disc.
1.3
Gas accretion and feeding of star formation
A long standing problem in the evolution of star-forming galaxies like the Milky Way is how they keep accreting gas from the environment to feed their star formation. The star formation rate of these galaxies has mildly declined throughout their life times (∼ 10 Gigayears) (e.g., Aumer & Binney,2009; Fraternali & Tomassetti,2012). In addition, it appears that Hi content of these galaxies has remained approximately unchanged throughout the Hubble time (e.g., Bauermeister, Blitz & Ma,2010; Zafar et al., 2013). Typically, the mass of gas contained in the thin disc can sustain the process of star formation only for one to a few gigayears (Kennicutt,1983; Saintonge et al.,2013) and thus, at any given cosmic epoch, spiral galaxies need some supply of external gas to be brought into the disc, at a rate of ∼ 1 M yr−1, to compensate
the conversion of gas into stars (e.g., Sancisi et al.,2008). This gas needs to be metal poor in order to fulfill chemical evolution models of spiral galaxies (e.g., Pagel,2009; Matteucci, 2012) and to explain the observed metallicity gradients (e.g., Cavichia et al.,2014; Pezzulli & Fraternali, 2016).
For decades, HVCs have been considered as good candidates for accreting cold and low-metallicity material onto the Milky Way, but the most recent estimates indicate that the accretion rate is merely 0.08 M yr−1 (Putman, Peek & Joung,
2012), more than an order of magnitude lower than the Galactic star formation rate (1 − 3 M yr−1, Chomiuk & Povich,2011). The situation does not change in nearby
1.3. Gas accretion and feeding of star formation 15
galaxies where the amount of cold gas accretion from HVCs and minor mergers seems to account for at most ∼ 10% of the star formation requirement (Sancisi et al.,2008; Di Teodoro & Fraternali, 2014).
An alternative possibility is that gas accretion occurs mostly as ionized gas. As discussed in Sec. 1.1.2 and 1.1.3, the ionized gas phase extends beyond the Hi
dense component in the CGM. For the Milky Way, Shull et al. (2009) and Lehner & Howk (2011) estimated an accretion rate of ionized material onto the disc slightly lower respect to the star formation rate (. 1 M yr−1). However, these estimates
are uncertain due to the unknown distances of most detections. Moreover, in order to be available for star-formation, ionized gas must survive its own trip through the coronal medium without being destroyed before reaching the star-forming disc. Several simulations of the survival of cold halo clouds moving in a hot medium were performed in the last years, showing that the survival timescales are relatively short (. 100 Myr, e.g., Bland-Hawthorn et al., 2007; Heitsch & Putman, 2009; Kwak, Henley & Shelton, 2011). In Chapter 5, we explore the physical conditions that allow the survival of cold (ionized+neutral) gas in hot galactic coronae for hundreds of Myr.
As discussed in Sec. 1.1.4, cosmological coronae seem to contain a significant reservoir of gas that could be accreted by star-forming galaxies to sustain star for-mation at the current observed rates. However, the hot and rarefied gas needs to be cooled in order to make it available for star formation. Then, in this case, the accre-tion time is set by the cooling time of the gas shocked to the virial temperature. For a Milky Way galaxy, with Tvir = 2 × 10⁶ K (e.g., Fukugita & Peebles,2006; Miller &
Bregman, 2015), the cooling time is tcool ' (3kBTvir)/(neΛ(Tvir)) ∼ 2.7 Gyr, where
kBis the Boltzmann constant, ne = 5.4 × 10⁻⁴cm−3is roughly the coronal electronic
density close to the disc (e.g., Anderson & Bregman,2010) and Λ(Tvir) = 1.8 × 10⁻²³
erg cm3 s−2 is the cooling rate at metallicity 0.1 Z
. The spontaneous cooling time
of a Milky Way corona appears very long and how gas cooling and accretion takes place in these hot coronae is still a matter of debate.
An hypothesis put forward to explain how the coronal gas might cool and col-lapse onto the disc was that the development of thermal instabilities in the corona could lead to the formation of cold clouds (Maller & Bullock,2004; Kaufmann et al.,
2006). However, later studies demonstrated that, in galaxies similar to the Milky Way, thermal instabilities are damped by the combined effect of heat conduction and buoyancy: cold clouds smaller than 10 kpc can form only farther than 100 kpc from the disc (Binney, Nipoti & Fraternali,2009; Nipoti & Posti,2013), in contradiction with the distances determined for HVCs (. 10 kpc). Finally, both adaptive mesh re-finement cosmological simulations of Milky Way-like galaxies and smoothed particle hydrodynamical simulations with an appropriate treatment of phase mixing show that spontaneous cooling through formation of thermal instabilities in the corona
0 50 100 150 200 250 0 2 4 6 8 10 12 14 16 18 Rotation velocity (km/s) R (kpc) Disc Fountain Fountain + Accretion z=3.9 kpc 0 50 100 150 200 250 0 2 4 6 8 10 12 14 16 18 Rotation velocity (km/s) R (kpc) Disc Fountain Fountain + Accretion z=5.2 kpc
Figure 1.8: Hi rotation curves of NGC 891 (points with error bars) at z = 3.9 kpc (top panel ) and z = 5.2 kpc (bottom panel ) above the plane. In both panels, the dotted line represents the rotation curve of the disc and it is shown to point out that the rotational velocity decreases with increasing distance from the plane. The red line shows the predic-tion of a simple ballistic fountain model (from Fraternali & Binney, 2006), the blue line indicates the prediction of the fountain model including accretion of gas from the corona (from Fraternali & Binney,2008).
should not occur (Joung et al., 2012; Hobbs et al., 2013). As seen in Sec. 1.2.1, Fern´andez, Joung & Putman (2012) and Joung et al. (2012) found that non-linear perturbations, such as the cold mode filaments at T . 105.5 K, are needed to
ex-plain the formation of cold clouds in the hot corona. However, whether this cold gas coming from filaments can travel several tens of kpc without shattering remains unclear. Therefore, the question of how the galactic corona can cool and feed the star-forming disc is still open.
1.3.1 Disc-corona interface
As discussed in Sec. 1.1.1 and 1.2.3, most of the cold gas at disc-corona interface is thought to be composed by galactic fountain clouds, which orbit over the disc through the coronal medium.
1.3. Gas accretion and feeding of star formation 17
Fraternali & Binney (2006) built a dynamical model of fountain clouds that follow ballistic trajectories into the galactic halo and applied it to the extra-planar Hi observations of two nearby galaxies, NGC 891 and NGC 2403. This model is able to reproduce the observed Hi vertical distribution of the extra-planar gas, but there are inconsistencies between the predicted and the observed kinematics. In particular, the model underestimates the vertical velocity gradient (see Sec. 1.1.1
for details): the observed Hi rotational velocities are lower than the theoretical expectations. Fig. 1.8 illustrates the case of NGC 891. The two plots show the Hi
rotation curves (black points with error bars) at 3.9 kpc (left panel) and 5.2 kpc (right panel) above the plane. In both plots the dotted black line indicates the rotation curve in the plane, the red line shows the rotational velocity predicted by a simple ballistic fountain model, while the blue line shows the result of a fountain model that includes accretion of gas from the ambient medium (Fraternali & Binney,
2008). The latter model fits the data points very well, therefore, it appears that the extra-planar Hi kinematics can be explained by assuming that the fountain clouds lose angular momentum by accreting material at lower rotational velocities from the ambient medium. The main free parameter in this model is the accretion rate of the clouds. Fraternali & Binney (2008) found that the global accretion rates required to reproduce the observed Hi data-cubes of NGC 891 and NGC 2403 are very close to their respective current star formation rates. Therefore, accretion driven by galactic fountain clouds seems to be a viable mechanism for star-forming galaxies to get the right amount of gas needed to sustain star formation.
In order to investigate the physical phenomenon that drives the interaction be-tween the hot corona and the cold fountain clouds, Marinacci et al. (2010, 2011) carried out 2D hydrodynamical simulations of a cold (T = 104 K) and disc-like
metallicity cloud travelling through the hot (T = 2 × 10⁶ K) corona of the Milky
Way. They found that the motion produces Kelvin-Helmholtz instabilities at the interface between the two fluids. The cold gas, stripped from the cloud, mixes effi-ciently in the turbulent wake behind the cloud. This mixing reduces dramatically the cooling time of the hot gas, triggering the condensation and the accretion of a fraction of coronal material onto the disc. Fig. 1.9 sketches this process. Moreover, the relative motion between the two fluids produces another important effect, that is the transfer of momentum between the cloud and the corona. The efficiency of momentum transfer strongly depends on their relative velocity. Marinacci et al. (2011) found that the hot corona stops absorbing momentum when the relative ve-locity between the cloud and the ambient medium drops below a threshold veve-locity vth ' 75 km s−1. At lower velocities, condensation immediately regains the
momen-tum given to the hot corona. This result suggests that the corona must rotate, but with a velocity lower than that of the disc. Indeed, only a lower velocity of the corona can explain the loss of angular momentum of the cold gas during the
Figure 1.9: Schematic picture of a galactic fountain cloud (from Fraternali et al.,2013). Once ejected form the disc by stellar feedback, the cold and metal-rich cloud travels through the hot galactic corona and interacts with it. The interaction creates a turbulent wake behind the cloud where the hot and metal-poor coronal gas mixes with the cold gas stripped from the cloud. This mixing triggers the cooling of a portion of coronal material and produces a decrease of the cold gas angular momentum. An observer looking toward a background source intercepting the wake detects both Hi emission and absorption lines of turbulent cold/warm ionized material. An observer looking toward the cold front detects Hi emission.
coronal accretion phase and, then, the vertical velocity gradient measured for the extra-planar Hi.
Marasco, Fraternali & Binney (2012) used the dynamical model of Fraternali & Binney (2008) to fit the kinematics of the extra-planar Hi of the Milky Way.
They found that the model reproduces the Hi emission of the IVCs, thus confirming their disc origin, and provides a current accretion rate of coronal gas onto the disc of ∼ 2 M yr−1 , in agreement with the accretion required to sustain the star formation
rate in the Milky Way. Marasco, Marinacci & Fraternali (2013) extended this model by including the results of hydrodynamical simulations to investigate whether the cold/warm absorption features, observed in the Milky Way’s halo (see Sec. 1.1.2
& 1.1.3), are consistent with being produced by the coronal condensation in the turbulent wake behind the fountain clouds (see Fig. 1.9). The new model is able to reproduce positions and velocities of the most of the warm absorbers observed in the Galactic halo.
In conclusion, observations, dynamical models and hydrodynamical simulations suggest that accretion driven by galactic fountain clouds can be a viable mechanism for star-forming galaxies to sustain their star formation at the current observed rates.
1.4. This thesis 19
This feedback-driven cooling of the galactic corona may have important implications for the evolution of star-forming galaxies, as we discuss in Chapter 4.
1.4
This thesis
In the previous sections, we have highlighted that the galactic haloes constitute a large reservoir of gas that plays an important role in the evolution of galaxies. The aim of this Thesis is to study, through high-resolution hydrodynamical simulations, the nature of these galactic haloes and, in particular, the physical phenomena driving the interaction and the mixing between the different gas phases. The final goal is to obtain a clearer picture of the interplay between galaxies and their surrounding environment.
In Chapter 2, we focus on the origin of Complex C, the most prominent HVC of the Milky Way, with very low metallicity. By combining a dynamical model of galactic fountain (Marasco, Fraternali & Binney,2012) with high-resolution hydro-dynamical simulations, we find that the Complex C was produced by the ejection of disc material that acted as a seed for cooling of a large portion of Galactic corona.
In Chapter 3, we describe the main numerical features of the ATHENA code (Stone et al.,2008), which we used to perform our hydrodynamical simulations pre-sented in Chapters 4 and 5. To make ATHENA suitable for our purposes, we have modified it by introducing a more complete module for radiative cooling/heating that supports multiple gas metallicities and an algorithm for isotropic thermal con-duction.
In Chapter4, we widen the work done by Marinacci et al. (2010) (see Sec. 1.3.1). Until now, the interaction between the cold fountain clouds and the hot coronal medium had been studied only under conditions representative of our Milky Way. Here, we perform high-resolution hydrodynamical simulations of the cloud-corona interaction in haloes with different coronal temperatures, to probe a wide range of galaxy virial masses. These new simulations include the presence of thermal conduction, absent in the calculations performed so far.
In Chapter 5, we analyze under what physical conditions large amounts of cold gas can survive in the outer hot corona (see Sec. 1.1.2 and 1.1.3). We assume that the observed cold/warm ionized gas is associated with the interaction and mixing between the hot coronal medium and cold neutral gas.
2
Chapter
The origin of the High-Velocity Cloud
Com-plex C
†
2.1
Introduction
High-Velocity Clouds (HVCs) are cold gas complexes having velocities incompatible with their being part of the Galactic disc. Their origin has been a matter of debate for the last fifty years. Two competing scenarios have been proposed suggesting origins either external or internal to the Milky Way’s disc (Wakker & van Woerden,
1997). The external origin was originally put forward by Oort (1970) who inter-preted them as left-overs from the formation of our Galaxy. The internal hypothesis postulated that HVCs were clouds condensing in the Galactic halo from gas pre-viously ejected from the disc by supernova explosions, through a galactic fountain (Bregman,1980). In this latter case, the clouds should be at distances of a few kpc from the Galactic plane and have roughly the same metallicities as the disc material. The measurement of distances and metallicities of the HVCs became then crucial to distinguish between the two different scenarios.
Metallicities have been measured for most complexes and they have often been
†Some of the results of this Chapter have been published in Fraternali, Marasco, Armillotta, & Marinacci (2015).
found to be below the Solar value, typically between 0.1 and 0.4 Solar (e.g., Wakker,
2001). Moreover, recent works have found that most HVCs are generally located within about 10 kpc from the Galactic plane (Wakker et al., 2007; Thom et al.,
2008). Overall, the relatively low metallicity was considered evidence for an extra-galactic origin although the actual source of the HVC material remained a mystery. Various mechanisms have been proposed such as thermal instabilities in the Galactic corona (Kaufmann et al.,2006), gas stripping from satellites (Olano, 2008) and gas condensation in cosmological filaments (Fern´andez, Joung & Putman,2012).
Here, we focus on the most prominent and best studied of all HVCs, Complex C. Wakker et al. (1999), first, measured the metallicity of this HVC to be significantly below the Solar value, Z . 0.1 Z . This very low value allowed to interpret Complex
C as metal-poor gas coming from the intergalactic medium and falling onto the Milky Way’s disc. However, more recent works, based on observations along more than one line of sight (unlike Wakker et al., 1999), found that Complex C is not characterized by a single metallicity. Gibson et al. (2001) and Collins, Shull & Giroux (2003) measured the metallicity of Complex C to to lie in the range between 0.1 Z and 0.45 Z , showing that some regions within this cloud are significantly
contaminated by metal-enriched gas. These new measurements have suggested a new scenario, according to which Complex C is composed by a mixture of infalling metal-poor gas and metal-rich Galactic fountain material (Collins, Shull & Giroux, 2003). Moreover, the wide range of observed metallicities indicates that this mixture is not homogeneous but some regions within it are more well-mixed than others (Gibson et al.,2001).
Further evidence for a metal enrichment of Complex C by Galactic material comes from abundance ratios of different elements. The significant enrichment of α-elements (e.g. O, Si, S) relative to N and Fe suggests that the bulk of metals in Complex C were produced by massive stars and injected into the surrounding medium through Type II supernovae (Collins, Shull & Giroux, 2003). Moreover, Collins, Shull & Giroux (2007) found a dependence between metallicity and Hi
column density: lower metallicities along the line of sight correspond to higher Hi column densities. According to those authors, this weak (2σ) anti-correlation could confirm the idea that Complex C originates from infalling extra-galactic gas that mixes with fountain material during its fall onto the Galactic disc. Indeed, mixing with metal-rich material should occur more efficiently in the outer and less dense regions of the complex, while the inner and denser regions remain intact and metal-poor.
In this Chapter, we combine the two competing scenarios concerning the forma-tion of Complex C and present a new model, according to which Complex C was produced by the ejection of disc material, via supernova feedback, that has triggered the cooling of a large portion of hot coronal gas. In our model, contrary to the idea
2.2. Method 23
of Collins, Shull & Giroux (2007), the seed of Complex C originates from the Galac-tic disc, not from infalling material. The Chapter is organized as follow. In Sec.2.2
we introduce the approaches (dynamical model and high-resolution hydrodynamical simulations) used to model Complex C. In Sec. 2.3 we present the results of the model and their comparison with the observations. In Sec.2.4 we discuss the initial conditions of the hydrodynamical simulations. In Sec. 2.5 we summarize the main results and discuss their implication for the evolution of the Milky Way.
2.2
Method
The method that we used to model the formation and evolution of Complex C con-sists of a combination of a dynamical model of galactic fountain and high-resolution hydrodynamical simulations of disc clouds travelling through the Galactic corona. Our aim was to explore the space of physical parameters that can reproduce the observed features of Complex C (e.g., position, velocity, distance and metallicity). Carrying out this work by using only hydrodynamical simulations is extremely ex-pensive from a computational point of view. Therefore, the combination of high-resolution hydrodynamical simulations and a fountain dynamical model was the only viable approach.
2.2.1 Dynamical model
We used a galactic fountain model, in which gas clouds, ejected from the disc by stellar feedback, travel through the Galactic halo interacting and mixing with the the Galactic corona (see Marasco, Fraternali & Binney, 2012). As explained in Chapter 1, for typical conditions of the Milky Way disc-corona interface, this mix-ing dramatically reduces the coolmix-ing time of the corona causmix-ing its condensation into cloudlets that are then pulled down to the disc by gravity (Marinacci et al., 2010). A dynamical model of this kind produces an excellent fit to the all-sky extra-planar Hi emission of the Milky Way (Marasco, Fraternali & Binney, 2012). A crucial modification that we made to this model is to assume that stellar feedback prefer-entially ejects material in the regions of the spiral arms. We adopted a four-arm spiral pattern model (Steiman-Cameron, Wolfire & Hollenbach, 2010) and an arm width (FWHM) of 1 kpc. We assumed a pattern speed of 25 km s−1 (Gerhard,2011), which implies that the Sun is located roughly at the co-rotation radius, assuming R = 8.5 kpc and v = 220 km s−1 (see Fig. 2.1).
In our dynamical model, the fountain clouds are ejected perpendicular to the disc with a given kick velocity and assumed to be co-rotating with the Galactic disc at the moment of the ejection. The orbits of the fountain clouds were integrated in a standard axi-symmetric Galactic potential (Model II in Binney & Tremaine, 2008),
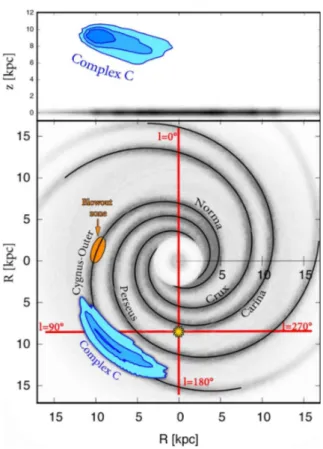
Figure 2.1: Two views of the HVC Complex C as resulting from our dynamical model (see text). Top panel : edge-on projection seen from the anticentre. Bottom panel : face-on view. The two panels are on the same scale. Contours are obtained from our galactic fountain model and correspond to Hi column densities of 1, 2 and 3 × 1019 cm−2. The spiral arms, the position of the Sun and the location of the ejection (orange ellipse) of the seed material are shown.
starting from initial conditions that can be varied to fit the data. In our model we also took into account two important hydrodynamical effects that can influence the ballistic orbit of the clouds: coronal ram pressure and condensation of coronal material (Marinacci et al., 2011).
The first effect can be parametrized by the drag time, tdrag, time at which the
relative velocity between cloud and corona, v, halves due to ram pressure exerted by the Galactic corona. The deceleration of the fountain cloud due to ram pressure can indeed be parametrized as (Fraternali & Binney,2008):
˙ v(R, z) = −v(R, z) 2 v0tdrag v(R, z) v(R, z) , (2.1)
where v0 the ejection velocity of the cloud relative to the coronal gas. v(R, z) is
2.2. Method 25
that the rotation velocity of the corona is:
vφ,cor(R, z) =
r
R∂Φ(R, z)
∂R − vlag. (2.2)
The first term on the right-hand-side of eq.2.2 is the ‘circular velocity’ at R and z with Φ(R, z) potential of the Galaxy, while vlag = 75 km s−1 is the rotation
veloc-ity of the corona around the Galactic centre relative to the local circular velocveloc-ity (Marinacci et al., 2011). Finally, in eq. 2.1:
tdrag=
Mcl
v0πR2clρcor
, (2.3)
with ρcor ∼ 10−27 g/cm−3 the coronal density and Rcl the cloud radius, obtainable
from the mass cloud, Mcl, by imposing pressure equilibrium between cloud and
corona (see Sec. 2.2.2 for details). We fixed the drag time by making assumptions on the initial mass. We supposed that Complex C is made up of tens of clouds with masses of ∼ 105M
that are shredded and disrupted by turbulence during their
motion giving rise to the observed power-law mass function (Hsu et al.,2011), and estimated a drag time of ∼ 380 Myr. However, we found that different initial masses and thus different drag times yield very similar final results. Indeed, the drag time has only a weak dependence on the cloud mass (tdrag∝ Mcl1/3).
The second hydrodynamical effect present in our model is condensation of coronal material. This condensation occurs in the cloud’s turbulent wake (see Fig.2.3) and it has a non-negligible effect in the kinematics of the cold phase. Indeed, the slower rotational speed of the cold coronal gas with respect to the cloud involves an overall decrease of the rotational velocity of the cold gas. The deceleration of the cold gas was modelled as (Fraternali & Binney, 2008):
˙ v(R, z) = −M˙cold(t) Mcold(t) v(R, z)v(R, z) v(R, z) , (2.4) with Mcold(t) = α(t) Mcold(t = 0) , (2.5)
where α(t) is a time-dependent function, describing the evolution of the cold gas mass Mcoldwith time. In eq.2.5, cold gas means both fountain gas and gas condensed
out from the corona through cooling in the cloud’s wake. We used a ninth grade polynomial as functional form of α(t). The polynomial coefficients were obtained by fitting the results of the hydrodynamical simulation (see Sec.2.2.2).
The dynamical model contains six free parameters: the initial velocity of the ejection, the location along the spiral arm, the size of the ejection zone, the look-back time, the duration of the ejection process and the ‘delay time’, a parameter
Tcor ncor Zcor Tcl ncl Zcl Mcl vcl
(K) (cm−3) (Z ) (K) (cm−3) (Z ) ( M ) ( km s−1)
2 × 10⁶ 10−3 0.1 104 0.2 0.8 105 180
Table 2.2: Initial parameters of our fiducial simulation: coronal temperature Tcor, coronal
density ncor, coronal metallicity Zcor, cloud temperature Tcl, cloud density ncl, cloud
metallicity Zcl, initial cloud mass Mcl and initial cloud velocity vcl.
related to condensation, better explained in Sec. 2.2.2. The main observational constraint of our model is the LAB 21-cm all-sky survey of the Milky Way (Kalberla et al., 2005), which provides detailed information about Hi column densities as
a function of position in the sky and velocity along the line of sight. A mask of Complex C was created by isolating its Hi emission channel by channel in the velocity range −200 < vHel< −75 km s−1 (Fig.2.4, blue shading). The output of our
fountain model is a mock observation in the form of a pseudo-datacube containing the simulated Hi emission from fountain clouds for different choices of our six free parameters. The fit to the observations was performed in two steps: at first, we used a downhill simplex method to find the best-fit values; then, we ran a Monte Carlo Markov Chain (MCMC) to estimate the error-bars on our parameters.
2.2.2 Hydrodynamical simulation
To determine the condensation properties of the coronal gas we ran a series of hy-drodynamical simulations of fountain clouds travelling through the Galactic corona. The resolution required to accurately characterize the condensation process is 2 × 2 pc (Marinacci et al.,2010), thus we could not simulate the whole Galactic disc.
All simulations were performed in a two-dimensional cartesian geometry with the ECHO++ code, which uses a fixed, non-adaptive grid with an higher upwind integration scheme. This code is based on the algorithm design of the ECHO (Eule-rian Conservative High Order) code originally developed by Del Zanna et al. (2007), translated into C++ by Marinacci (PhD thesis, 2011), to which we refer for a full description. In this Section, we only show our fiducial simulation, used to describe the evolution of the cold gas mass in the dynamical model. In Sec. 2.4, we discuss why we chose such a simulation as fiducial simulation of our problem.
The parameters that set the initial conditions of the simulation are listed in Tab.2.2. We considered a cold (Tcl = 104 K) cloud travelling through a hot medium
with an initial velocity vcl = 180 km s−1. The coronal temperature is Tcor = 2×10⁶K,
roughly the coronal temperature of the Milky Way (Fukugita & Peebles,2006; Miller & Bregman,2015), while the coronal metallicity is Zcor = 0.1 Z , according to the
values estimated by X-ray observations of hot halos around external spiral galaxies (Hodges-Kluck & Bregman, 2013; Bogd´an et al., 2013). Gravitational acceleration
2.2. Method 27
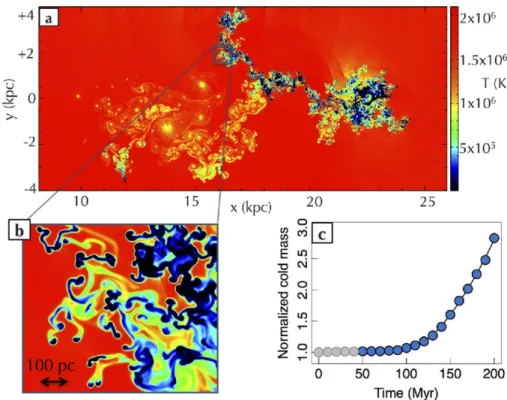
Figure 2.3: Hydrodynamical simulations of a galactic fountain cloud travelling through the Galactic corona. The simulation starts (at x = 0) as a round cloud at nearly solar metallicity, moving from left to right with respect to the hot metal-poor gas of the Galactic corona. (a) Temperature map after 175 Myr; the cold (blue) gas in the upper snapshot is made up both by cloud gas and by gas condensing from the corona, see close-up (b). (c) Mass of cold (T < 104.2 K) gas as a function of time normalized to the initial mass of the cloud; the condensation curve (blue line) was obtained by fitting a ninth grade polynomial to the points; the evolution before tdelay= 46 Myr is determined by the unrealistic initial
configuration of the cloud and has been excluded (see text).
and subsequent coronal density variation were neglected, thus we used a uniform density through the whole computational grid. The total number density of the coronal gas was fixed to ncor = 10−3 cm−3, in agreement with the average electron
density hnei = 5 × 10⁻⁴ cm−3 within 50 kpc from the Galactic disc (Anderson &
Bregman, 2011). The cloud number density (ncl = 0.2 cm−3) was obtained by
imposing pressure equilibrium between cloud and corona. Finally, we adopted a near-solar cloud metallicity, Zcl = 0.8 Z , which is typical metallicity of the Galactic
ISM at R ∼ 9−10 kpc (Esteban et al.,2013), where 9−10 kpc indicates the Galactic radius of the ejection region, as obtained from the dynamical model (see Sec. 2.3). In Sec. 2.2.1, we said that our dynamical model assumes that Complex C is made up of tens of clouds with masses of ∼ 105M . In this simulation, we only considered
a single cloud with mass Mcl = 105M .
The simulation ran for 200 Myr during which the cloud is torn apart by Kelvin-Helmhotz instabilities and produces a long turbulent wake where disc and coronal
material mix efficiently. In Fig. 2.3-a, we show a temperature snapshot after 175 Myr. The hot and metal-poor gas of the Milky Way’s corona would normally have a cooling time exceeding 2 Gyr. However, the mixing between cold and metal-rich material reduces this time by orders of magnitude and condensation occurs in the cloud’s wake (see cold knots in Fig. 2.3-b). Fig. 2.3-c shows the evolution of the cold gas at T < 104.2 K normalized to the initial cloud mass with time: the cold gas mass increases with time because more and more coronal gas cools down in the turbulent wake. After 200 Myr the amount of condensation is more than twice the initial mass of the cloud. We fitted a ninth grade polynomial, α(t) (see eq. 2.1), to the points of Fig. 2.3-c and used this condensation curve to describe the accretion from the corona in the clouds of our galactic fountain model. Since our dynamical model aims to reproduce the Hi emission of Complex C, we considered only gas at T < 104.2 K in our simulation, indeed at T > 104.2 K the abundance of Hi with
respect to the total hydrogen is less than 50% under the assumption of collisional ionization equilibrium (CIE, Sutherland & Dopita,1993). Condition of CIE was also assumed to calculate the gas radiative cooling during the simulation. The values of cooling rates were taken from Sutherland & Dopita (1993) (see also Sec. 3.4.1).
Our simulation starts from the unrealistic configuration of a round cloud, which limits the contact surface between cloud and corona and slows down their interaction. We introduced a delay time, tdelay, that allows us to exclude the initial few tens
of Myr of the simulation (Marasco, Fraternali & Binney, 2012). After this time, the cold gas, stripped from the cloud, mixes efficiently with the coronal gas and the condensation process can start. Therefore, the starting time of our dynamical model corresponds to t = tdelayin the simulation. We point out that the mass of cold
gas increases with time (monotonic trend as a function of time), then, the larger is tdelay, the larger is the amount of cold coronal gas accreted by the fountain cloud.
We used tdelay to parametrize the effect of condensation in the dynamical model.
The parameter tdelay is fitted to the data along with the other five parameters of
the dynamical model (see Sec. 2.2.1). In this way, we could incorporate into the dynamical model the exact trend of the condensation in the simulation instead of using a simplified function as done in Marasco, Fraternali & Binney (2012).
2.3
Results
In this Section we present the results of our dynamical fountain model, in which we included the parametrization of the temporal evolution of the cold gas mass inferred by our fiducial simulation. In the dynamical model, for each set of parameters we build a mock Hi data-cube that can be directly compared with the Hi data of Complex C.
2.3. Results 29
Figure 2.4: Six representative channel velocity maps taken from the Hi LAB survey in the region of Complex C. We marked the emission of Complex C with blue shade and black contours to distinguish it from emission due to other sources in that same area (grey shade and contours). The red contours show the Hi emission predicted by our model. Both model and data are smoothed to 4◦ of angular resolution. Note that our model interestingly predicts some emission at low velocities (around 90 km s−1), where there is Hi detected although it is not usually associated to Complex C. Contour levels are at 0.04, 0.08, 0.16, 0.32, 0.64 and 1.28 K. In this projection, the ejection of seed material took place at about l = 45◦ and b = 0◦.
in the (Norma)-Cygnus-Outer spiral arm about 150 million years ago (Fig. 2.1). The best fit to the observations is obtained by ejecting material from this arm at R = 9.5 kpc from the Galactic centre (13.3 kpc from the Sun) in a region ∼ 3 kpc wide around longitude l = 45◦. Fig.2.1 sketches the ejection area along the Cygnus-Outer spiral arm and the current location of Complex C. The quality of the fit to the observations can be appreciated in Fig. 2.4 where we show six representative channel maps from the LAB survey in the region of Complex C (blue shade with black contours) overlaid with the emission predicted by our galactic fountain model (red contours). We can note a remarkable agreement in location, velocity and shape between model and data. We have marked the emission from the disc of the Milky Way, the Galactic warp, the HVC complexes A, M and K, and the IV arch, a prominent intermediate-velocity cloud located at d < 3.5 kpc from us with Solar metallicity (Richter et al., 2001), and completely unrelated to Complex C.
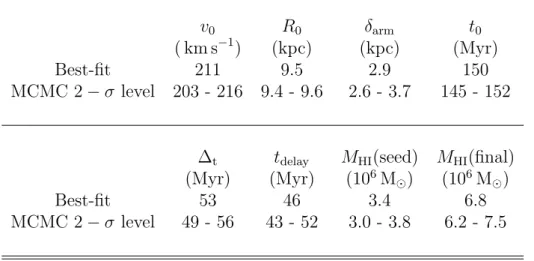
In Table2.5, we summarize the physical properties of Complex C as derived from our dynamical/hydrodynamical model. The material has been ejected vertically at v0 ∼ 210 km s−1 as the result of the blowout of one or more superbubbles. The
v0 R0 δarm t0
( km s−1) (kpc) (kpc) (Myr)
Best-fit 211 9.5 2.9 150
MCMC 2 − σ level 203 - 216 9.4 - 9.6 2.6 - 3.7 145 - 152
∆t tdelay MHI(seed) MHI(final)
(Myr) (Myr) (106M
) (106M )
Best-fit 53 46 3.4 6.8
MCMC 2 − σ level 49 - 56 43 - 52 3.0 - 3.8 6.2 - 7.5
Table 2.5: v0: initial ejection velocity of the disc material; R0 and δarm: Galactic radius
and size of the ejection region (blowout) along the arm; t0 and ∆t: look-back time and
duration of the ejection; tdelay: delay time in the hydrodynamical simulation (see the text
and Fig.2.3). MHI: Hi mass of the seed (disc) material and total current mass of Complex
C after the condensation of coronal gas.
hydrogen from the disc plane. The ejected gas acted as a seed for the condensation of the galactic corona bringing the total Hi mass budget of the system to ∼ 7×10⁶M ,
in agreement with the estimated mass of Complex C (Wakker et al.,2007). Presently, Complex C is a structure that is 15 kpc in length, and stretches from close to the ejection zone up to a maximum distance from the plane of ∼ 10 kpc (Fig. 2.1). The average positions are R = 12.9 kpc and z = 8.4 kpc. The distance from the location of the ejection is due to a combination of the typical trajectory of fountain clouds, which tend to move the gas outwards, the differential rotation of the disc and the pattern speed of the arms. The location and the elongation are remarkably similar to the outcome of hydrodynamical simulations of superbubble blowout in our Galaxy (Melioli et al.,2008).
We compared the predictions of our model to an independent observational con-straint, the distance of Complex C. In the literature, there are several limits to the distance of Complex C obtained from detections and non-detections of metal absorption lines against halo stars. The average distance from the Sun is 10 ± 2.5 kpc (Thom et al., 2008) with a mild gradient along the cloud. In Fig. 2.6 we show the distance limits as a function of Galactic longitude (data points with error bars, Wakker et al.,2007; Thom et al.,2008) compared to the average location of the gas in our dynamical model (black curve with gray band). In our model, the section of Complex C closer to us is that further away from the Galactic disc, at higher l and b, and this is consistent with all the distance determinations. This agreement is highly significant: given that the distance information has not been used in the fit to the Hi data, this result represents an independent confirmation of our model.
2.3. Results 31
Figure 2.6: Average distance from the Sun of Complex C predicted by our dynamical model as a function of Galactic longitude (black curve), compared with distance determi-nations from the literature (Wakker et al.,2007; Thom et al.,2008). The grey bands show the 16 and 84 percentiles.
2.3.1 The metallicity of Complex C
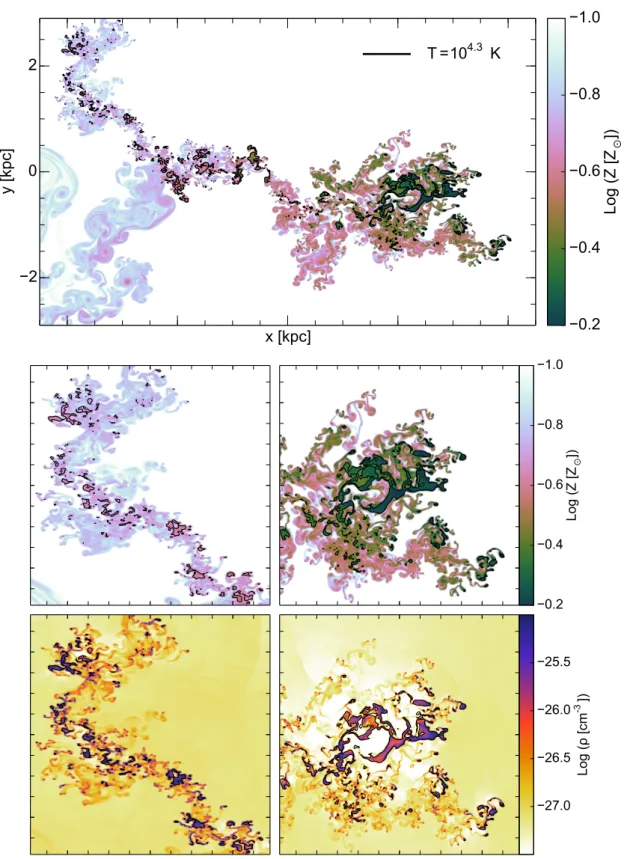
An other important observational constraint, which can be compared to our theo-retical expectations, is the metallicity of Complex C. As mentioned in Sec. 5.1, the discovery of the low metallicity of Complex C ruled out the hypothesis, proposed by Bregman (1980), according to which Complex C is composed by metal-rich disc gas, ejected from the disc by supernova explosions. Despite recent findings showed metal-enrichment in some regions of Complex (see Sec.2.1), the overall low metallic-ity of Complex C has always been considered as evidence for its extragalactic origin. Our model combines the two competing scenarios concerning the origin of Complex C. It suggests that Complex C was produced from the ejection of metal-rich disc material (galactic origin) that has triggered the cooling of a fraction of the metal-poor corona (extragalactic origin). We investigated if our solution may provide a good explanation to the ‘low-metallicity’ problem of Complex C.
Our fiducial simulation of Complex C (Sec. 2.2.2 and Fig. 2.3) predicts that a mass of gas larger than the initial mass of the cloud condenses from the corona with time, bringing the mass-average metallicity of cold gas to Z ∼ 0.27 Z after
200 Myr. The top panel of Fig. 2.7 shows the metallicity map in logarithm scale, obtained from the simulation, after 175 Myr. The map highlights the presence of a clear metallicity gradient along the x -direction, which is the direction of the cloud motion. Regions situated in the head of the mixture, where the gas lost from the cloud is not yet well mixed with the coronal gas, are more metal-rich than the regions situated in the wake, where the bulk of the mixture is composed by coronal gas. The central panels of Fig. 2.7 show a magnifications of a portion of the wake