Alma%Mater%Studiorum!–!Università!di!Bologna!
!
DOTTORATO!DI!RICERCA!IN!
Scienze!e!tecnologie!agrarie,!ambientali!e!alimentari!
!
Ciclo!XXVIII!
Settore&Concorsuale&di&afferenza& :!07/D1!Patologia!vegetale!ed!entomologia! ! Settore&Scientifico&disciplinare&& :!AGR/12!Patologia!vegetale!
!
TITOLO!TESI!
!
!
EVALUATION& OF& BIOFUNGICIDES& AND& PLANT& DEFENSE&
ELICITORS&
AGAINST&
BACTERIAL&
PATHOGENS&
OF&
AGRONOMIC&IMPORTANCE&
!
!
!
!
Presentata!da:& SET&MADIAN&PEREZ&FUENTEALBA&
&
&
&
&
Coordinatore!Dottorato!
!
!
!
Relatore!
&
Prof.&GIOVANNI&DINELLI& &
&
&
Prof.&ASSUNTA&BERTACCINI&
&
&
&
&
&
&
&
&
&
&
&
&
&
&
&
&
&
&
&
CoLRelatore!
&
&
&
&
&
&
&
&
&
Dr.&ENRICO&BIONDI&
&
& &
ABSTRACT
Plant bacterial diseases are nowadays routinely managed with scheduled treatments based on heavy metal compounds or, in the worst cases, on antibiotics; to overcome the environmental consequences linked to the use of these chemical compounds, such as pollution or selection of antibiotic resistant pathogens, an integrated control management is required. The use of bacterial antagonists, biological agents, plant defence response elicitors or resistant host plant genotypes play an important role in the frame of sustainable agriculture. In this work, the activity of plasma activated water (PAW) and different bioagents aimed to the control of the two bacterial pathogens Xanthomonas vesicatoria and
Pseudomonas syringae pv. actinidiae, causal agents of tomato bacterial leaf spot and
kiwifruit bacterial canker, respectively, were studied. All these tools were assayed for their direct efficacy and for their ability, as elicitors, to trigger the plant immune system against these two bacterial pathogens. Moreover, a study on several Actinidia sp. accessions was carried out to evaluate their susceptibility against bacterial canker of kiwifruit.
PAW resulted unable to direct inhibit X. vesicatoria growth in in vitro assays, however it showed the ability to trigger tomato plant immune system by reducing disease severity up to approx. 38% when tested in three experiments on two tomato genotypes conducted under greenhouse conditions. When tested in in vitro and in vivo experiments against X.
vesicatoria and P. syringae pv. actidinidiae, the tested bioagents, based on natural extracted
compounds or on different strains of Bacillus sp., showed a direct efficacy against both bacterial pathogens. Moreover, they were also able to elicit the plant defence response by significantly lowering the disease severity on tomato and kiwifruit leaves.
In addition, the A. chinensis accession NPK3 resulted the less susceptible to the bacterial canker in comparison to more than 20 accessions tested.
Keywords: kiwifruit bacterial canker, Pseudomonas syringae pv. actinidiae, tomato bacterial leaf spot, Xanthomonas vesicatoria, plasma activated water, Bacillus, bioagents, biological control, induced resistance, kiwifruit susceptibility, RNA extraction, gene expression, RT-qPCR.
TABLE OF CONTENTS
Chapter I. EFFICACY OF PLASMA ACTIVATED WATER AGAINST TOMATO BACTERIAL LEAF SPOT
Page
1. INTRODUCTION 7
2. MATERIALS AND METHODS 9
2.1 Plasma Activated Water 9
2.2 Bacterial strains 10
2.3 In vitro EXPERIMENTS 10
2.3.1 Diffusion method 10
2.3.2 Dilution method 10
2.4 In vivo EXPERIMENTS 11
2.4.1 Pre-treatments and inoculation with the pathogen (Xv) 11
2.4.2 Pathogen isolation and identification 12
2.5 Evaluation of defence related gene transcription 15
2.5.1 Treatments and sample collection 15
2.5.2 RNA Extraction 16
2.5.3 Total RNA quality evaluation and quantification 17
2.5.4 Sequencing of reference/target genes and primer design 17
2.5.5 Reference and target genes cloning 19
2.5.6 Primer design and quantitative RT-PCR (RT-qPCR) 21
2.5.7 Experimental design and statistical analysis 23
3. RESULTS AND DISCUSSIONS 24
Chapter II. EFFICACY OF THE BIOFUNGICIDE V3-2435 AGAINST DIFFERENT BACTERIAL PATHOGENS
1. INTRODUCTION 43
1.3 Bacterial disease control 44
2. MATERIALS AND METHODS 47
2.1 Experimental biostimulant 47
2.2 Bacterial strains 47
2.3 In vitro experiments 47
2.4 In vivo experiments 48
2.4.1 In vivo experiments on tomato plants (direct efficacy against Xv) 48 2.4.2 In vivo experiment on tomato plants (plant resistance induction against Xv) 48 2.4.3 In vivo experiment on kiwifruit plants (direct efficacy against Psa) 50 2.4.4 In vivo experiment on kiwifruit plants (plant resistance induction against Psa) 50 2.4.5 Disease assessments, pathogen reisolation and identification, and statistical
analysis 52
2.4.6 Pathogen isolation and identification 52
2.5 Gene expression in tomato plants 52
2.5.1 Treatments and sample collection 52
2.5.2 RNA extraction, reference/target gene sequencing, primer design and
RT-qPCR assays 53
3. RESULTS AND DISCUSSION 54
Chapter III. EFFICACY OF Bacillus spp. AGAINST BACTERIAL CANKER OF KIWIFRUIT
1. INTRODUCTION 72
2. MATERIALS AND METHODS 76
2.1 Bacterial strains 76
2.2 Efficacy evaluation of biocontrol agents in in vitro experiment 76 2.3 Efficacy evaluation of laminarin based product in in vitro experiment 77 2.4 In vivo experiment on kiwifruit plants (direct efficacy against Psa) 77 2.5 In vivo experiment on kiwifruit plants against Psa (plant resistance induction) 78
2.6 Psa isolation and identification 79
Chapter IV. SUSCEPTIBILITY OF Actinidia spp. ACCESSIONS TO BACTERIAL CANKER
1. INTRODUCTION 89
2. MATERIALS AND METHODS 91
2.1 Bacterial strains 91
2.2 Preliminary experiments 91
2.3 Extended experiments 94
3. RESULTS AND DISCUSSION 95
REFERENCES 101
APPENDIX 123
1. BACTERIOLOGICAL MEDIA 123
2. SALT SOLUTIONS AND BUFFERS 127
3. RNA SEQUENCES 129
4. QUALITY AND PURITY RNA 131
Chapter I
EFFICACY OF PLASMA ACTIVATED WATER AGAINST
TOMATO BACTERIAL LEAF SPOT
1.& INTRODUCTION
The bacterial plant diseases are economically significant problems in the crop production worldwide. Bacterial leaf spots disease on tomato and pepper, caused by Xanthomonas
vesicatoria, is extensively spread in all the areas where these host species are present
(Jones et al., 2000; 2004; EPPO/OEPP, 2013). The lack of availability of effective pesticides and of host resistance for the management of this bacterial disease has stimulated efforts to develop alternative strategies in the framework of an integrated control management (Louws et al., 2001). Usually, integrated control programs for bacterial leaf spot, are based on prophylaxis (seed testing), applications of copper compounds, antagonistic/beneficial bacteria and resistance inducers (Lucas, 1998; El-Hendawy et al., 2005; Byrne et al., 2005; Obradovic et al., 2005).
The plasma is the fourth physical condition of the matter and it exists in many forms in nature - over 99% of the visible matter of the universe, e. g. the sun, lightening and the polar lights (e. g. aurora borealis) - and has a widespread use in science and technology. In 1927, Irving Langmuir adopted the word "plasma" to indicate the fundamental nature of a volume of ionized gas essentially free of space charge (Mott-Smith, 1971; Guy and Miles, 1974). The plasma is formed by mixtures of heavy (positive and negative ions, atoms, free radicals and excited or non-excited molecules) and light (electrons and photons) particles in permanent interaction; all of them are forming an electrically neutral medium. Usually, it is classified in thermal and non-thermal plasma (Moreau et al., 2005; 2008; Nehra et al., 2008; Heinlin et
al., 2010) based on the relative energetic levels, temperature and electronic density
(Petitpas et al., 2007). Thermal plasmas are characterized by an equilibrium or near equality between electrons, ions and neutrals (Nehra et al., 2008); whereas, non-thermal plasma ions and uncharged molecules are more cold than those of thermal, due to the carrier gas (argon, helium, air) which is only slightly ionized (typically 1 part in 1 billion) and therefore,
the ions cool down to the room temperature very rapidly – in fractions of a second (Heinlin
et al., 2010).
Non-thermal atmospheric plasma (NTP) may be obtained by a diversity of electrical discharges, such as corona discharge, micro hollow cathode discharge, atmospheric pressure plasma jet, gliding arc discharge, one atmospheric uniform glow discharge, plasma needle and dielectric barrier discharge (also called DBD) (Liu et al., 1999; Nehra et al., 2008). NTP has been applied in diverse technological areas: industry (Xu, 2001; Paulmier and Fulcheri, 2005; Moreau et al., 2005; 2008; Petitpas et al., 2007; Morent et al., 2008; Nehra et al., 2008), medicine (Moreau et al., 2008; Heinlin et al., 2010; Kostov et al., 2010; Laurita et al., 2015), and also in agriculture. In the last decade different researchers have highlighted the possibility of plasma applications in agronomic/industrial topics such as the inactivation of bacterial pathogens of industrial interest (Erwinia spp.) (Moreau et al., 2005; 2007). Park et al. (2013) evaluated the plasma effect on germination, growth rates, and overall nutritional value of various plant species; moreover, Ma et al. (2015) considered it as an effective method for decontamination of fresh foods. Nevertheless, plasma effectiveness against bacterial plant diseases was not yet well studied. In this last topic, it was employed for activating seed vitality and enhancing the yield of different plant species (Carvalho et al., 2005; Jiang et al., 2014a), for water decontamination (Moreau et al., 2008), and, very recently, seed treatment towards plant disease control (Jiang et al., 2014b).
NTP was recently applied to sterile deionized water (SDW): Park et al. (2013) and Laurita
et al. (2015) established that the chemical properties of PAW are, acidification (pH 2.3),
increase of conductivity, induction of nitrate (NO3-), nitrite (NO2-) (reactive nitrogen species; RNS), and also superoxide radicals (O2•-), hydrogen peroxide (H2O2) and hydroxyl radicals (•OH) (reactive oxygen species; ROS).
This study was aimed to assess the in vitro effect of PAW against Xanthomonas vesicatoria, and its ability, in in vivo experiments, to reduce the severity of bacterial leaf spot disease by eliciting induced resistance. Transcriptomic analyses were also performed to assay the transcription kinetics of different pathogenesis related protein (PR) genes as pr1a, pr4 and
pr5; and also genes coding for lipoxygenase (loxf), phenylalanine ammonia-lyase (pal) and
9
2.& MATERIALS AND METHODS
2.1&Plasma Activated Water (PAW)
PAW was produced following the methodology described by Laurita et al. (2015). NTP was generated employing DBD reactor (Figure 1) belonging to Alma-Plasma group, Faculty of Engineering, University of Bologna, Italy (leaded by prof. Vittorio Colombo). The reactor consisted of a borosilicate glass circular case (94 mm) acting both as a liquid container and dielectric barrier (thickness 2 mm). Sterile Deionized Water (SDW) was treated in a closed environment without recirculation; the volume of the reactor was filled with ambient air, which was used as plasma gas. Two circular aluminum foils acted as electrodes: the liquid-side electrode (diameter 89 mm) was connected to a nanosecond pulsed high voltage generator, while the gas-side electrode (diameter 80 mm) was grounded. The plasma source was driven by generator producing high voltage pulses with a slow rate of few kV/ns and 50 mJ of energy per pulse (FID GmbH – FPG 20-1NMK) (Laurita et al., 2015).
PAW was obtained operating the source at a peak voltage of 20 kV, with a pulse repetition frequency of 1 kHz, an air gap of 1 mm and 60 mL of liquid. SDW was treated for 10 min by cold-plasma (PAW production rate: 60 mL/10 min).
Figure 1. Plasma treatment by DBD reactor for obtaining plasma activated water (PAW). (Laurita et al., 2015).
.
Time [ns]
50 100 150 200 250 300 350 400 -20 -10 0 10 20 -75 -50 -25 0 25 50 75V
ol
ta
ge
[
k
V
]
Cu
rr
en
t [
m
A
]
Fig. 1. Top: schematic (left) and picture during plasma treatment (right) of the DBD reactor;
bottom: voltage (blue), current (red) waveform applied to the plasma source during operation.
2.2 pH and conductivity measurements
pH and electrolytic conductivity measurements of plasma treated solutions were performed
immediately after the treatment by means of pH and conductivity probes (WTW).
2.3 Chemical analysis of reactive species
H
2O
2concentrations were measured using the titanium sulfate test (detection limit 2 μmol/l), while
NO
3-and NO
2-concentrations were measured by means of ion chromatography (detection limit 0,25
μmol/l) [25]; samples were fixed by buffer immediately after being withdrawn from the
plasma-treated solution to avoid the decomposition of the reactive species [25]. For the cases of DIW
treated for 5 or 10 min, a kinetic study of post discharge evolution of reactive species (H
2O
2,NO
2-and NO
3-) was also performed, measuring their concentrations at different delay times (T
d) after
plasma treatment. Moreover, analytic Quantofix test strips were used to perform a semi-quantitative
analysis of the reactive species concentration in treated DIW. Phenol was used as chemical probe
for reactive oxygen and nitrogen species (e.g. hydroxyl radical and NO·/NO2· radicals) formed by
plasma in treated liquids. The concentration of phenol and by-products were analyzed using a
HPLC system (Shimadzu LC-10 Avp) with UV and fluorescence detection (detection limits
0,01-2.2& Bacterial strains
The strain IPV-BO 2684 of Xanthomonas vesicatoria (Xv), isolated from tomato plants showing bacterial leaf spot disease in Italy (Zaccardelli, 1994) and stored in the Phytobacteriology Laboratory (University of Bologna), was grown on glucose-yeast extract calcium carbonate agar (GYCA; Dye, 1962) for 48 h at 27°C, and purified in the same medium to prepare the final bacterial suspensions.
Escherichia coli strain JM109 was used for subcloning the reverse transcriptase (RT)-PCR
products of the ß–act, loxf, pal and erf1 genes; it was grown at 37°C in Luria broth or on Luria agar for 24 h (Sambrook et al., 1989).
2.3& In vitro experiment 2.3.1& Diffusion method
Luria-Bertani (LB) agar medium was prepared (see appendix) and aseptically poured (ca. 25 mL) onto Petri plates (diameter 9 cm). From a bacterial water suspension (107 UFC/mL), calibrated at the spectrophotometer (OD = 0.01600nm), 200 µL were inoculated and spread on LB plates. An antibiogram disc (diameter 0,9 cm) was then kept into the middle of the plates and a drop, containing the treatment (all treatments are shown in Table 1), was put on the antibiogram disc. The plates were then incubated for 24 h at 27°C. The antibacterial effect, shown as an inhibition halo, was then measured (cm) by subtracting the antibiogram disc diameter from the halo diameter. The assay was repeated 3 times, and standard deviations were calculated.
2.3.2& Dilution method
LB broth medium was autoclaved and aliquots were divided into 15 mL sterile Falcon tubes (50 mL). The different treatments that were added to Falcon tubes before bacterial inoculation are shown in Table 1. From a bacterial aqueous suspension (OD600nm = 0.1; approx. 108 UFC/mL), 150 µL were inoculated into each tube obtaining a final population of approx. 106 CFU/mL. All Falcon tubes were then incubated in rotative incubator at 27°C for 24 h at 80 rpm. The bacterial population of each tube was evaluated at 0 h and 24 h by
dilution were dropped in GYCA medium; the plates were incubated at 27°C for 48-72 h and the bacterial populations were evaluated by counting the colonies. The assay was repeated 3 times, standard deviations were calculated and data were elaborated with ANOVA test (p 0.05).
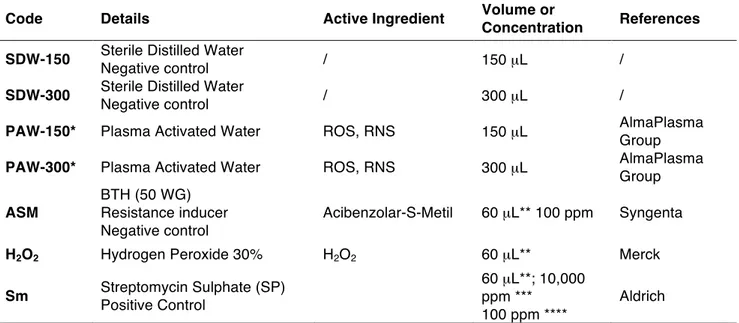
Table 1. In vitro treatments used for diffusion and dilution methods against Xanthomonas
vesicatoria strain IPV-BO 2684.
Code Details Active Ingredient Volume or
Concentration References SDW-150 Sterile Distilled Water
Negative control / 150 µL /
SDW-300 Sterile Distilled Water
Negative control / 300 µL /
PAW-150* Plasma Activated Water ROS, RNS 150 µL AlmaPlasma Group PAW-300* Plasma Activated Water ROS, RNS 300 µL AlmaPlasma Group ASM
BTH (50 WG) Resistance inducer Negative control
Acibenzolar-S-Metil 60 µL** 100 ppm Syngenta
H2O2 Hydrogen Peroxide 30% H2O2 60 µL** Merck
Sm Streptomycin Sulphate (SP) Positive Control 60 µL**; 10,000 ppm *** 100 ppm **** Aldrich
WG (Water granulate); SP (Soluble Powder); ROS (Reactive Oxygen Species); RNS (Reactive Nitrogen Species)
(*) PAW was applied both in diffusion and dilution methods within 1 hour from its production (**) volume used in diffusion method; (***) concentration used in diffusion method; (****) concentration used in dilution method
2.4& In vivo experiments
2.4.1 Pre-treatments and inoculation with the pathogen (Xv)
Under controlled conditions (Figure 2), three experiments were carried out on tomato plants disposed in randomized blocks (3 plants X 4 blocks/treatment): tomato cultivars, treatments, number of the applications, modes and times of application are shown in Table 2.
The plants to be treated at root apparatus were uprooted at 3rd-4th leaf stage and the roots were soaked for 10 min into PAW, SDW (negative control), ASM (positive control) and then put back into the pots; moreover, ASM and SDW were also applied at the leaf surface using
carried out spraying a water suspension (OD600nm = 0.01; ca. 107 CFU/mL), containing the pathogen strain IPV-BO 2684, on the leaf surfaces; tomato plants were then sealed in polyethylene (PE) bags for two days to favour the water congestion and to allow the pathogen penetration. The disease assessments were carried out by counting the leaf spots (on 4 to 6 leaves/plant) 21 days after the experimental inoculation. The controlled conditions, hold until disease assessment, were 16 h of day light and 8 h of darkness, 30°C and 24°C during day and night respectively; moreover, the relative humidity was maintained up to 70-75%. Data were then elaborated with ANOVA test (Tukey HSD, p 0.05).
Figure 2. In vivo experiment: tomato plants cv. Moneymaker inoculated with Xanthomonas
vesicatoria strain IPV-BO 2684 after treatments applied at root apparatus.
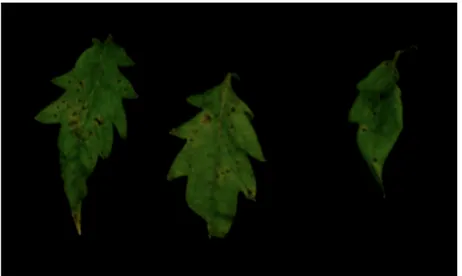
2.4.2 Pathogen isolation and identification
Selected symptomatic leaf samples (Figure 3) were used for Xv isolation and identification. Leaf surface was sterilized with 2% sodium hypochlorite. Necrotic lesions were aseptically collected and crushed into a mortar with 2 mL of SDW; 30 µL of the extract were dropped on GYCA medium and incubated up to 48-72 h. Xv-like colonies were subcultured and identified with molecular assays (Koenraadt et al., 2009; EPPO, 2013).
Figure 3. Bacterial leaf spot severity caused by Xanthomonas vesicatoria strain IPV-BO 2684 experimentally inoculated on tomato plants under greenhouse conditions.
Table 2. Experiments and treatments carried out on tomato plants under greenhouse conditions.
Code TREATMENTS
Details Types of application Volume (mL/plant) or Concentration (ppm)
Application timing
(hours or days)
Experiment 1. Tomato cv. Moneymaker
SDW-R Sterile Distilled Water Drench 500 mL 6 d BPI
SDW-L Sterile Distilled Water Leaf spray ca. 50 mL/plant 24 h BPI
PAW-R Plasma Activated Water Drench 500 mL 6 d BPI
PAW-RW Plasma Activated Water Drench+ irrigation 500 mL + 50 mL/plant 6 d BPI; 2 d API
ASM-R BTH 50 WG Drench 500 mL (a.i.75 ppm) 7 d BPI
ASM-L BTH 50 WG Leaf spray ca. 50 mL/plant (a.i. 75 ppm) 7 d BPI
Sm Streptomycin Sulphate (SP) Leaf spray ca. 50 mL/plant (a.i. 100 ppm) 24 h BPI
Experiment N°2. Tomato cv. VF-10
SDW-R Sterile Distilled Water; Drench 500 mL 6 d BPI
PAW-R Plasma Activated Water Drench 500 mL 6 d BPI
PAW-R10 Plasma Activated Water Drench 10 min later PAW-R 500 mL 6 d BPI
ASM-R BTH 50 WG; Drench 500 mL (a.i. 75 ppm) 7 d BPI
Experiment N°3. Tomato cv. Moneymaker
SDW-R Sterile Distilled Water; Drench 500 mL 14 d BPI
PAW-R Plasma Activated Water Drench 500 mL 14 d BPI
PAW-RW Plasma Activated Water Drench+irrigation 500 mL + 50 mL 14 d; 9 d BPI
PAW-RWW Plasma Activated Water Drench+irrigation+irrigation 500 mL + 50 mL+50 mL 14 d; 9 d ; 4 d BPI
ASM-R BTH 50 WG; Drench 500 mL (a.i. 75 ppm) 7 d BPI
(R) application at root apparatus; (RW) 1°application at root apparatus + 2° application watering with 50 mL; (RWW) 1°application at root apparatus + 2° application watering with 50 mL + 3° application watering with 50 mL (L) Leaf application with sprayer. (BPI) Before pathogen inoculation; (API) After pathogen inoculation. (*) PAW was applied within 1 hour from its production. (a.i.) active ingredient.
2.5 Evaluation of defence related gene transcription 2.5.1 Treatments and sample collection
Tomato plants (cv. Moneymaker, 2 plants x 2 blocks/treatment) at 3rd-4th leaf stage maintained under controlled conditions (Figure 4), were uprooted and treated by root drenching and/or irrigation as shown in Table 3. Negative controls consisted in non-treated (NT) tomato plants and plants treated by drenching the root apparatus in sterile distilled water (SDW).
Table 3. Treatments carried out on tomato plants for evaluation of PRs gene transcription under greenhouse conditions.
Code TREATMENTS Details Types of application Volume (mL/plant) Concentration (ppm) SDW-R Sterile Distilled Water Drench 500 mL
PAW-R Plasma Activated Water Drench 500 mL
PAW-RW* Plasma Activated Water Drench+irrigation 500 mL + 50 mL/plant
JA Jasmonic Acid, Sigma cod.
J2500 Drench 500 mL (a.i 100 mM)
ASM-R BTH 50 WG, Syngenta Drench 500 mL (a.i.75 ppm)
NT Non treated / /
(*) Watering consisted in 50 mL/plant at 120 h from initial treatments. (a.i.) active ingredient.
Three youngest tomato leaves were collected from each replicate/treatment at six time-points: 0, 7, 24, 48, 120 h and 8 d. The tissues were flash frozen in liquid nitrogen and stored at -80°C until RNA extraction. The greenhouse conditions were set as 16 h light at 25°C and 8 h dark at 19°C, maintaining a RH% of approx. 85% until the last leaf collection day.
Figure 4. Tomato plants cv. Moneymaker treated at root apparatus at 3rd-4th leaf stage grown under greenhouse conditions for analysis of defence related gene transcription.
2.5.2 RNA Extraction
Total RNA extraction was carried out by Qiagen RNeasy Plant minikit (cat.: N° 74904); the RNase-Free DNase Set (Qiagen; cat. No. 79254) was used in combination with Qiagen RNeasy Plant minikit to assess DNA digestion. Procedure consisted in grounding ca. 100 mg of tomato leaves stored at -80°C in liquid nitrogen using pre-chilled mortar and pestle. The powdered tissue was added with 1.2 mL of extraction buffer (see appendix), and then homogenized. The extract was transferred into 2 mL Eppendorf tube and centrifuged at room temperature at 17,500 g for 5 min; 1 mL of supernatant was added with 100 µL of Na-lauroyl sarcosine (30%; see appendix) and mixed by inversion. The sample was then incubated at 70°C for 30 min.
The total volume of the extract, was placed into QIA shredder spin columns and centrifuged at 17,500 g for 2 min. The supernatant was loaded into a 1.5 mL Eppendorf tube and amended with 0.5 volume of absolute ethanol; the mixture was then homogenized. 700 µL of the mixture were transferred into RNeasy spin column, centrifuged at 9,900 g for 1 min; the flow-through was discarded. This step was repeated using the remaining part of the mixture.
From this step the kit RNase-Free DNase Set was applied to digest co-extracted DNA. RNeasy spin column was washed by adding 350 μL of buffer RW1, and centrifuged for 15
and 70 μL of buffer RDD was prepared and mixed by inverting the tube. DNase I incubation mixture (80 μL) was directly added to the membrane of RNeasy spin column, and incubated at room temperature for 15 min. Buffer RW1 was added (350 μl) to the column membrane and then centrifuged for 15 s at 8,000 g; the flow-through was discarded. The extraction continued using Qiagen RNeasy Plant minikit following the instructions of the manufacturer. The total RNA (50 μL of nuclease free distilled water) was stored at -20°C.
2.5.3 Total RNA quality evaluation and quantification
Quantity and quality (A260nm/A280nm) of the RNA extracts (3 μL) were evaluated using Tecan Infinite® 200 Pro NanoQuant instrument and i-control™ software (Tecan Group Ltda., Switzerland). The quality was also assayed by loading 5 μL of RNA extracts into a 1.2% agarose gel: the electrophoresis was carried out at 40 V for 100 min in TAE buffer. The gel was stained in ethidium bromide solution (0.03%) for 20 min and distained in distilled water for 5 min; visualisation was then carried out under UV light (312 nm).
2.5.4 Sequencing of reference/target genes and primer design
RT-PCR on RNA plant extracts from tomato plants treated with ASM, were performed as follows: reverse transcription was carried out in a final volume of 5 μL containing 1x Buffer (Promega, cod. M531A), 1 mM dNTPs (Cod. U1330, Promega); 50 μM random oligo-dT primer (Roche Diagnostic, cod. 11034731001), 50 U of M-MLV reverse transcriptase (Moloney Murine Leukemia Virus Reverse Transcriptase; Promega, cod. 1705A,); 0.5 μL of RNA template were used. The thermal profile was: 37°C for 60 min and at 94°C for 5 min to inactivate M-MLV enzyme.
The PCRs were performed using 5 μL of cDNA samples, in a final volume of 25 μL which contained 1× PCR Go Taq Flexi buffer (Promega, 5X Colorless GoTaq Flexi Buffer, M890A), 2 mM MgCl2, 0.4 mM dNTPs, 0.2 µM each primer, 1 U Go-Taq Flexi DNA polymerase (Promega, cod. M830A). The primers used to obtain reference/target gene sequences were from studies carried out on Moneymaker (Biondi, 2008) and Craigella tomato plants (Danve, 2010). The design of new primers, performed on NCBI sequences, was carried out using Lasergene 7.0 software (Table 4).
The thermal profiles were set up depending on the primer sequences as follows:
•! Act3-fw and Act3m-rev primers: initial denaturation step (94°C for 5 min), followed by 35 cycles at 94°C for 1 min, 67°C for 30 s, 72°C for 30 s, and a final extension step for 10 min at 72°C.
•! LoxF6-fw and LoxF6-rev primers: initial denaturation step (94°C for 5 min), followed by 35 cycles at 94°C for 1 min, 65°C for 30 s, 72°C for 30 s, and a final extension step for 10 min at 72°C.
•! ERF1.8-fw and ERF1.8-rev primers: initial denaturation step (94°C for 5 min), followed by 35 cycles at 94°C for 1 min, 50°C for 1 min, 72°C for 1 min, and a final extension step for 10 min at 72°C.
•! IDT130 and IDT132 primers: initial denaturation step (94°C for 5 min), followed by 35 cycles at 94°C for 1 min, 55°C for 1 min, 72°C for 1 min, and a final extension step for 10 min at 72°C.
The amplification products were analyzed on 1.5% (w/v) agarose gel in 1x TAE buffer, stained with 0.03% ethidium bromide and visualised under UV light (312 nm).
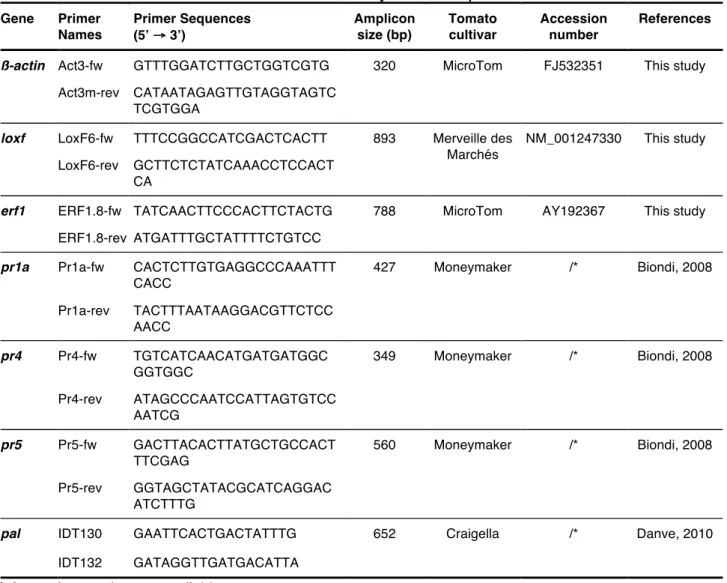
Table 4. Primers used to obtain tomato cv. Moneymaker sequences. Gene Primer Names Primer Sequences (5’ → 3’) Amplicon size (bp) Tomato cultivar Accession number References
ß-actin Act3-fw GTTTGGATCTTGCTGGTCGTG 320 MicroTom FJ532351 This study
Act3m-rev CATAATAGAGTTGTAGGTAGTC TCGTGGA
loxf LoxF6-fw TTTCCGGCCATCGACTCACTT 893 Merveille des
Marchés
NM_001247330 This study LoxF6-rev GCTTCTCTATCAAACCTCCACT
CA
erf1 ERF1.8-fw TATCAACTTCCCACTTCTACTG 788 MicroTom AY192367 This study
ERF1.8-rev ATGATTTGCTATTTTCTGTCC
pr1a Pr1a-fw CACTCTTGTGAGGCCCAAATTT
CACC 427 Moneymaker /* Biondi, 2008 Pr1a-rev TACTTTAATAAGGACGTTCTCC AACC pr4 Pr4-fw TGTCATCAACATGATGATGGC GGTGGC 349 Moneymaker /* Biondi, 2008 Pr4-rev ATAGCCCAATCCATTAGTGTCC AATCG pr5 Pr5-fw GACTTACACTTATGCTGCCACT TTCGAG 560 Moneymaker /* Biondi, 2008 Pr5-rev GGTAGCTATACGCATCAGGAC ATCTTTG
pal IDT130 GAATTCACTGACTATTTG 652 Craigella /* Danve, 2010
IDT132 GATAGGTTGATGACATTA (*) Accession number not available.
2.5.5 Reference and target genes cloning
The amplified RT-PCR band was extracted and purified from gel using Kit Wizard SV Gel and PCR Clean-Up System (Promega cod. A9281) following the manufacturer’s protocols. The purified amplicon (3 μL) was recombined in pGEM-T plasmid pGEM-T Easy Vector System (Promega, cod. A1360), following the manufacturer’s protocols. The reaction was incubated at 4°C overnight.
Transformation was performed using the recombinant plasmid pGEM-T and strain JM109 strain of E. coli through electroporation and thermoporation (Sambrook and Russell, 2001) as follows:
•! Electroporation. Electrocompetent cells were prepared according to Sambrook and Russell (2001) protocol. The electroporation was achieved in an electroporation cuvette (0.1 cm diameter), using 20 ng of recombinant plasmid and the following profile: in the Gene Pulser II (Bio-Rad) electroporator the resistance was set up at 400 Ω (ohm), the capacitance at 125 μF and the voltage was set at 18 kV.
•! Thermoporation. Ligase reaction (3 μL, containing the recombinant plasmid) was added to 100 μL of JM 109 competent cells, prepared following Sambrook and Russell (2001) protocol. The reaction was incubated on ice for 30 min. Successively, the samples were kept in a thermoblock for 90 s at 42°C and transferred to ice for 2 min.
For both methods, the transformed bacterial cells were grown in 900 μL of SOC broth (see appendix). The samples were kept in a shaker at 37°C for 2 h, and centrifuged for 5 min at 14,000 rpm; then, 400 μL of the supernatant were removed and the pellet was resuspended in the remaining supernatant (600 μL). Petri plates containing LB medium amended with ampicillin (100 μg/mL), IPTG (isopropy-β-D-thiogalactopyranoside, 0.5 mM) and X-Gal (5-bromo-4-chloro-3-indolyl-β-D-galactoside, 80 μg/mL) (see appendix) were inoculated by spreading 200 μL and 400 μL of bacterial resuspension. The plates were incubated at 37°C overnight.
The transformation and recombination were verified by colony morphology: blue colonies indicated transformation, but not plasmid recombination, whereas, white colonies indicated that the insert was inserted into the plasmid.
The transformed white colonies were sub-cultured at 37°C for ca. 16 h, collected with a toothpick and suspended in 50 μL of SDW. The bacterial suspension was lysated in a thermoblock at 100°C for 5 min and then immediately put in ice for 5 min and finally centrifuged at 13,000 rpm for 1 min. PCR assays were performed using 5 μL of the supernatant with chemical and thermal profiles depending on markers (internal primers) characteristics (Paragraph 2.5.4, Table 4).
The recombinant plasmid was also purified with Wizard Plus SV Minipreps DNA purification System Kit (Promega, cat. A1330). Ten mL of 24 h bacterial suspension were centrifuged at 10,000 g for 5 min. The pellet was resuspended in 250 μL of Cell Resuspension Solution.
four-times and an incubation for 5 min at room temperature followed. Alkaline Protease Solution (10 μL) was added and mixed by inverting the tube four times; the solution was incubated for 5 min at room temperature. Then, 350 μL of Neutralization Solution were added and mixed by inverting the tube; the sample was centrifuged at room temperature at maximum speed (14,000 g) for 10 min. The supernatant (850 μL) was transferred to a Spin Column, supplied by the kit, and it was centrifuged at 14,000 rpm for 1 min at room temperature; the flow-through was eliminated. The membrane column was then washed, by adding 750 μL of Column Wash Solution, and then centrifuged for 2 min at 14,000 rpm (room temperature). The membrane was transferred in sterile Eppendorf tube and successively added with 100 μL of nuclease free water. The tube was centrifuged for 1 min at 14,000 rpm. The column membrane was removed and the eluate, containing the recombinant plasmid, was stored at -20°C.
The extracted recombinant plasmid (200 ng) was digested with 6 U of EcoRI 37°C for 3 h. Restriction products were separated in 0.8% (w/v) agarose gel, stained and visualised as described above.
2.5.6 Primer design and quantitative RT-PCR (RT-qPCR)
From tomato cv. Moneymaker plant extracts, RT-PCR product sequences of the reference gene ß-actin, as internal control (Danve, 2010; Murshed et al., 2013), and of the target genes
pr1a, pr4, pr5, pal, loxf and erf1 were employed for primer design using Primer Express 2.0
software (Applied Biosystems, Foster City, CA). All the primers used for RT-qPCR are listed in Table 5.
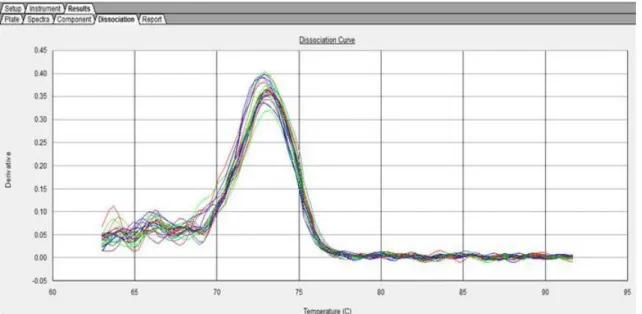
The RT-qPCR was performed using an ABI7000 v 1.2.3 sequence detection system. Each reaction was carried out with one-step method, in a final volume of 25 µL containing 1 U M-MLV (Promega, cod. 1705), 12.5 µL GoTaq qPCR Master Mix (Promega, No. A6001, SYBR Green/ROX chemistry), 0.25 µL CXR reference dye, primers at 400 nM (Invitrogen, cod. A967) and 1 µL of RNA template (100 ng/µL). The primers specificity was evaluated on RNA extracts by dissociation curves analysis, in order to exclude non-specific amplifications or primer dimers presence (Figure 5).
Table 5. RT-qPCR primer sequences designed on the gene sequences obtained from tomato cv. Moneymaker. Gene Primer Name Primer Sequence (5’ - 3’) Dissociation curve (°C) References
ß-actin ACTFRt.1 AGCTCCTCCATTGAAAAGAACTATG
76.0 This study ACTRRt.1 GGTAATAACTTGTCCATCAGGCAA pr1a Pr1FRt21 TGTTGGTGGAAAAATGTGTGGA 77.0 Biondi, 2008 Pr1RRt21 GAGTTGCGCCAGACTACTTGAGT pr4 Pr4FRt21 TATGAACGTTAGGGCAACGTATCA 75.0 Biondi, 2008 Pr4RRt21 CAGTTTATGTTTTGCGGATTGTACA pr5 Pr5FRt21 CCAGTTTAGCAACCTAGATTTCTGG 75.0 Biondi, 2008 Pr5RRt21 TTAAATCCATCGACTAAAGAAATGTCC
pal PALFRt.2 TCAGCACTTTGGACATGGTTAGTC
76.0 This study PALRRt.2 AGAACTTCAATTCCTTGCAAATCC
loxf LOXFRt.1 AGCAAGCTAGACCCTGAGGTATATG
77.0 This study LOXRRt.1 TTTTGTAATTGCTGATTCAGGAGGT
erf1 ERFFRt.2 AACTCAATGGCTAGGGCTTGTTT
76.0 This study ERFRRt.2 TTTGCTATTTTCTGTCCACTTCAAAG
The thermal profile was set up as follows: 30 min at 48°C (reverse transcription), 95°C for 10 min (Taq activation), followed by 40 cycles of 95°C for 10 s (denaturation), and 60°C for 1 min (annealing/extension). Dissociation curves were performed at 95°C for 15 s, 60°C for 20 s and 95°C for 15 s.
2.5.7 Experimental design and statistical analysis
Data were analyzed using SDS1.2 software (Applied Biosystems). The efficiency of each primer pair was determined using RNA ten-fold dilution series (calibration curves) to determine the fold changes. Exponential amplification was plotted on a logarithmic scale, and Rn was set to 0.32 for each RT-qPCR plate to obtain the cycle threshold (Ct) values. Ct values for all the gene studied were normalized to the reference gene β-actin (internal control) to evaluate possible variation between different RNA samples.
The experiment was replicated three times per time point, moreover the analysis of target gene expression, related to the reference gene (ß-actin), was determined using the 2-ΔΔCt method (Livak and Schmittgen, 2001). All gene expression levels were normalized to the appropriate non-treated (NT) control at each time point (0, 7, 24, 48, 120 h and 8 d). Standard errors (SE) were calculated to evaluate statistically significant differences among samples.
3.! RESULTS AND DISCUSSION
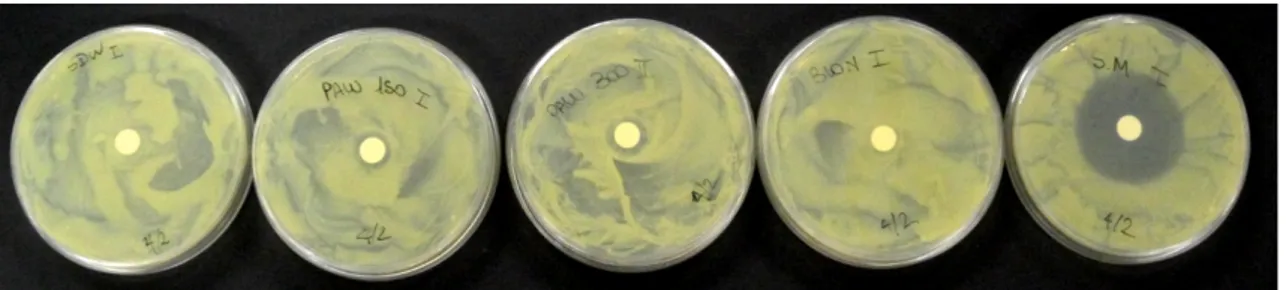
The results highlighted that PAW, as well as negative controls (SDW and ASM), was not able to inhibit the Xv growth in in vitro experiments using the diffusion method (Table 6). Meanwhile, the positive controls (Sm and H2O2) produced a mean inhibition halo of 3.0 cm and 3.8 cm, respectively (Figure 6).
Table 6. Results on in vitro PAW efficacy tested against Xanthomonas vesicatoria on LB-agar.
Treatments Xanthomonas vesicatoria
IPV-BO 2684 SDW-150 PAW-150 PAW-300 ASM H2O2 Sm - - - - + (3.8 cm) + (3.0 cm) (-) non inhibited growth; (+) inhibited growth
Figure 6. PAW efficacy evaluated by diffusion method on Luria-Bertani agar medium, inoculated by Xanthomonas vesicatoria strain IPV-BO 2684 (200 µL; 109 UFC/mL).
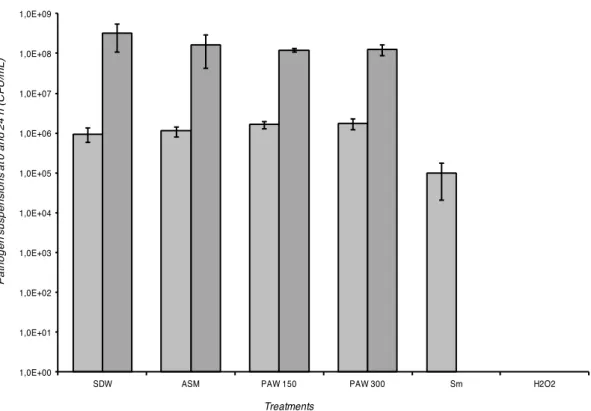
In vitro assays, carried out using the dilution method, confirmed the results obtained with
the diffusion method: PAW did not show effect against the Xv strain. At 0 h PAW 150, PAW 300 treatments as well as SDW and ASM did not show any inhibition of the bacterial growth: for those treatments Xv population was evaluated at ca. 106 UFC/mL (Figure 7), whereas for positive controls, represented by hydrogen peroxide and streptomycin sulphate at the same time point (0 h), the bacterial population was inhibited and resulted to be 0 and approx. 105 CFU/mL, respectively. After 24 h, the PAW treatments and the negative controls (SDW and ASM) did not inhibit the bacterial growth, the population reached ca. 108 CFU/mL, while in the positive controls Xv population was completely killed (Figure 7).
Figure 7. Results of PAW in vitro efficacy using dilution method against Xanthomonas
vesicatoria strain IPV-BO 2684: at 0 h (light grey histograms), at 24 h (dark grey histograms).
Each column represents the mean of 3 replicates and standard deviations (±SD).
In a recent work (Laurita et al., 2015), in which the efficacy of PAW against Candida albicans and Staphylococcus aureus was studied using the dilution method, it was pointed out that the loss of PAW efficacy was related to the post discharge time. After 16 minutes, a minimal
-1,0E+00 1,0E+01 1,0E+02 1,0E+03 1,0E+04 1,0E+05 1,0E+06 1,0E+07 1,0E+08 1,0E+09
SDW ASM PAW 150 PAW 300 Sm H2O2
P a th o g e n su sp e n si o n s a t 0 a n d 2 4 h ( C F U /m L ) Treatments
instruments, therefore PAW did not show any efficacy against the two pathogens. In this study, the in vitro experiments were carried out after 30 up to 50 minutes from the discharge: this explained the lack of PAW efficacy against Xv. In addition, the method used for these in
vitro experiments was based on guidelines suggested by Clinical and Laboratory Standards
Institute (CLSI, formerly NCCLS, 2006) that differ from the methods proposed and used in the other studies in which PAW was employed (Julák et al., 2012; Laurita et al. 2015; Traylor
et al., 2011). The latter studies took into account not just the time occurring between the
PAW production and its use in in vitro experiments, but also the effect of exposure time of the bacterial suspension to higher volumes of PAW. Traylor et al. (2011) demonstrated that PAW, produced 7 days before its application using dilution method, was effective inhibiting
E. coli growth depending on its exposure time to the treatment.
The presence of minimal concentration of H2O2 and NO2-, and low pH (Laurita et al., 2015; Scholtz et al., 2015) suggested a different way for PAW employment in controlling plant pathogens i.e. through a defence mechanism mediated by the plant host. The typical characteristic of an elicitor for plant resistance induction is in fact, its low concentration (Agrawal et al., 1999; Shibuya and Minami, 2001). Moreover, the ROS (O2, OH, O2H) is known to be one of the upstream responses of the plant during a pathogen attack (Peng and Kuć, 1992; Doke, 1983; Grant et al., 2000; Miller et al., 2009).
The three in vivo experiments that were conducted on tomato plants were aimed, indeed, to evaluate the indirect effect of PAW (treated at the roots) against Xv, through the host induced resistance.
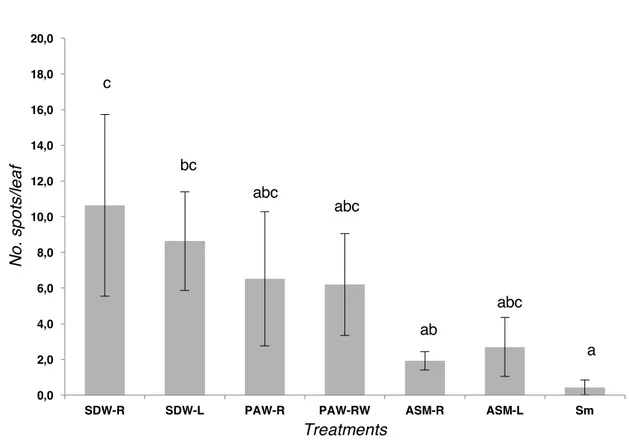
In the first experiment, the disease severity of Moneymaker tomato plants treated with PAW-R and PAW-PAW-RW resulted slight lower significantly (approx. 6.5 and 6 spots/leaf, respectively) than that of tomato control plants represented by SDW-R and SDW-L (11 and 9, respectively); the relative protection (related to SDW-R) provided by both PAW root treatments was approx. 30%. The efficacy of both PAW treatments was almost equivalent and no statistical difference between them was observed. On the other hand, the plants treated both at leaves and roots with the resistance inducer (ASM, positive control), showed a disease severity significantly reduced, ca. 2 and 3 spots/leaf, respectively (Figure 8). Moreover, the relative protection provided by both positive controls was calculated as
bacterial diseases (Oostendorp et al., 2001; Biondi et al., 2006; 2009; Cellini et al., 2014), and in particular, against tomato bacterial diseases (Thaler et al., 1999; Louws et al., 2001; Graves and Alexander, 2002; Obradovic et al., 2005; Herman et al., 2007). Between ASM-L and ASM-R, two of the three positive controls used in the experiment, there was not statistical difference, even though ASM-R (ASM treated by drenching the roots) apparently reduced the disease severity when compared with the plants treated with ASM-L (ASM treated at the leaves). Plants treated with streptomycin sulphate (positive control) showed the significant lowest disease severity since the mean number of leaf spots was 0.4 (Figure 8).
Figure 8. Results of the in vivo efficacy of plasma activated water (PAW), compared to the negative and positive controls, against bacterial leaf spot caused by Xanthomonas
vesicatoria (strain IPV-BO 2684) on tomato plants cv. Moneymaker grown under
greenhouse conditions. Different letters indicate significant differences (Tukey's HSD, p 0.05). 0,0 2,0 4,0 6,0 8,0 10,0 12,0 14,0 16,0 18,0 20,0
SDW-R SDW-L PAW-R PAW-RW ASM-R ASM-L Sm
N o . sp o ts/ le a f Treatments a abc ab bc c abc abc
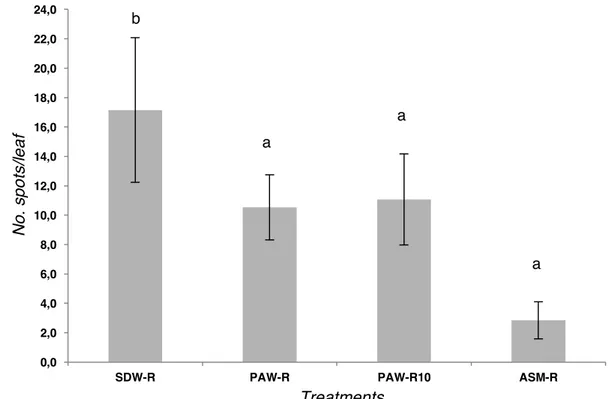
The results of the second experiment, carried out on tomato plants VF10, confirmed those obtained on Moneymaker plants. The bacterial leaf spot severity caused by the strain IPV-BO 2684 was significantly reduced on plants treated at the roots with PAW: the number of spots per leaf was ca. 10.5 and 11 in the plants treated with PAW-R and PAW-R10, respectively. The relative protection (related to negative control SDW-R) was confirmed and improved to approx. 35% (Figure 9). Moreover, no significant differences were evaluated in disease severity between the PAW treatments. The plants treated with SDW-R showed significantly higher disease severity (approx. 17 spots/leaf).
In the tomato plants treated with ASM by drenching the roots, the leaf spot disease severity caused by Xv was significantly reduced (approx. 3 spots per leaf). The treatments PAW-R and PAW-R10 fell into the same category (Tukey's HSD, p 0.05) of the positive control treatment represented by ASM-R (Figure 9).
Figure 9. Results of the in vivo efficacy of plasma activated water (PAW), compared to negative and positive controls, against bacterial leaf spot caused by Xanthomonas
vesicatoria (strain IPV-BO 2684) on tomato plants cv. VF-10 grown under greenhouse
conditions. PAW-R only drenching (14 days BPI), PAW-RW (root drench + irrigation) (14 d and 9 d BPI). Different letters indicate significant differences (Tukey's HSD, p 0.05).
0,0 2,0 4,0 6,0 8,0 10,0 12,0 14,0 16,0 18,0 20,0 22,0 24,0
SDW-R PAW-R PAW-R10 ASM-R
N o . sp o ts/ le a f Treatments b a a a
The third experiment on tomato, again on cv. Moneymaker, was conducted to evaluate the effectiveness in disease protection of PAW at different combinations, types and times of application. The plants treated 14 days BPI (PAW-R) showed a disease severity (mean of approx. 15 spots/leaf) which resulted significantly similar to that of positive control plants (SDW-R, mean of approx. 12 spots/leaf). On the contrary, the disease severity of the tomato plants treated with PAW-RW and PAW-RWW (ca. 8 and 10 spots/leaf, respectively) resulted between the SDW-R and the negative control (ASM-R, approx. 4 spots/leaf) in a significant manner (Figure 10). These results confirm those obtained in the first experiment in which the relative protection by PAW-R treatment, was calculated as approx. 30% (Figure 8): in this experiment, the relative protection of PAW-RW, apparently the best of the PAW treatments, was ca. 38%. PAW-RWW (the most similar to PAW-RI, Table 2) did not show an adequate relative protection (approx. 20%), as also evidenced in the first experiment. The positive constant that was observed in all the experiments carried out in planta using PAW, was the absence of phytotoxicity and the lack of reduction in the vegetative growth, as was instead rarely observed in plants treated with ASM-R.
The PAW treatments therefore show to induce a stable plant-mediated defence response. The ROS and/or RNS, components of PAW, might be linked to signalling pathways that establish a correlation between the disease reduction and the activation of pathogenesis-related protein and defence enzymes on tomato. These results induced to analyse more deeply the effect of PAW treatments on tomato plants by carrying out transcriptomic analyses of genes related to the tomato plant induced resistance.
Figure 10. Results on application frequency of plasma activated water (PAW) against bacterial leaf spot caused by Xanthomonas vesicatoria (strain IPV-BO 2684) on tomato plants cv. Moneymaker grown under greenhouse conditions. PAW-1 only drenching (14 days BPI), PAW-RW (drench+irrigation) (14 d and 9 d BPI), PAW-RWW drenching+watering repeated twice (14 d, 9 d and 4 d bpi). ASM-R and SDW-R represented the positive and negative controls. Different letters indicate significant differences (Tukey's HSD, p 0.05).
0,0 2,0 4,0 6,0 8,0 10,0 12,0 14,0 16,0 18,0 20,0 22,0 24,0
SDW-R PAW-R PAW-RW PAW-RWW ASM-R
N o . sp o ts/ le a f Treatments b a b ab ab
In Figure 11 are shown the RNA extracts used in the RT-qPCR: the integrity of purified RNA is critical to all gene expression analysis techniques to obtain meaningful gene expression data (Fleige and Pfaffl, 2006; Pfaffl, 2005). The quality and quantity of RNA extracts are also reported in Appendix.
Figure 11. Total RNA extracted quality run in 1.2% agarose gel.
First, the ß-actin was confirmed as a reliable reference gene, because its abundance in PAW treatments, in the negative (NT and SDW-R) and positive (ASM and JA) control plants was equivalent. The data here presented show the change in transcript abundance of the studied genes in all the different treatments studied. The use of the negative control treatment (SDW-R), whose type of application was similar to that of the other treatments (PAW, ASM and JA), allowed to measure the real intensity of the plant defence response. The plant stress, in fact, caused by the type of treatment application (e.g. tomato plant explants and subsequent root drenching) could have influenced some gene induction. Indeed, the SDW-R control was included in the gene expression studies to ensure that results accurately reflected the host response to the treatment alone (Smart et al., 2003).
ASM application (positive control for SAR), as expected, triggered the expression of PRs in the considered time intervals. Referring to PR-1a (acid PR-1), and PR-4, gene expression kinetics showed a general significant increase in tomato plants 120 h after ASM root application up to 8 days (Figures 12 and 13). The PR-5 resulted significantly inducted (approx. 90-fold) only after 8 days from ASM application (Figure 14). In the plants treated with JA (positive control for ISR) the PR-1a, PR-4 and PR-5 induction was not observed up to the 8th day (Ciardi et al., 2000; 2001). The only exception is represented by the tomato plants tested 7 hours after treatment; in those cases, the expression of PR-1a, PR-4 and PR-5 were approx. 35-, 8- and 10-fold. The decrease of PR-1a observed from 7 h and up to 48 from ASM application is partially contradictory in the initial stages of PR-1a induction according to what was reported by Biondi (2008) and Herman et al. (2007); however, the upregulation of the transcript abundance after 5 days is closely related to the present results. The early expression of PR-1a in those studies should be attributed to the ASM mobilization in the plant, that was described within 2 h from the application in tomato leaves (Scarponi et
al., 2001). After 120 h and 8 d the PR-1a induction was demonstrated, confirming the ability
of ASM as an effective elicitor in inducing host resistance; effectiveness that was also confirmed by the in vivo experiments against bacterial leaf spot and reported in previous works (Louws et al., 2001; Graves and Alexander, 2002).
A different expression pattern was observed for LOXF, PAL and ERF1 (Figures 15, 16 and 17). The plants treated with ASM, showed a relevant induction of these genes at 120 h after treatment, but this induction constantly decreased up to the 8th day: the LOXF, PAL and ERF1 expression, in fact, was close to the baseline; nonetheless, PAL induction at the last point time (8 d after treatment) of PAW treated plants, remained still significantly higher compared to the one of the control plants (SDW-R, Figure 16).
Concerning the Moneymaker plants treated with JA, the PR-1a, PR-4 and PR-5 expression was ca. 35-, 6- and 10-fold, respectively, after 7 hours from the treatment, but it was close to 0-fold at each time point up to the 8th day. In particular, the behavior of PR-1a kinetic expression in plants treated with JA is fully in agreement with known JA characteristics since it can suppress the induction of mRNA encoding the PR-1a (Thaler et al., 1999; Ciardi et al., 2000). The jasmonate pathway is reported as ISR inducer that stimulates other PRs (i.e. PR-4) and enzymes (i.e. LOXF) (Smart et al., 2003; Choudhary et al., 2007).
Moreover, in JA treated tomato plants, LOXF and ERF1 were upregulated until the 7th hour (approx. 4- and 8-fold, respectively). However, this induction decreased rapidly at each point time until the last assessment. Similar behaviour was shown by PAL: its expression, in fact, reached its maximum after 24 h (ca. 8-fold), but its decrease started from 48 h (5-fold) to reach the baseline after 8 days.
The tomato plants treated with SDW-R (negative control) showed an induction of PR-1a at 7 and 24 h (ca. 11- and 4-fold, respectively) due to the type of treatment application. The tomato uprooting (wounded roots), as already written above, and the 10 min drenching triggered also a plant response (Tournier et al., 2003). At time 0, 48 and 120 h the plant response was close to the baseline; unexpectedly, at the 8th day from the SDW-R treatment, the expression of PR-1a was evaluated as approx. 12-fold. The increase of PR-4 transcripts however, was only observed in the plants tested 8 days after the treatment; in this case the overexpression of PR-4 was comparable to that of PR-1a. Similar behaviour on negative control plants (SDW-R) was observed for PR-5: its induction was close to the baseline (from
ca. 0- to 1-fold) up to 120 h and a slight expression increase (approx. 3-fold) was evaluated
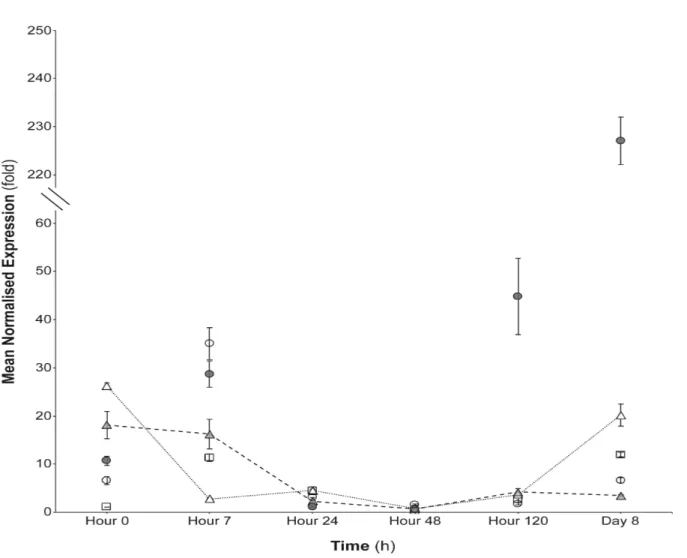
Figure 12. PR-1a expression kinetics in tomato leaves after root application of: PAW-R (empty triangles), PAW-RI (grey filled triangles), SDW-R (negative control, empty squares), ASM (positive control, grey filled circles), JA (positive control empty circles). The graph shows the PR-1a induction at each time point and the standard error (±SE).
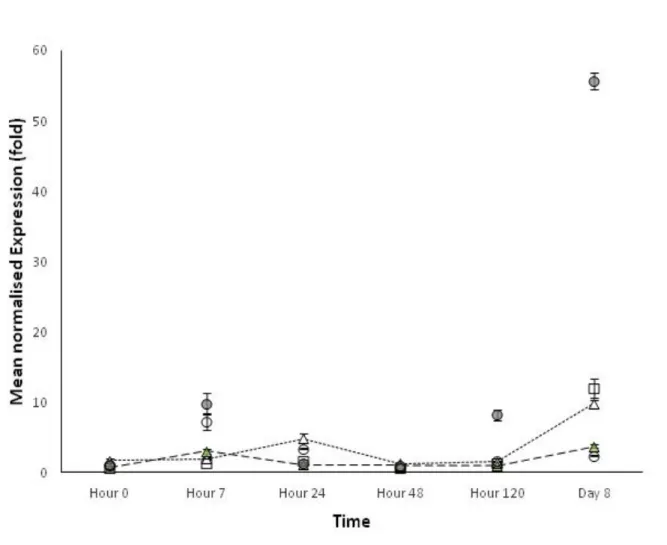
Figure 13. PR-4 expression kinetics in tomato leaves after root application of: PAW-R (empty triangles), PAW-RI (green filled triangles), SDW-R (negative control, empty squares), ASM (positive control, grey filled circles), JA (positive control empty circles). The graph shows the PR-4 induction at each time point and the standard error (±SE).
Figure 14. PR-5 expression kinetics in tomato leaves after root application of: PAW-R (empty triangles), PAW-RI (green filled triangles), SDW-R (negative control, empty squares), ASM (positive control, grey filled circles), JA (positive control empty circles). The graph shows the PR-5 induction at each time point and the standard error (±SE).
Figure 15. LOXF expression kinetics in tomato leaves after root application of: PAW-R (empty triangles), PAW-RI (filled triangles), SDW-R (negative control, empty squares), ASM (positive control, filled circles), JA (positive control empty circles). The graph shows the LoxF induction at each time point and the standard error (±SE).
0 1 2 3 4 5 6 7 8 9 10
Hour/0 Hour/7 Hour/24 Hour/48 Hour/120 Day/8
Me an %N or m al is ed %E xp re ss io n% (f ol d) Time%
Figure 16. PAL expression kinetics in tomato leaves after root application of: PAW-R (empty triangles), PAW-RI (filled triangles), SDW-R (negative control, empty squares), ASM (positive control, filled circles), JA (positive control empty circles). The graph shows the PAL
Figure 17. ERF1 expression kinetics in tomato leaves after root application of: PAW-R (empty triangles), PAW-RI (filled triangles), SDW-R (negative control, empty squares), ASM (positive control, filled circles), JA (positive control empty circles). The graph shows the ESDW-RF1 induction at each time point and the standard error (±SE).
0 1 2 3 4 5 6 7 8 9 10 11 12 13 14 15
Hour/0 Hour/7 Hour/24 Hour/48 Hour/120 Day/8
Me an %N or m al is ed %E xp re ss io n% (f ol d) Time%
Tomato plants treated with SDW-R did not show a relevant induction of PAL and LOXF in the considered time intervals with the only exception of PAL (at 0 h) and LOXF (from 0 h to 24 h) whose expression was calculated as approx. 3-fold. The amount of ERF1 RNA transcripts was ca. 4-fold at 7th hour from the root treatment; in the rest of time points the expression was close to the baseline (Figures 15, 16 and 17). These results were expected because of the wounds produced by the treatment method, as for PR-1a.
The cv. Moneymaker plants treated with PAW-R and PAW-RI triggered the expression of PR-1a since the beginning: at time 0 h, in fact, the amount of mRNA was approx. 26- and 19-fold, respectively, significantly higher than that of the negative control plants (SDW-R). The transcript abundance level was also significant when comparing, at the same time, to ASM (ca. 10.6-fold) and JA (ca. 6.5-fold). The induction of PR-1a from 7 h to 48 h after both PAW treatments was not different to those plants drenched in SDW; at 120 h the expression of PR-1a increased to ca. 4-fold. Finally, at 8 d, PAW-R treated plants highlighted a significant increase of PR-1a induction (ca. 20-fold), with respect to that of negative control (SDW-R, ca. 12-fold), but also significantly lower than that of ASM-R treated plants (approx. 227-fold). These data could be explained by the different components of PAW (i.e. H2O2). Hydrogen peroxide, in fact, is a diffusible molecule and it is involved in the regulation of several defence- and pathogenesis-related genes, in particular pr1a (Kuhn et al., 1989; Desikan et al., 1998). The accumulation of H2O2 can lead to salycilic acid (SA) synthesis, which in turn, can stabilize H2O2 by inhibiting catalase activity (Leon et al., 1995). Elevated levels of SA along with H2O2 can activate the local PR-1a expression and can serve as a systemic signal to activate the SAR response that is also expressed in leaf tissues (Devadas
et al., 2002). Unexpectedly, PAW-RI treated plants showed an induction decrease at 8 d
(approx. 3.5-fold) (Figure 12). Referring to PR-4 and PR-5 gene expression kinetics in PAW-R and PAW-PAW-RI treated plants, no significant increase was detected up to 8 d after treatments (Figures 13 and 14).
More interesting results were obtained from the PAL and LOXF expression analyses of plants treated with both PAW applications: at 0 h the PAL and LOXF induction was significantly higher than that of the positive controls (ASM-R and JA, Figures 15 and 16), and this can be justified by the presence of hydrogen peroxide in the water activated with plasma (Laurita et al., 2015). The expression levels of these two genes was significantly
constantly decreased up to 8 d after treatment remaining, in some cases significantly lower, and in other cases similar/higher to the induction level observed in the positive controls (ASM-R and JA). PAL and LOXF are known to be involved in the defence responses against several pests/pathogens (Peng et al., 2005; Mariutto et al., 2011) and abiotic stresses (Kuzniak and Urbanek, 2000; Dat et al., 2000; Miller et al., 2009); in particular, PAL, whose expression levels early occurred in this study on PAW treatments (from 0 h to 48 h), is known as a key factor in tomato plant defence as a regulatory enzyme in the phenylpropanoid pathway, leading to the production of phytoalexins and phenolic substances (Pellegrini et
al., 1994; Polle et al., 1994; Guo and Wang, 2009). The early increase of PAL expression
may be also explained considering that ROS – contained in PAW - are involved in signal transduction pathways triggered during stress responses (Willekens et al., 1995; Alvarez et
al., 1998; Kuzniak and Urbanek, 2000; Dat et al., 2000; Miller et al., 2008; Miller et al., 2009;
Bhattacharjee, 2012; Suzuki et al., 2013) within some minutes to hours/days (Soares et al., 2009; Mittler et al., 2011). In addition, PAL induction, involved in the pre-infection resistance, could be considered one of the first barriers used by plants to contrast the bacterial penetration; moreover, the study by Kavitha and Umesha (2008) demonstrated that PAL expression is upregulated in cultivars resistant to bacterial leaf spot in tomato.
ERF1 tomato expression levels at 24 h after both PAW-R and PAW-RI treatments resulted significantly higher (approx. 3.1- and 3.2-fold, respectively) than those of plants treated with SDW-R and JA (ca. 1.1-fold, and 2.3-fold, respectively), and significantly lower than those of plants treated using ASM (approx. 6.8-fold) (Figure 17). At time points 0, 48, 120 h and 8 d the relative transcript abundance of PAW treated plants resulted upregulated with respect of that of negative control (SDW-R). The only exception was represented by mRNA abundance in plants at 7 h after water treatment that is in agreement with the known role of
erf1 gene shown to be upregulated by wounds (Tournier et al., 2003). The plant response,
in fact, that was recorded at 7 h after SDW application at the root apparatus (ca. 4-fold) - by the plant explants and the subsequent drenching - was indeed explained by this mechanism. The ERF1 expression plants treated with PAW was significantly lower than those treated with ASM and JA.
In conclusion, PAW was not able to directly inhibit the growth of Xv strain IPV-BO 2684 when tested in in vitro experiments using diffusion and dilution methods (according to NCSL standard methods). However, when PAW was tested in in vivo experiments, by treating tomato plants at the roots to study its ability to induce plant defences against Xv, it reduced the disease severity (bacterial leaf spot of tomato) giving a relative protection that ranged between approx. 30 and 38%.
The subsequent transcriptomics study to verify the activation of 6 selected genes, selected among those that are specific markers of salicylic acid and jasmonic acid/ethylene pathways, it demonstrated an early upregulation of PAL and LOXF expression that was observed from the beginning of the experiment. This expression decreased up to the 8th day from the root treatment, but it remained significantly higher than that of the negative control. Moreover, the PR-1a (Ciardi et al., 2000; 2001), PR-4 and PR-5 expression data resulted highly variable and therefore very likely that are not involved in the reduction of bacterial leaf spot severity.
The defence response represented by the expression increase of pal gene is involved in the phenylpropanoid pathway, and therefore in the production of lignin and some phytoalexins (Dixon et al., 1995); in these experiments this response was related to the reduction of disease severity caused by the bacterial pathogen Xv. The slight effect of relative protection in combination to the PAL and LOXF expression kinetics study, suggested that the key factor for the disease severity inhibition might be the time of PAW application before pathogen inoculation. Further experiments will be also needed to assay the efficacy of PAW against Xv when treated at leaves. This will allow to evaluate the expression of selected defence genes involved in the local acquired resistance (LAR) and this, if confirmed, can open new friendly application ways to protect tomato plants from this bacterial disease.
Chapter II
EFFICACY OF THE BIOSTIMULANT V 3-2435 AGAINST
DIFFERENT BACTERIAL PATHOGENS
1.! INTRODUCTION
1.1 Bacterial leaf spot of tomato and pepper
Bacterial leaf spot of tomato (BLST), caused by different species of Xanthomonas was firstly observed in 1914 in South Africa (Doidge, 1921) and it has then worldwide spread in all the countries where pepper and tomato are cultivated (Quezado-Duval et
al., 2003; Jones et al., 2004; Moretti et al., 2009; EPPO, 2013); indeed, it is a very
important disease in the seed market (Giovanardi et al., 2015). The symptoms occur on leaves, stems, and fruits; leaf lesions (spots) may be dark green (water-soaked) and become later dark brown. Long-distance dissemination of those xanthomonads is ensured by contaminated seed trading (Carmo et al., 2001).
1.2 Bacterial canker of kiwifruit
Pseudomonas syringae pv. actinidiae (Psa) is the causal agent of kiwifruit bacterial
canker; it was isolated for the first time in 1984 in Japan (Serizawa et al., 1989; Takikawa et al., 1989). Almost two decades after the first disease appearance, it became pandemic and it was threatening the sustainability of the kiwi industry in all the major kiwi-producing countries such as China, Italy, New Zealand, Chile and Greece (FAO, 2016; Ferguson, 2015). Psa symptoms on leaves can be recognized by dark brown spots surrounded by yellow haloes; cankers with reddish exudates on twigs, leaders and trunks, and the collapse of fruits can also be observed (Serizawa et
1.3 Bacterial disease control
The European Union (EU), United States of America (USA) and different other countries have undertaken regulatory changes in pesticide registration requirements expecting a half reduction of the existing active ingredients in the early 1990s; thus, compounds are becoming more selective, with a lower intrinsic toxicity and a reduced impact on the environment (Montesinos, 2007). Upon the implementation of the new regulations several pesticides have been excluded and some plant diseases of economic relevance are therefore not well managed. Indeed, the efficacy requirements of the different experimental molecules is needed for both authorisation and registration of the pesticides, but also, to guarantee their effectiveness against pathogens.
Plant protection against bacterial pathogens was mainly based on copper compounds, among them the Bordeaux mixture is the most known and used. The mechanisms of copper ions-mediated antimicrobial activity consist of directly toxicity on bacterial growth (Yuan et al., 2010; Liu et al., 2015). Moreover, some studies showed that copper might be involved also in regulating the plants defence response (Yeh et al., 2003; Sudo et al., 2008). Detrimental effects of the copper as environmental contaminants and selection of resistant plant-pathogenic bacterial strains have been reported in several crops (Loper et al., 1991; Sundin et al., 1993; Graves and Alexander, 2002).
These unfavourable effects could be reduced in a framework of integrated pest management, in which the plant protection is achieved by the combination of different preventive techniques: from prophylaxis through the use of biocontrol agents, resistance inducers and chemicals, to the use of less susceptible cultivars (Lyon and Newton, 1999; Oostendorp et al., 2001; Gerhardson, 2002; Bergamaschi et al., 2006; Gao et al., 2014; Perez et al., 2015). Nowadays in the pesticide markets, it is possible to find biological and chemical elicitors that have the ability to induce complex biochemical reactions as local acquired resistance (LAR), systemic acquired resistance (SAR) or induced systemic resistance (ISR) (Terry and Joyce, 2004; Reglinski et al., 2011; Rademacher, 2004; Vallad and Goodman, 1998; Thakur and Sohal, 2013). The mode of action of the resistance inducers involves the strengthening