A Giusi
Abstract
Dipartimento di Fisica Doctor of Philosophy
Measurement of single and double differential cross-section of top-quark pair
production using data collected by the ATLAS detector in pp collisions atps =13 TeV
by Francesco LARUFFA
In this thesis, measurements of the differential cross-section for top-quark pair produc-tion in proton-proton collisions at a centre-of-mass energy of ps = 13 TeV are presented. The measurements are performed using data collected by the ATLAS detector at the Large Hadron Collider at CERN during 2015 and 2016, corresponding to an integrated luminosity of 36.1 fb 1. The top-quark pair events are selected in the lepton (electron or muon) plus jets channel and the analysis employs two separate selections and top-quark reconstruction strategies according to the value of the transverse momentum of the top quark. The single and double differential distributions are measured as a function of several kinematic vari-ables of the top quark and the t¯t system in a fiducial phase-space and extrapolated to the full phase-space. Given the large t¯t production cross-section at the LHC, the measured spectra provide stringent tests of perturbative QCD and are relevant for the tuning of Monte Carlo simulations of the top-quark modelling. For this reason, the differential cross-section dis-tributions are compared to several theoretical Monte Carlo predictions and state-of-the-art fixed-order QCD predictions.
Abstract
Dipartimento di Fisica Doctor of Philosophy
Measurement of single and double differential cross-section of top-quark pair
production using data collected by the ATLAS detector in pp collisions atps =13 TeV
by Francesco LARUFFA
In questa tesi sono presentate le misure di sezione d’urto differenziale di produzione di coppie di quark top in collisioni protone-protone ad un’energia del centro di massa di ps = 13 TeV. Le misure sono state fatte utilizzando i dati raccolti con il rivelatore ATLAS al Large Hadron Collider del CERN durante il 2015 ed il 2016, per una luminosità integrata corrispondente di 36.1 fb 1. Gli eventi di coppie di quark top sono selezionati nel canale leptone (elettrone o muone) più getti e l’analisi ha impiegato due selezioni e due strategie di ricostruzione del quark top a seconda del valore dell’impulso trasverso del quark top. Le distribuzioni singolo e doppio differenziali sono misurate in funzione di diverse variabili cinematiche del quark top e del sistema t¯t in uno spazio delle fasi fiduciale ed estrapolate al completo spazio delle fasi. Data l’alta sezione d’urto di produzione di coppie di top quark ad LHC, le distribuzioni misurate offrono la possibilità di effettuare test molto strin-genti della QCD perturbativa e sono importanti per il tuning delle simulazioni Monte Carlo che modellano il quark top. Perciò, le distribuzioni di sezioni d’urto differenziali sono con-frontate con diverse predizioni Monte Carlo e predizioni ad un ordine fissato dello sviluppo perturbativo in QCD che rappresentano lo stato dell’arte dei calcoli teorici a riguardo della produzione di coppie di top quark.
Abstract ii
Sommario iii
Contents iv
List of Figures viii
List of Tables xx
1 The Standard Model and the Top quark 3
1.1 The fundamental particles . . . 4
1.2 Interactions . . . 6
1.2.1 Quantum Electrodynamics . . . 6
1.2.2 Weak interaction . . . 7
1.2.3 The Electroweak Theory . . . 8
1.2.4 The Higgs Mechanism . . . 9
1.2.5 Quantum Chromodynamics. . . 12
1.2.6 Factorization . . . 14
1.3 The Top quark . . . 15
1.3.1 Top quark production . . . 17
1.3.1.1 Top quark pair production . . . 17
1.3.2 Status of theoretical predictions for differential t¯t production. . . 19
1.3.2.1 Single quark top production . . . 21
1.3.3 Top quark decay . . . 23
1.3.4 Status of the differential cross-section measurements . . . 25
2 The LHC and the ATLAS experiment 31 2.1 The LHC . . . 31
2.1.1 The LHC Experiments . . . 33
2.2 The ATLAS Detector . . . 35
2.3 Magnet System . . . 37
2.4 Inner Detector . . . 39
2.4.1 Insertable B-Layer . . . 39
2.4.2 Pixel Detector . . . 40
2.4.3 SemiConductor Tracker . . . 42
2.4.4 Transition Radiation Tracker . . . 42 iv
2.5 Calorimeters . . . 43
2.5.1 Electromagnetic Calorimeter . . . 43
2.5.2 Hadronic Calorimeter . . . 44
2.5.3 Forward Calorimeter . . . 45
2.6 Muon Spectrometer . . . 45
2.6.1 Monitored Drift Tubes . . . 45
2.6.2 Catode Strip Chambers . . . 46
2.6.3 Resistive Plate Chambers . . . 47
2.6.4 Thin Gap Chambers . . . 47
2.7 Forward Detectors . . . 47
2.8 ATLAS Performance during LHC Run 2 (2015 and 2016 only) . . . 48
2.8.1 Pileup effect on data . . . 48
2.9 Analysis of ATLAS data . . . 50
2.9.1 TDAQ system . . . 50
2.9.2 Computing system . . . 52
3 Data sample and Monte Carlo simulation 53 3.1 Data sample . . . 53
3.2 Monte Carlo simulation . . . 53
3.3 Hard scattering process and Matrix Element generators . . . 55
3.4 Parton shower . . . 56
3.5 Underlying event . . . 57
3.6 Hadronization . . . 57
3.7 Monte Carlo Generators . . . 58
3.8 MC samples used in the analysis . . . 59
3.8.1 Nominal t¯t signal sample . . . 60
3.8.2 Alternative t¯t samples . . . 60
3.8.3 MC samples for background processes . . . 61
3.9 ATLAS Simulation . . . 62
3.10 Rivet framework and studies on t¯t modeling . . . 63
4 Object Definition 65 4.1 Tracks and Primary Vertices . . . 65
4.2 Electrons . . . 66
4.3 Muons . . . 68
4.4 Jets . . . 70
4.4.1 Jet reconstruction . . . 71
4.4.2 Jet calibration . . . 73
4.4.3 Jet Vertex Tagger . . . 74
4.4.4 Jet reconstruction and calibration in boosted topology. . . 74
4.5 b-tagging . . . 78
4.5.1 b-tagging algorithms . . . 79
4.5.2 b-tagging calibration . . . 83
4.5.3 Calibration of b-tagging algorithm using semileptonic t¯t events . . . . 84
4.5.4 Performance enhancement due to the addition of the IBL . . . 86
4.6 Missing Transverse Momentum . . . 86
5 Event Selection and Reconstruction 88
5.1 Event Selection . . . 88
5.2 Particle-level objects reconstruction and fiducial phase-space definition. . . . 89
5.3 Parton-level objects and full phase-space definition . . . 91
5.4 Background determination. . . 91
5.4.1 MC-based backgrounds . . . 93
5.4.2 Non-prompt and fake lepton background . . . 93
5.5 Combination ot the analysis channels . . . 97
5.6 Validation plots for kinematic variables . . . 100
5.7 Pseudo-top reconstruction algorithm . . . 105
5.8 Reconstruction of the t¯t system via the kinematic likelihood fit . . . 109
5.8.1 Comparison between 4- a 5-jet likelihood computation . . . 110
5.9 Boosted top reconstruction and tagging . . . 116
6 Cross-Section Measurement 121 6.1 Unfolding . . . 121
6.1.1 Iterative Bayesian Unfolding Method . . . 122
6.2 Binning choice and optimization . . . 123
6.2.1 Binning optimization for double differential distributions . . . 123
6.3 Correction evaluation . . . 124
6.3.1 Fiducial phase-space (particle level) . . . 125
6.3.2 Full phase space (parton level) . . . 127
6.4 Unfolding procedure . . . 130
6.5 Cross section extraction . . . 130
6.6 Unfolding validation . . . 131 6.6.1 Closure tests . . . 131 6.6.2 Stress tests . . . 132 6.7 Rivet validation . . . 133 7 Systematic Uncertainties 137 7.1 Detector systematics . . . 137 7.1.1 Lepton reconstruction . . . 138 7.1.2 Jet reconstruction . . . 138
7.1.2.1 Jets from gluons and quarks response. . . 138
7.1.3 b-tagging. . . 139
7.1.4 Missing transverse momentum . . . 139
7.1.5 Luminosity . . . 139
7.2 Signal modelling systematics . . . 140
7.2.1 MC generator: matrix element and parton shower models . . . 140
7.2.2 Initial- and final-state QCD radiation for the signal sample . . . 140
7.2.3 Parton distribution functions . . . 141
7.2.4 MC generator: Finite sample statistics . . . 141
7.3 Background modelling systematics . . . 142
7.3.1 Systematics on W+jets . . . 142
7.3.2 Systematics on Z + jets . . . 143
7.3.3 Single top . . . 143
7.3.5 Non-prompt and fake lepton background . . . 144
7.4 Unfolding systematics . . . 144
8 Results 145 8.1 Results in the fiducial phase space . . . 146
8.1.1 Resolved topology . . . 146
8.1.2 Boosted topology . . . 153
8.2 Results in the full phase space . . . 159
8.2.1 Resolved topology . . . 159
8.2.2 Boosted topology . . . 165
8.3 Comparisons with NNLO QCD+NLO EW theoretical predictions . . . 168
A Studies on the b-tagging working points 173 A.1 Resolved topology . . . 173
A.2 Boosted topology . . . 174
B Validation of the KLFitter likelihood cut 179 C Effects of the orthogonal selection 181 C.1 Validation of the orthogonal selection . . . 189
C.2 Comparison of the two selection . . . 193
D Estimation of the fraction of jets initiated by gluons 194 E Comparison of different t¯t Monte Carlo Generators using Rivet 199 F Systematic Tables 203 F.1 Particle level . . . 203
F.1.1 Absolute differential cross section . . . 203
F.1.1.1 Resolved topology . . . 203
F.1.1.2 Boosted topology . . . 213
F.1.2 Relative differential cross section . . . 225
F.1.2.1 Resolved topology . . . 225
F.1.2.2 Boosted topology . . . 232
F.2 Parton level . . . 244
F.2.1 Absolute differential cross section . . . 244
F.2.1.1 Resolved topology . . . 244
F.2.1.2 Boosted topology . . . 254
F.2.2 Relative differential cross section . . . 258
F.2.2.1 Resolved topology . . . 258
F.2.2.2 Boosted topology . . . 267
Bibliography 271
1.1 The Standard Model of Particle Physics: fundamental constituents of matter and gauge bosons. . . 4 1.2 The peculiar shape of the Higgs potential. . . 10 1.3 Running of the strong coupling constant. Figure taken from [4] . . . 14 1.4 Results of the most recent global fits by the NNPDF Collaboration [24] for
PDFs at factorization scales of 10 GeV2(on the left) and 104GeV2(on the right). 16
1.5 Summary of the ATLAS and CMS measurements of the top quark mass. The results are compared with the LHC and Tevatron+LHC mtcombinations.. . . 17
1.6 A graphical comparison of the masses of the SM particles. . . 18 1.7 Feynman diagrams at leading order for t¯t pair production via
quark/anti-quark annihilation (on top) and gluon-gluon fusion (on bottom).. . . 18 1.8 Summary of total production cross-section measurements by ATLAS
pre-sented as a function of centre-of-mass energy ps from 7 to 13 TeV for a few selected processes. Some markers are displaced horizontally for better visi-bility . . . 20 1.9 Comparison between LO, NLO and NNLO QCD predictions for the the
dif-ferential t¯t cross-section as a function of the transverse momentum of the top quark (a). The comparison is extended in (b) to the measurement performed by CMS at ps = 8 TeV [43]. The error bands represent the scale variation only. The vertical bars represent the uncertainty on the measurement. Figures are taken from [42]. . . 21 1.10 Theoretical predictions of top-quark pair production in QCD at NNLO
ac-curacy and the comparison with the inclusion of the NLO EW contributions for the top/antitop average pT (a) and the invariant mass of the t¯t system
(b) differential distributions. The uncertainty is shown for each QCD ⇥ EW distributions, including scale, PDF and total combined in quadrature uncer-tainties. The boundaries of the PDF variation band are marked with black dashed lines. Also shown is the ratio of central scales for the combined QCD and EW prediction with respect to the NNLO QCD one. Figures are taken from [44]. . . 22 1.11 Single top production channels at leading order. From left to right s-channel
(a), t-channel (b) and Wt-channel (c) are shown. . . 22 1.12 Pie diagram of top quark pair decay fractions. . . 24 1.13 A Feynman diagram for the top quark pair decay into `+jets channel. . . 25 1.14 Top-pair prodcution cross-section measurements at 13 TeV by the ATLAS and
CMS collaborations. The band shows the NNLO QCD calculation comple-mented with NNLL resummation (Top++2.0). The measurements and the theory calculation is quoted at mtop=172.5 GeV. . . 26
1.15 Summary of the LHC and the Tevatron measurements of the top-pair pro-duction cross-section as a function of the centre-of-mass energy compared to the NNLO QCD calculations complemented with NNLL resummation (Top++2.0). The theory calculation refer to mtop= 172.5 GeV. Measurements made at the same centre-of-mass energy are slightly offset for clarity. . . 27 1.16 Fiducial phase-space relative differential cross-sections as a function of the
(a) transverse momentum of the hadronic top quark. The yellow band in-dicate the total uncertainty of the data in each bin. The lower panels show the ratio of different predictions to the data. In (b), it is shown the ratios of the measured fiducial phase-space differential cross-section to the prediction from POWHEG+PYTHIA6 in the resolved and boosted topologies as a
func-tion of their respective transverse momentum of the hadronic top quark. The bands indicate the statistical and total uncertainties of the data in each bin. Figures are taken from [51]. . . 28 1.17 Full phase-space normalised differential ttbar cross-section as a function of
the invariant mass of the top-quark pair. The CMS and ATLAS results are compared to the NLO and NNLO calculations from [45]. The shaded bands show the total uncertainty on the data measurements in each bin. The lower panel shows the ratio of the data measurements and NLO calculation to the NNLO calculation. . . 28 1.18 Double-differential cross section at the parton level as a function of pTof the
hadronic top vs invariant mass of the t¯t system. The data are shown as points with light (dark) bands indicating the statistical (statistical and systematic) uncertainties. The cross sections are compared to different predictions. The ratios of the various predictions to the measured cross sections are shown at the bottom of each panel [54]. . . 29 1.19 Normalised ratio of data to the nominal prediction as a function of pTof the
hadronic top in the 4-jet exclusive, 5-jet exclusive and 6-jet inclusive configu-rations [55]. . . 30 2.1 Overview of the accelerating steps and nominal energy reached (on the left)
and schematic view of the LHC accelerator complex and particle detectors (on the right). . . 32 2.2 View of the LHC infrastructures and map of its experiments. Each of LHC
experiments is indicated in red. . . 34 2.3 Schematic view of ATLAS detector. . . 36 2.4 Example values of the polar angle and their corresponding values of the
pseudorapidity. . . 37 2.5 Section of the ATLAS detector and the interations that the particles undergo
with each of the sub-detectors. . . 38 2.6 Overview of layout of the magnet system of ATLAS.. . . 39 2.7 Overview of the Inner Detector layout [65]. . . 40 2.8 Scheme of the components of the Inner Detector showing distances from the
interaction point. . . 41 2.9 Schematic view of the IBL. . . 41 2.10 Schematic view of the Pixel detector showing the three concentric layers in
the barrel and three disks on each of the two end-caps. . . 42 2.11 Section of the Calorimetric system of the ATLAS detector.. . . 44 2.12 Schematic view of Muon Spectrometer and its sub-detectors. . . 46
2.13 Total integrated luminosity of the ATLAS detector in 2015 (on top left) and 2016 (on bottom left). In addition, data taking efficiency per week is shown for 2015 (on top right) and 2016 (on bottom right) separately.O . . . 49 2.14 Luminosity-weighted distribution of the mean number of interactions per
crossing for the combined 2015 and 2016 pp collision data at 13 TeV centre-of-mass energy. The mean number of interactions per crossing corresponds to the mean of the poisson distribution of the number of interactions per cross-ing calculated for each bunch. . . 50 2.15 Schematic diagrams showing the triggering process. . . 51 3.1 Sketch of a hadron-hadron collision as simulated by a Monte Carlo event
gen-erator. The red blob in the center represents the hard collision, surrounded by a tree like-like structure representing Bremsstrahlung as simulated by parton showers. The purple blob indicates a secondary interaction between other partons of the proton involving smaller momentum transfers. Light green blobs represent the parton-to-hadron transitions, the dark green blobs de-scribe hadron decays, and the yellow lines indicate soft photon radiation. Figure is taken from [80]. . . 54 3.2 Example of Feynman diagrams for t¯t production at tree level (a), for a real
emission (b) and a virtual contribution (c).. . . 55 3.3 Graphical scheme of the cluster model (a) and of the string model (b) used to
describe the hadronization process. . . 58 3.4 The POWHEG+PYTHIA 8 samples with different hdampvariations are
com-pared to ATLAS data unfolded to particle level as a function of the transverse momentum of the t¯t system at 8 TeV [52] (a) and 13 TeV [51] (b). The yellow band is the total experimental uncertainty on the data (statistical and system-atic). The generator predictions are shown as solid colored lines. Figures are taken from [114]. . . 64 3.5 Comparison of the generator setup defined for early Run 2 analyses (red)
with the setup used in the analysis (blue), compared to ATLAS unfolded data to particle level as a function of the transverse momentum of the top quark (a) and of the invariant mass of the t¯t system (b) at 13 TeV [51]. The data are represented as closed (black) circles with the total experimental uncertainty on the data (statistical and systematic) indicated by the error bars. Figures are taken from [115]. . . 64 4.1 The efficiency to identify electrons (left) from Z ! ee decays and the effiency
to identify hadrons as electrons (background rejection, right) using simulated dijet samples for al. The efficiencies are shown as a function of the ETof the
candidate electron and for all the defined working points [121]. . . 67 4.2 Reconstruction efficiency for the Medium muon selection (on the left) and
so-lation efficiency (on the right) for the Gradient working point as a function of the pTof the muon [123]. . . 70
4.3 Comparison between the jets obtained by the kt(top left), Cambridge–Aachen
(top right) and anti-kt(bottom) for a radius parameter R = 1.0 starting from
the same inputs [126].. . . 73 4.4 Distribution of JVT for pileup and hard-scatter jets with pT between 20 and
4.5 Opening angle between W and b in top decays t ! Wb as a function of the top pT(on the left) and opening angle of the W ! q ¯q system from t ! Wb
decays as a function of the pTof W boson. . . 75
4.6 Reclustered and conventional trimmed large-R jet mass responses (on the left), shown as a function of the matched truth jet transverse momentum (ptrue
T ) in representative mass bins. The dashed lines indicate deviations from
unity of 3%. The jet energy scale uncertainty as a function of pT for
reclus-tered jets and conventional large-R jets from Z0 ! t¯t events. A requirement
that the mass of the large-R jet be greater than 130 GeV is applied [137]. . . 78 4.7 Characteristic topology of jets containing b-hadrons and graphical
represen-tation of the impact parameter. . . 79 4.8 The log-likelihood ratios for the IP2D (on the left) and for the IP3D (on the
right) b-tagging algorithms for b- (solid blue), c- (dashed green) and light-flavour (dotted red) jets in t¯t events. The log-likelihood ratios shown here are computed as ratio of the b- and light-flavour jet hypotheses. If no tracks are found in the jet, a large negative value that is not indicated in the plots is assigned as algorithm output [139]. . . 80 4.9 Properties of secondary vertices reconstructed by the SV algorithm for
b-(solid blue), c- (dashed green) and light-flavour (dotted red) jets in t¯t events: the number of two-track vertices reconstructed within the jet (on the left) and the invariant mass (on the right) associated with the vertex [139]. . . 81 4.10 The input variables of the MV2 b-tagging algorithm [142]. . . 81 4.11 Light-flavour jet rejection (on the left) and c-jet rejection (on the right) versus
b-jet efficiency for the previous (2015 config) and the current configuration (2016 config) of the MV2 b-tagging algorithm evaluated on t¯t events [139]. . . 82 4.12 MV2c10 BDT output for b- (solid blue), c- (dashed green) and light-flavour
(dotted red) jets evaluated with t¯t events [142]. . . 83 4.13 Comparison between the data-to-simulation scale factors for the MV2c10
al-gorithm at the 85%(a), the 77%(b) and the 70%(c) working points obtained by using the tag-and-probe method (T&P) applied to t¯t single lepton (SL) can-didate events and those obtained by using t¯t dilepton events. The results for the combinatorial likelihood (PDF) method using t¯t dilepton events [143] are presented as red squares and the scale factors measured with the tag-and-probe method (T&P) using t¯t dilepton events [143] are presented as blue triangles [147]. . . 85 4.14 Performance of the b-tagging algorithm MV2c20 expressed in terms of
light-jet (on the left) and c -light-jet (on the right) rejection as a function of light-jet transverse momentum (pT), while keeping the b-tagging efficiency fixed at 70% in each
pTbin. The performance of the Run 1 (“Without IBL”) and Run 2 (“With IBL”)
detector layouts are compared, where the latter includes IBL. The underlying algorithms are updated to the detector geometry in each case. Jets are re-quired to be truth matched to a hard scatter jet. The rejection is defined as the inverse of the tagging efficiency. . . 86 5.1 Comparison between data and predictions for basic jet kinematic
distribu-tions in the resolved topology for the combined `+jets channel at the detector level: (a) jet multiplicity, (b) number of b-tagged jets, (c) pseudorapidity and (d) and transverse momentum of the jet, (e) pseudorapidity and (f) transverse momentum of the b-tagged jet. Events beyond the range of the horizontal axis are included in the last bin. . . 101
5.2 Comparison between data and predictions for basic kinematic distributions in the resolved topology for the combined `+jets channel at the detector level: (a) transverse momentum and (b) pseudorapidity of the lepton and (c) miss-ing transverse momentum. Events beyond the range of the horizontal axis are included in the last bin. . . 102 5.3 Comparison between data and predictions for basic kinematic distributions
in the boosted topology for the combined `+jets channel at the detector level: (a) transverse momentum and (b) pseudorapidity and (a) jet multiplicity of the small-R jet, (e) transverse momentum and (d) pseudorapidity and (f) jet multiplicity of the b-tagged small-R jet. Events beyond the range of the hori-zontal axis are included in the last bin. . . 102 5.4 Comparison between data and predictions for basic kinematic distributions
in the boosted topology for the combined `+jets channel at the detector level: (a) multiplicity and (b) pseudorapidity and (c) mass of the re-clustered jet. Events beyond the range of the horizontal axis are included in the last bin. . . 103 5.5 Comparison between data and predictions for basic kinematic distributions
in the boosted topology for the combined `+jets channel at the detector level: (a) transverse momentum and (b) pseudorapidity of the lepton, (c) W trans-verse mass and (d) missing transtrans-verse momentum. Events beyond the range of the horizontal axis are included in the last bin. . . 104 5.6 Transverse momentum (top left) and the rapidity (top right) of the hadronically
de-caying pseudo-top quark, and the transverse momentum (bottom left) and the ra-pidity (bottom right) of the leptonically decaying pseudo-top quark in the combined `+jets channel. The shaded area represents the total statistical and systematic uncer-tainties on the expected number of events. . . 107 5.7 Invariant mass (top left), transverse momentum (top right) and the rapidity (bottom
left) and the azimuthal angle difference (bottom right) of the reconstructed pseudo-t¯t pairs in the combined `+jets channel. The shaded area represents the total statistical and systematic uncertainties on the expected number of events. . . 108 5.8 The kinematic likelihood fitter log L distributions for the e+jets channel (left)
and µ+jets channel (right). All statistical and systematic uncertainties are taken into account in the error bands. . . 110 5.9 Transverse momentum (top left) and absolute value of the rapidity (top right) of the
hadronically decaying top quark, and the transverse momentum (bottom left) and and absolute value of the rapidity (bottom right) of the leptonically decaying top quark in the combined `+jets channel. The shaded area represents the total statistical and systematic uncertainties on the expected number of events. . . 111 5.10 Invariant mass (top left), transverse momentum (top right) and the absolute value
of the rapidity (bottom) and the azimuthal angle difference (bottom right) of the reconstructed t¯t pairs in the combined `+jets channel. The shaded area represents the total statistical and systematic uncertainties on the expected number of events. . 112 5.11 Sample compositions in the hadronic top pTspectrum for a selection without
(left) and with (right) likelihood cut in the `+jets channel . . . 113 5.12 Sample compositions in t¯t mass spectrum for a selection without (left) and
with (right) likelihood cut in the `+jets channel . . . 113 5.13 RMS of the reco/truth difference for basic t¯t observables, reconstructed using
the PseudoTop, KLFitter fed with 4 jets (using 8 TeV TFs) and KLFitter fed with 5 jets (using both 8 TeV and 13 TeV TFs). . . 114
5.14 Mean of the reco/truth difference for basic t¯t observables, reconstructed us-ing the PseudoTop, KLFitter fed with 4 jets (usus-ing 8 TeV TFs) and KLFitter fed with 5 jets (using both 8 TeV and 13 TeV TFs). . . 114 5.15 RMS of the reco/truth difference for basic t¯t observables, reconstructed using
the PseudoTop, KLFitter fed with 5 jets with and without the likelihood cut. . 115 5.16 Mean of the reco/truth difference for basic t¯t observables, reconstructed
us-ing the PseudoTop, KLFitter fed with 5 jets with and without the likelihood cut. . . 115 5.17 Efficiency and background rejection of the mass cut [120,220] applied on the
re-clustered jets to identify the top quarks as a function of the pT of the leading
re-clustered jet in the event. On the top-left the efficiency at detector level (blue) and particle level (red), evaluated as the ratio of the leading reclustered jet in the event that fulfills the mass window requirement and all the leading reclustered jets in the same pTrange is shown. In the top right only jets that matches R(RC jet,truth t(or ¯t)) <
0.75 are considered. On the bottom the background rejection is defined as the oppo-site of the selection efficiency and it is derived using a W+jets sample. Only events containing a single lepton, with Emiss
T >20 GeV, sum of ETmissand mWT >60 GeV and
containing at least a re-clustered jet with pT > 200 GeV are used to obtain the
effi-ciencies. . . 117 5.18 Transverse momentum (top left), absolute value of the rapidity (top right) and mass
(bottom) of the hadronically decaying top quark in the combined `+jets channel in the boosted topology. The shaded area represents the total statistical and systematic uncertainties on the expected number of events. . . 118 5.19 Transverse momentum (top left), absolute value of the rapidity (top right) and mass
(bottom) of the leptonically decaying top quark in the combined `+jets channel in the boosted topology. The shaded area represents the total statistical and systematic uncertainties on the expected number of events. . . 119 5.20 Invariant mass (top left), transverse momentum (top right) and the absolute value of
the rapidity (bottom) of the reconstructed t¯t pairs in the combined `+jets channel in the boosted topology. The shaded area represents the total statistical and systematic uncertainties on the expected number of events. . . 120 6.1 Efficiency fj
eff and acceptance f j
acc and matching fmatchj corrections and the
migration matrix for the pt,hadT variable in the resolved topology at the particle level in the combined `+jets channel. . . 126 6.2 Efficiency fj
eff and acceptance f j
acc and matching fmatchj corrections and the
migration matrix for the mt ¯t⇥ n
jet variable in the resolved topology at the
particle level in the combined `+jets channel. . . 127 6.3 Efficiency fj
effand acceptance f j
acccorrections and the migration matrix for the
pt,hadT variable in the boosted topology at the particle level in the combined `+jets channel. . . 128 6.4 Efficiency fj
effand acceptance f j
acccorrections and the migration matrix for the
mt ¯t⇥ pt ¯t
T variable in the boosted topology at the particle level in the combined
`+jets channel. . . 129 6.5 The (a) dilepton and (b) efficiency corrections (evaluated with several
simu-lations samples), and the (c) detector-to-parton level migration matrix (evalu-ated with the nominal POWHEG+PYTHIA8 simulation sample) for the hadronic
top-quark transverse momentum in the resolved topology at parton level, for events selected with the kinematic likelihood cut. . . 129
6.6 The (a) dilepton and (b) efficiency corrections (evaluated with several simu-lations samples), and the (c) detector-to-parton level migration matrix (evalu-ated with the nominal POWHEG+PYTHIA8 simulation sample) for the hadronic
top-quark transverse momentum in the boosted topology at parton level. . . 130 6.7 Closure tests for hadronic top pT in the resolved and boosted topologies
re-constructed using the pseudo top algorithm with matching selection . . . 132 6.8 Stress test plots in the `+jets channel performed by reweighting the pTof the
hadronic top (left) and the mass of the t¯t system (right) for the relative spectra.133 6.9 Particle level comparison between the nominal prediction obtained by
run-ning the analysis framework over the t¯t sample in DxAOD format (blue line) and the prediction coming from the resolved Rivet routine running over the same t¯t sample in EVNT format (red line) for the transverse momentum pT
of the hadronic pseudo-top quark in the `+jets cahnnel. The grey band rep-resents the statistical uncertainty. . . 136 6.10 Parton level comparison between the nominal prediction obtained by
run-ning the analysis framework over the t¯t sample in DxAOD format (blue line) and the prediction coming from the resolved partonic Rivet routine running over the same t¯t sample in EVNT format (red line) for the transverse mo-mentum pTof the hadronic top quark in the `+jets cahnnel. The grey band
represents the statistical uncertainty. . . 136 8.1 Particle-level differential cross-sections as a function of pT(a) and the
rapid-ity (b) of the hadronically decaying top, compared with the nominal POWHEG+PYTHIA
8 prediction. The bands indicate the total uncertainty in the data in each bin. The POWHEG+PYTHIA8 event generator is used as the nominal prediction to
correct for detector effects, parton showering and hadronization. . . 148 8.2 Particle-level differential cross-sections as a function of (a) the mass, (b) the
transverse momentum and (c) the rapidity of the t¯t system in the resolved topology, compared with different Monte Carlo predictions. The bands in-dicate the total uncertainty in the data in each bin. The POWHEG+PYTHIA
8 event generator is used as the nominal prediction to correct for detector effects, parton showering and hadronization. Data points are placed at the center of each bin. . . 148 8.3 Particle-level differential cross-sections as a function of (a) pt ¯t
out and (b) HTt ¯tin
the resolved topology, compared with different Monte Carlo predictions. The bands indicate the total uncertainty in the data in each bin. The POWHEG+PYTHIA
8 event generator is used as the nominal prediction to correct for detector ef-fects, parton showering and hadronization. Data points are placed at the center of each bin. . . 149 8.4 Particle-level differential cross-sections as a function of (a) the mass of the t¯t
system and (b) the pT of the t¯t system in bins of jet multiplicity, compared
with the nominal POWHEG+PYTHIA8 prediction. The POWHEG+PYTHIA8
event generator is used as the nominal prediction to correct for detector ef-fects, parton showering and hadronization. . . 149 8.5 Ratios of the Monte Carlo predictions divided by the data for the
particle-level differential cross-sections as a function of (a) the mass of the t¯t system and (b) the pT of the t¯t system in bins of jet multiplicity. The bands indicate
the total uncertainty in the data in each bin. The POWHEG+PYTHIA8 event
generator is used as the nominal prediction to correct for detector effects, parton showering and hadronization. . . 150
8.6 Particle-level differential cross-sections as a function of the transverse mo-mentum of the t¯t system in bins of the mass of the t¯t system (a) and (b) the transverse momenum of the hadronic top in bins of the pTof the t¯t system,
compared with the nominal POWHEG+PYTHIA8 prediction. The POWHEG+PYTHIA
8 event generator is used as the nominal prediction to correct for detector ef-fects, parton showering and hadronization. . . 151 8.7 Ratios of the Monte Carlo predictions divided by the data for the
particle-level differential cross-sections as a function of the t¯t system in bins of the mass of the t¯t system (a) and the transverse momenum of the hadronic top in bins of the pTof the t¯t system (b). The bands indicate the total uncertainty
in the data in each bin. The POWHEG+PYTHIA8 event generator is used as
the nominal prediction to correct for detector effects, parton showering and hadronization. . . 152 8.8 Particle-level differential cross-sections as a function of (a) the pTand (b)
ab-solute value of the rapidity of the hadroncially-decaying top in the boosted topology, compared with different Monte Carlo predictions. The bands in-dicate the total uncertainty in the data in each bin. The POWHEG+PYTHIA
8 event generator is used as the nominal prediction to correct for detector effects, parton showering and hadronization. Data points are placed at the center of each bin. . . 154 8.9 Particle-level differential cross-sections as a function of (a) the mass, (b) the
transverse momentum and (c) the absolute value of the rapidity of the t¯t sys-tem in the boosted topology, compared with different Monte Carlo predic-tions. The bands indicate the total uncertainty in the data in each bin. The
POWHEG+PYTHIA8 event generator is used as the nominal prediction to
cor-rect for detector effects, parton showering and hadronization. Data points are placed at the center of each bin. . . 154 8.10 Particle-level differential cross-sections as a function of pt ¯t
out (a) and HTt ¯t (b),
compared with different Monte Carlo predictions. The bands indicate the total uncertainty in the data in each bin. The POWHEG+PYTHIA8 event
gen-erator is used as the nominal prediction to correct for detector effects, parton showering and hadronization. Data points are placed at the center of each bin.155 8.11 Particle-level differential cross-sections as a function of the transverse
mo-mentum of the hadronically decaying top (a) and the mass of the t¯t system (b) in bins of jet multiplicity, compared with the nominal POWHEG+PYTHIA 8
prediction. The POWHEG+PYTHIA8 event generator is used as the nominal
prediction to correct for detector effects, parton showering and hadroniza-tion. . . 155 8.12 Ratios of the Monte Carlo predictions divided by the data for the
particle-level differential cross-sections as a function of the transverse momentum of the hadronically decaying top (a) the mass of the t¯t system (b) in bins of jet multiplicity. The bands indicate the total uncertainty in the data in each bin. The event generator is used as POWHEG+PYTHIA8 the nominal prediction to
correct for detector effects, parton showering and hadronization. . . 156 8.13 Particle-level differential cross-sections as a function of the mass of the t¯t
sys-tem (a) and the transverse momentum of the hadronically decaying top (b) in bins of the transverse momentum of the t¯t system, compared with the nomi-nal POWHEG+PYTHIA8 prediction. The POWHEG+PYTHIA8 event generator
is used as the nominal prediction to correct for detector effects, parton show-ering and hadronization. . . 157
8.14 Ratios of the Monte Carlo predictions divided by the data for the particle-level differential cross-sections as a function of the mass of the t¯t system (a) and the transverse momentum of the hadronically decaying top (b) in bins of the transverse momentum of the t¯t system. The bands indicate the total un-certainty in the data in each bin. The event generator is used as POWHEG+PYTHIA
8 the nominal prediction to correct for detector effects, parton showering and hadronization. . . 158 8.15 Parton-level differential cross-sections as a function of (a) the transverse
mo-mentum and (b) the rapidity of the top quark in the resolved topology, com-pared with the NNLO prediction performed using the NNPDF31_nnlo_as_0118 PDF set and the POWHEG+PYTHIA8 Monte Carlo generator. The grey and
blue bands indicate the total uncertainty on the data and on the NNLO pre-diction in each bin, respectively. Data points are placed at the center of each bin. . . 160 8.16 Parton-level differential cross-sections as a function of (a) the mass, (b)
trans-verse momentum and (c) the rapidity of the t¯t system in the resolved
topol-ogy, compared with the NNLO prediction performed using the NNPDF31_nnlo_as_0118 PDF set and the POWHEG+PYTHIA8 Monte Carlo generator. The grey and
blue bands indicate the total uncertainty on the data and on the NNLO pre-diction in each bin, respectively. Data points are placed at the center of each bin. . . 160 8.17 Parton-level differential cross-sections as a function of the transverse
momen-tum of (a) the top quark and (b) the t¯t system in bins of mt ¯t, compared with the
fixed order NNLO prediction performed using the NNPDF31_nnlo_as_0118 PDF set. Data points are placed at the center of each bin. . . 161 8.18 Ratios of the NNLO prediction and the POWHEG+PYTHIA8 Monte Carlo
pre-diction divided by the data for the parton-level differential cross-sections as a function of the transverse momentum of (a) the top quark and (b) the t¯t system in bins of the mt ¯tin the resolved topology. The grey and blue bands
indicate the total uncertainty on the data and on the NNLO prediction in each bin, respectively.. . . 162 8.19 Parton-level differential cross-sections as a function of the transverse
momen-tum of the top in bins of (a) the absolute value of the rapidity of the top and (b) the pTof the t¯t system, compared with the fixed order NNLO
predic-tion performed using the NNPDF31_nnlo_as_0118 PDF set. Data points are placed at the center of each bin. . . 163 8.20 Ratios of the NNLO prediction and the POWHEG+PYTHIA8 Monte Carlo
pre-diction divided by the data for the parton-level differential cross-sections as a function of the pTof the top in bins of (b) the transverse momentum of the
t¯tsystem and (b) the absolute value of the rapidity of the top in the resolved topology. The grey and blue bands indicate the total uncertainty on the data and on the NNLO prediction in each bin, respectively. . . 164 8.21 (a): parton-level differential cross-sections as a function of the transverse
momentum of the top in the boosted topology, compared with the NNLO prediction performed using the NNPDF31_nnlo_as_0118 PDF set and the
POWHEG+PYTHIA 8 Monte Carlo generator. (b): parton-level differential
cross-sections as a function of the mass of the t¯t system in the boosted topol-ogy, compared with different Monte Carlo predictions. The grey and blue bands indicate the total uncertainty on the data and on the NNLO prediction in each bin, respectively. Data points are placed at the center of each bin. . . . 166
8.22 (a): parton-level differential cross-sections as a function of the mass of the t¯t system in bins of the transverse momentum of, compared with the nominal fixed order NNLO prediction performed using the NNPDF31_nnlo_as_0118 PDF set. (b): ratios of the NNLO prediction and the POWHEG+PYTHIA 8
Monte Carlo prediction divided by the data for the parton-level differential cross-sections as a function of the mass of the t¯t system in bins of the trans-verse momentum of the top quark in the boosted topology. The grey and blue bands indicate the total uncertainty on the data and on the NNLO prediction in each bin, respectively. . . 167 8.23 Absolute cross-section as a function of pt,avgT (left) and yt,avg (right) parton level
spectra in the resolved topology. The results are compared with NNLO QCD and NNLO QCD+NLO EW theoretical calculations in the ratio pads. The red solid line is the nominal NLO PowHeg showered with Pythia8 prediction, the black solid line represents data. The NNLO fixed-order calculations are represented using blue (LUXQED17 PDF set) and green (NNPDF3.1 PDF set) bullets. The NNLO fixed-order calculations including NLO ElectroWeak corrections are drawn as purple (LUXQED17 PDF set) and orange (NNPDF3.1 PDF set) bullets. The vertical bands on each marker represents the total uncertainty of the prediction. The lighter grey band represents the total uncertainty while the darker grey one the statistical uncertainty. . . 169 8.24 Absolute cross-section as a function of pt ¯t
T (top left) and yt ¯t (top right) and mt ¯t
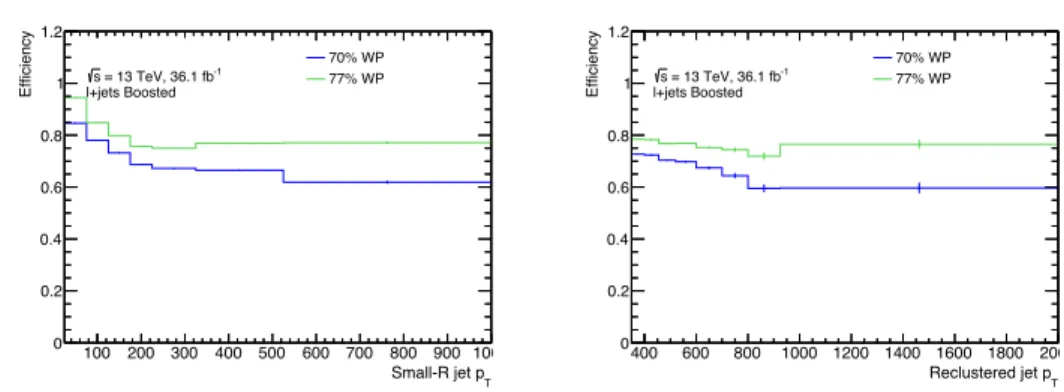
(bot-tom) parton level spectra in the resolved topology. The results are compared with NNLO QCD and NNLO QCD+NLO EW theoretical calculations in the ratio pads. The red solid line is the nominal NLO PowHeg showered with Pythia8 prediction, the black solid line represents data. The NNLO fixed-order calculations are repre-sented using blue (LUXQED17 PDF set) and green (NNPDF3.1 PDF set) bullets. The NNLO fixed-order calculations including NLO ElectroWeak corrections are drawn as purple (LUXQED17 PDF set) and orange (NNPDF3.1 PDF set) bullets. The vertical bands on each marker represents the total uncertainty of the prediction. The lighter grey band represents the total uncertainty while the darker grey one the statistical uncertainty. . . 170 A.1 b-tagging efficiency as a function of the pT, for the small-R jets (left) and reclustered
jets (right). The efficiency is calculated as the ratio between the number of b-tagged jets at detector level and the number of b-tagged jets in the same pT bin at particle
level, using a ghost B-hadron matching. . . 174 A.2 Number of b-jets per event in the resolved topology, using a b-tagging working point
of 77% on the left and 70% on the right. . . 174 A.3 Effect of the different b-tagging working points on the related uncertainty on the
signal sample in the resolved topology. . . 175 A.4 Number of b-jets per event in the boosted topology, using a b-tagging working point
of 77% on the left and 70% on the right. . . 176 A.5 Effect of the different b-tagging working point on the related uncertainty on the
sig-nal sample in the boosted topology. . . 177 A.6 Fractional uncertainty on the absolute particle level cross-section as a function of
pt,had
T (top) and mt ¯t (bottom) using a 77% efficiency working point on the left and
70% on the right. . . 178 B.1 Comparison between data and prediction efficiencies of the likelihood cut of
C.1 Comparison between the resolved, resolved without RC boosted events and resolved without boosted events for basic kinematic distributions. The bot-tom pad shows the ratios of all the spectra divided by the spectrum obtained after the resolved selection. . . 184 C.2 Comparison between the resolved, resolved without RC boosted events and
resolved without boosted events for basic pseudo-top kinematic distribu-tions. The bottom pad shows the ratios of all the spectra divided by the spectrum obtained after the resolved selection. . . 185 C.3 Comparison between the resolved, resolved without RC boosted events and
resolved without boosted events for basic KLFitter kinematic distributions. The bottom pad shows the ratios of all the spectra divided by the spectrum obtained after the resolved selection. . . 186 C.4 Comparison between the resolved and resolved without boosted events for
the efficiencies of basic pseudo-top kinematic distributions. . . 187 C.5 Comparison between the resolved and resolved without boosted events for
the efficiencies of basic pseudo-top kinematic distributions. . . 188 C.6 Comparison between the ratio of the spectra after applying the resolved
with-out boosted events selection and the spectra after applying the resolved se-lection obtained in data and prediction for basic kinematic variables. . . 190 C.7 Comparison between the ratio of the spectra after applying the resolved
with-out boosted events selection and the spectra after applying the resolved selec-tion obtained in data and predicselec-tion for basic pseudo top kinematic variables.
. . . 191 C.8 Comparison between the ratio of the spectra after applying the resolved
with-out boosted events selection and the spectra after applying the resolved se-lection obtained in data and prediction for basic klfitter kinematic variables.
. . . 192 C.9 Comparison between the reconstructed hadronic top and the parto- level top
quark. Three different approaches are compared for the reconstruction of the hadronic top: the pseudo-top algorithm, klfitter and the boosted approach with reclustered jets. In case of klfitter and pseudo-top algorithm both the cases of retaining and removing the events passing the boosted selection are considered. . . 193 D.1 Comparison between the gluon fractions estimated selecting a single lepton
with the trigger requirements for e+jets and µ+jets channel and the 2015 and 2016 year. The shaded bands represent the uncertainty on the gluon fraction estimation. . . 196 D.2 Gluon fraction map in bins of the jet pTand ⌘ estimated for the topology of
the analysis. . . 196 D.3 Comparison between the default and the current flavour composition and
(on the left) the flavour response uncertainties (on the right) for the pT (on
the top) and the mass (on bottom) of the hadronic top.. . . 197 D.4 Comparison between the default and the current flavour composition and
(on the left) the flavour response uncertainties (on the right) for the pT (on
E.1 Comparison of particle level predictions of different MC generators using the resolved Rivet routine. The normalized differential cross sections are shown as a function of pT of hadronic pseudo-top (top left), the pT of the t¯t system
(top right), the scalar sum of the pTof the top quarks HT (bottom left) and the
absolute value of |pt ¯t
out| (bottom right). The vertical bands on the distributions
are the statistical uncertainties of MC samples. . . 200 E.2 Comparison of particle level predictions of different MC generators using the
boosted Rivet routine. The normalized differential cross sections are shown as a function of pT of hadronic pseudo-top (top left), the pT of the t¯t system
(top right), the scalar sum of the pTof the top quarks HT (bottom left) and the
absolute value of |pt ¯t
out| (bottom right). The vertical bands on the distributions
are the statistical uncertainties of MC samples. . . 201 E.3 Comparison of parton level predictions of different MC generators using the
partonic resolved Rivet routine. The normalized differential cross sections are shown as a function of pTof hadronic pseudo-top (top left), the pTof the
t¯tsystem (top right), the scalar sum of the pT of the top quarks HT (bottom
left) and the absolute value of |pt ¯t
out| (bottom right). The vertical bands on the
distributions are the statistical uncertainties of MC samples. . . 202 E.4 Comparison of parton level predictions of different MC generators using the
partonic boosted Rivet routine. The normalized differential cross sections are shown as a function of pT of hadronic pseudo-top (left) and the m of the
t¯tsystem (right). The vertical bands on the distributions are the statistical uncertainties of MC samples. . . 202
1.1 Predicted cross-sections for t¯t production at next-to-next-to leading order (NNLO) with next-to-next-to leading log (NNLL) soft gluon resummation [36] for the center-of-mass energies ps of 8 TeV and 13 TeV. The values are ob-tained assuming a top quark mass of 172.5 GeV, using the TOP++2.0 [37] program. The first uncertainty comes from the independent variation of the factorisation and renormalisation scales, µF and µR, while the second one is
associated to variations in the PDF and ↵S, following the PDF4LHC
prescrip-tion [38] with MSTW2008 68% CL NNLO , CT10 NNLO and NNPDF2.3 5f FFN PDF sets [39–41].. . . 19 1.2 Expected single top quark production cross sections in different channels at
a center-of-mass energy of 13 TeV. The predicted single-top cross sections for ppcollisions at a centre-of-mass energy of ps = 13 TeV is calculated for a top quark mass of 172.5 GeV at next-to-leading order (NLO) in QCD with Hathor v2.1 [46, 47]. PDF and ↵S uncertainties are calculated using the PDF4LHC
prescription [38] with the MSTW2008 68% CL NLO [48], CT10 NLO [49] and NNPDF2.3 [41] PDF sets, added in quadrature to the scale uncertainty. . . 23 1.3 W boson decay modes [4]. . . 23 1.4 Top-quark pair decay modes and their branching ratios [4]. . . 24 2.1 An overview of the typical performance-related parameters of the LHC
dur-ing operations in 2015-2016 years and their corresponddur-ing record values. . . . 33 4.1 Working points for the MV2c10 b-tagging algorithm, including benchmark
numbers for the efficiency and rejections rates. These values have been ex-tracted from t¯t events, the main requirement being jet pTabove 20 GeV [142].. 83
5.1 Single lepton triggers used in the analysis in 2015 and 2016 data taking. The identification operating points are represented by lhtight, lhmedium, lhloose and loose, while the isoltaion operating points are represented by ivarloose and ivarmedium. . . 88 5.2 Summary of event selections for detector-level and MC-generated
particle-level events in the resolved topology. . . 91 5.3 Summary of the requirements for detector-level and MC-generated
level events, for the boosted event selection. The description of the particle-level selection is in Section 5.2. . . 92 5.4 Summary of differences between loose and tight lepton selection requirements. 94 5.5 Different triggers used in the loose and tight lepton selection requirements
for 2016 data taking period in the resolved topology. . . 96 5.6 Choosen fakes parametrisations for the different topologies and channels. . . 97
5.7 Observed and expected number of events in the e+jets and in the µ+jets chan-nels after the full event selection in the resolved analysis. The systematic uncertainties do not include the signal modelling ones. Symmetrised uncer-tainties are obtained by averaging the up- and down-uncertainty components. 98 5.8 Observed and expected number of events in the e+jets and in the µ+jets
chan-nels after the full event selection in the boosted analysis. The systematic un-certainties do not include the signal modelling ones. Symmetrised uncertain-ties are obtained by averaging the up- and down-uncertainty components. . . 98 5.9 Event yields after the resolved and boosted selections and the combination
of the e+jets and µ+jets channels. Events that pass both resolved and boosted selections are removed from the resolved selection. The uncertainties include the combined statistical and systematic uncertainties, excluding the system-atic uncertainties related to the modelling of the t¯t system, as described in Section 7.2. Symmetrised uncertainties are obtained by averaging the up-and down-uncertainty components. . . 99 7.1 Fractional uncertainty on the Z+jets prediction in exclusive bins of jet
multi-plicity.. . . 143 7.2 Alternative fake parametrisation for the different topologies and channels
used to evaluate a systematic uncertainty on the fake lepton background. . . 144 A.1 Percentage composition of the sample selected in the resolved signal region using
the 77% b-tagging working point on the left and the 70% on the right. . . 175 A.2 Percentage composition of the sample selected in the boosted signal region using the
77% b-tagging working point on the left and the 70% on the right. . . 176 C.1 Observed and expected number of events in the `+jets channel after the full
event selection and the removal of the events passing the boosted selection in the resolved analysis. The systematic uncertainties do not include the signal modelling ones. The fraction with respect the total has been evaluated as
Nno b oo s t
Nt ot al . . . 181
C.2 Observed and expected number of events in the e+jets channel after the full event selection and the removal of the events passing the boosted selection in the resolved analysis. The systematic uncertainties do not include the signal modelling ones. The fraction with respect the total has been evaluated as
Nno b oo s t
Nt ot al . . . 182
C.3 Observed and expected number of events in the µ+jets channel after the full event selection and the removal of the events passing the boosted selection in the resolved analysis. The systematic uncertainties do not include the sig-nal modelling ones. The fraction with respect the total has been evaluated
as Nno b oo s t
Nt ot al . This ratio is greater than 1 in the Fakes sample because the
“no-boost” cut removes mostly negative-weighted events. . . 182 F.1 Table of systematics for the absolute differential cross-section at the particle
level for the |Pt ¯t
out| observable. . . 204
F.2 Table of systematics for the absolute differential cross-section at the particle level for the Ht ¯t
T observable. . . 205
F.3 Table of systematics for the absolute differential cross-section at the particle level for the pt,had
F.4 Table of systematics for the absolute differential cross-section at the particle level for the yt,hadobservable. . . . 206
F.5 Table of systematics for the absolute differential cross-section at the particle level for the pt ¯t
T observable. . . 207
F.6 Table of systematics for the absolute differential cross-section at the particle level for the yt ¯tobservable. . . . 208
F.7 Table of systematics for the absolute differential cross-section at the particle level for the mt ¯tobservable. . . . 209
F.8 Table of systematics for the absolute differential cross-section at the particle level for the yt,hadobservable. . . . 210
F.9 Table of systematics for the absolute differential cross-section at the particle level for the mt ¯tin bins of jet multiplicity observable. . . 210
F.10 Table of systematics for the absolute differential cross-section at the particle level for the pt ¯t
T in bins of jet multiplicity observable. . . 211
F.11 Table of systematics for the absolute differential cross-section at the particle level for the pt ¯t
T vs mt ¯tobservable. . . 211
F.12 Table of systematics for the absolute differential cross-section at the particle level for the pt,had
T vs pt ¯tT observable. . . 212
F.13 Table of systematics for the absolute differential cross-section at the particle level for the pt,had
T observable. . . 214
F.14 Table of systematics for the absolute differential cross-section at the particle level for the yhadobservable. . . . 215
F.15 Table of systematics for the absolute differential cross-section at the particle level for the pt ¯t
Tobservable. . . 216
F.16 Table of systematics for the absolute differential cross-section at the particle level for the mt ¯tobservable.. . . 217
F.17 Table of systematics for the absolute differential cross-section at the particle level for the yt ¯tobservable. . . 218
F.18 Table of systematics for the absolute differential cross-section at the particle level for the Ht ¯t
Tobservable. . . 219
F.19 Table of systematics for the absolute differential cross-section at the particle level for the pt ¯t
outobservable. . . 220
F.20 Table of systematics for the absolute differential cross-section at the particle level for the mt ¯tvs extra jet N observable. . . . 221
F.21 Table of systematics for the absolute differential cross-section at the particle level for the phad
T vspt ¯tT observable.. . . 222
F.22 Table of systematics for the absolute differential cross-section at the particle level for the pt,had
T vsextra jetN observable.. . . 223
F.23 Table of systematics for the absolute differential cross-section at the particle level for the mt ¯t[GeV]vspt ¯t
T. . . 224
F.24 Table of systematics for the relative differential cross-section at the particle level for the |Pt ¯t
out| observable. . . 225
F.25 Table of systematics for the relative differential cross-section at the particle level for the Ht ¯t
T observable. . . 226
F.26 Table of systematics for the relative differential cross-section at the particle level for the pt,had
T observable. . . 226
F.27 Table of systematics for the relative differential cross-section at the particle level for the yt,hadobservable. . . . 227
F.28 Table of systematics for the relative differential cross-section at the particle level for the pt ¯t
T observable. . . 227
F.29 Table of systematics for the relative differential cross-section at the particle level for the yt ¯tobservable. . . . 228
F.30 Table of systematics for the relative differential cross-section at the particle level for the mt ¯tobservable. . . . 229
F.31 Table of systematics for the relative differential cross-section at the particle level for the mt ¯tin bins of jet multiplicity observable. . . 229
F.32 Table of systematics for the relative differential cross-section at the particle level for the pt ¯t
T in bins of jet multiplicity observable. . . 230
F.33 Table of systematics for the relative differential cross-section at the particle level for the pt ¯t
T vs mt ¯tobservable. . . 230
F.34 Table of systematics for the relative differential cross-section at the particle level for the pt,had
T vs pt ¯tT observable. . . 231
F.35 Table of systematics for the relative differential cross-section at the particle level for the pt,had
T observable. . . 233
F.36 Table of systematics for the relative differential cross-section at the particle level for the yhadobservable. . . . 234
F.37 Table of systematics for the relative differential cross-section at the particle level for the pt ¯t
Tobservable. . . 235
F.38 Table of systematics for the relative differential cross-section at the particle level for the mt ¯tobservable.. . . 236
F.39 Table of systematics for the relative differential cross-section at the particle level for the yt ¯tobservable. . . 237
F.40 Table of systematics for the relative differential cross-section at the particle level for the Ht ¯t
Tobservable. . . 238
F.41 Table of systematics for the relative differential cross-section at the particle level for the pt ¯t
outobservable. . . 239
F.42 Table of systematics for the relative differential cross-section at the particle level for the mt ¯tvs extra jet N observable. . . . 240
F.43 Table of systematics for the relative differential cross-section at the particle level for the phad
T vspt ¯tT observable.. . . 241
F.44 Table of systematics for the relative differential cross-section at the particle level for the pt,had
T vsextra jetN observable.. . . 242
F.45 Table of systematics for the relative differential cross-section at the particle level for the mt ¯t[GeV]vspt ¯t
T. . . 243
F.46 Table of systematics for the absolute differential cross-section at the parton level for the pt,had
T observable. . . 245
F.47 Table of systematics for the absolute differential cross-section at the parton level for the yt,hadobservable. . . . 246
F.48 Table of systematics for the absolute differential cross-section at the parton level for the pt ¯t
T observable. . . 247
F.49 Table of systematics for the absolute differential cross-section at the parton level for the mt ¯tobservable. . . . 248
F.50 Table of systematics for the absolute differential cross-section at the parton level for the yt ¯tobservable. . . . 249
F.51 Table of systematics for the absolute differential cross-section at the parton level for the pt,had
F.52 Table of systematics for the absolute differential cross-section at the parton level for the pt ¯t
T vs mt ¯tobservable. . . 251
F.53 Table of systematics for the absolute differential cross-section at the parton level for the pt,had
T vs |y| t,had
T observable. . . 252
F.54 Table of systematics for the absolute differential cross-section at the parton level for the pt,had
T vs pt ¯tT observable. . . 253
F.55 Table of systematics for the absolute differential cross-section at the parton level for the mt ¯tobservable.. . . 255
F.56 Table of systematics for the absolute differential cross-section at the parton level for the phad
T observable. . . 256
F.57 Table of systematics for the absolute differential cross-section at the parton level for the mt ¯tvsphad
T observable. . . 257
F.58 Table of systematics for the relative differential cross-section at the parton level for the pt,had
T observable. . . 258
F.59 Table of systematics for the relative differential cross-section at the parton level for the yt,hadobservable. . . . 259
F.60 Table of systematics for the relative differential cross-section at the parton level for the pt ¯t
T observable. . . 260
F.61 Table of systematics for the relative differential cross-section at the parton level for the mt ¯tobservable. . . . 261
F.62 Table of systematics for the relative differential cross-section at the parton level for the yt ¯tobservable. . . . 262
F.63 Table of systematics for the relative differential cross-section at the parton level for the pt,had
T vs mt ¯tobservable. . . 263
F.64 Table of systematics for the relative differential cross-section at the parton level for the pt ¯t
T vs mt ¯tobservable. . . 264
F.65 Table of systematics for the relative differential cross-section at the parton level for the pt,had
T vs |y| t,had
T observable. . . 265
F.66 Table of systematics for the relative differential cross-section at the parton level for the pt,had
T vs pt ¯tT observable. . . 266
F.67 Table of systematics for the relative differential cross-section at the parton level for the mt ¯tobservable.. . . 268
F.68 Table of systematics for the relative differential cross-section at the parton level for the phad
T observable. . . 269
F.69 Table of systematics for the relative differential cross-section at the parton level for the mt ¯tvsphad
Testing the validity of the Standard Model (SM) in the high-energy regime at the Large Hadron Collider (LHC) is one of the main purposes of the ATLAS experiment. The top quark plays a crucial role in the SM, and so in the ATLAS physics programme, due to its peculiar properties: it is the most massive fundamental particle currently known and it is the only quark which can be studied before hadronisation. The top-quark pair is produced mainly by gluon fusion at LHC and its cross-section (⇠ 800 pb at a center-of-mass energy ps =13 TeV) is one of the largest among the SM processes investigated by the ATLAS exper-iment. Given the large value of the integrated luminosity of the 2015 and 2016 data taking periods collected by the ATLAS experiment, as well as the availability of recent calcula-tions at the next-to-next-to-leading order (NNLO) in perturbative QCD of the top-quark pair production, very stringent tests of the QCD predictions can be performed by using the t¯tdifferential cross-section measurements.
In this thesis, the measurements of single and double differential cross-sections for top-quark pair production in the lepton plus jets channel are presented. The measurements are performed both in resolved and boosted regime using the data sample collected in 2015 and 2016. The cross-sections are measured as a function of the main kinematic variables of the top quark and the t¯t system that are well suited to study the different aspects of the t¯t production at the LHC. The combination of the resolved and boosted regimes covers the full kinematic region characterized by the transverse momentum pTof the top quark. The differential cross-section measurements are compared with several Monte Carlo (MC) predictions as well as fixed-order QCD calculations in order to asses the level of accuracy of the theoretical description of top-quark pair production. Moreover, the measured spectra are particularly useful for the tuning of MC simulations which is relevant in the process of improving the understanding of t¯t production and, as a consequence, for the reduction of the uncertainties related to top-quark modeling. In addition, the results can be used as inputs for detailed phenomenological studies such as NNLO QCD DGLAP analysis for the determination of the proton’s PDFs, the mass of the top quark and the strong coupling constant ↵s, even simultaneously.
The structure of the thesis is as follows. In Chapter1a general overview of the SM and the theoretical framework for top-quark pair production is presented. In addition, a summary
of the current status of both theoretical and experimental results is presented. The experi-mental apparatus of the ATLAS detector is described in Chapter2. Chapter3is focused on the description of the Monte Carlo simulation of the physics processes and of the detector. The objects used in the analysis are defined in Chapter 4where a particular emphasis is given to the b-tagging algorithms and a recently published calibration analysis performed on semileptonic t¯t events. The event selections as well as the techniques employed to recon-struct the top quark are presented in Chapter 5. The unfolding procedure used to correct for detector effects on the measurement is described in Chapter6. The sources of systematic uncertainties affecting the measurements are presented in Chapter7. Finally, in Chapter8 the results of the measurement of the single and double differential cross-sections are pre-sented, together with a comparison with theoretical predictions.
The Standard Model and the Top
quark
During the last century, the number of discoveries of fundamental particles had undergone a rapid increase and it led physicists to face an apparently disordered collection of elemen-tary constituents of matter, the so-called particle zoo. The introduction of new ideas in the context fo quantum field theory helped to describe these observations in a coherent frame-work, together with the interactions occuring between the known fundamental particles. In the 1960s, the Standard Model (SM) fundations were set by Sheldon Glashow, Steven Weinberg and Abdus Salam [1,2]. The SM is the currently accepted and experimentally well-tested theory that descibes the all known fundamental particles and the interactions between them. The SM is a gauge quantum field theory, in which all particles are repre-sented as quanta of an associated field and the interactions between them are descibed in terms of exchange of a mediator. The quantum field theory extends the classic quantum mechanical description of the state of a system from a wave function to excitations of a local field (x). In classical Lagrangian formalism, the Lagrangian density L describes the state of system as a fuction of the field (x) and its space-time derivatives
L(x) = L( , @µ ) (1.1)
The evolution of a system is described by the Euler-Lagrange equation of motion @µ @ L @(@µ ) @L @ =0. (1.2)
According to Noether’s theorem, every symmetry produces a conservation law and vicev-ersa. All the fundamental interactions of the SM are based on lagrangians which are gauge invariant and they are represented by the exchange of gauge mediators.
1.1 The fundamental particles
The fundamental particles of the SM are shown in the schematic overview in Figure1.1and they are divided into two categories:
• fermions, particles with half-integer spin which follow the Fermi-Dirac statistics and the Pauli exclusion principle. The fermions are described by the Dirac equation, which provides both positive and negative energy solutions. The negative solutions are in-terpreted as anti-particles. Each anti-particle owns the same mass and spin value of the corresponding particles, but it has the opposite charge. The SM fermions are the leptons and the quarks.
• bosons, particles with integer spin which follow the Bose-Einstein statistics. In the SM, the bosons act as gauge mediators of the fundamental interactions between the particles. The SM fundamental bosons are the photon, the gluon, the W±, Z and Higgs (H) bosons.
FIGURE1.1: The Standard Model of Particle Physics: fundamental constituents of matter
The leptons are divided into three generations: e ve ! µ vµ ! ⌧ v⌧ ! (1.3)
The leptons e, µ and ⌧ have equal electric charge value ( 1 · e), while their masses vary within a wide range of energies (0.5 MeV of the electron and 1.7 GeV of the tau). They can interact both electromagnetically and via the weak force. All the leptonic generations have an internal charge, called leptonic number, with value 1( 1) for leptons (anti-leptons) and it is conserved in all the interactions, with the exception of the experimentally-evident phe-nomenon of neutrino oscillation. In the SM, neutrinos are electrically neutral particles, can interact only via the weak force and they are supposed to be massless. This last assump-tion is in contrast with the experimental evidence of their oscillaassump-tion, i.e. the possibility for a neutrino of one of the three generations to transform into a different one. In fact, this phenomenon implies that neutrinos are not massless.
The quarks are the second category in which the fundamental fermions are divided. The quarks are also divided into three generations as the leptons:
u d ! c s ! t b ! (1.4) and have fractional electric charge, in particular 2/3 · e for the quarks in the first row of (1.4), called u-type, and 1/3 · e for the ones belonging to the second row, called d-type. The quarks own an internal charge called flavour (up, down, charm, strange, top, bottom) and different quantum numbers:
• colour (red, blue and green for particles and anti-red, anti-green and anti-blue for anti-particles) which is the charge of the strong force and the choice of this name is for analogy with the properties of primary colours. The only states that can be observed in nature are colourless combinations. This property of the colour charge is called con-finement. Given the fermionic nature of the quarks, they combine to produce bound states (hadrons) in two ways: a quark/anti-quark pair with the same colour/anti-colour charge (mesons) or three quarks/anti-quarks with all the three different colour/anti-colours mixed together (baryons).
• baryon number, which is 1/3 ( 1/3) for the quarks (anti-quarks), is a strictly con-served additive quantum number.
• flavour number which is preserved under strong and electromagnetic interactions, but not under weak interactions.