Commissione Europea e la Regione Calabria declinano ogni responsabilit`a sull’uso che potr`a essere fatto delle informazioni in essa contenute.
wenn man nach Zeit und Umst¨anden das m¨ogliche getan hat.‘
Sommario
Ingegneria Chimica e dei Materiali Scuola di dottorato ”Pitagora”
Dottorato di ricerca
Chemical looping per la desolforazione: Modellazione e Applicazioni a sistemi di potenza
di Jessica Settino
I processi di assorbimento, sia fisici che chimici a base di ammine, sono attualmente utilizzati per rimuovere efficacemente i composti dello zolfo. Nonostante l’eccellente desolforazione, questa strategia `e termicamente inefficiente, in quanto richiede gas a bassa temperatura. Scopo di questo lavoro `e quello di analizzare soluzioni alternative che operino a temperature pi`u elevate. A tale scopo, `e stato analizzato il processo del chemical looping. Si tratta di una nuova tecnologia, in cui un materiale sorbente, in contatto con il gas combustibile grezzo, viene convertito nel suo solfuro e poi rigenerato cos`ı da ricominciare il ciclo. Il sistema `e costituito da due reattori: uno per la rigenerazione e l’altro per la desolforazione. Un modello matematico di tale sistema `
e stato sviluppato con il software Athena Visual Studio ed i suoi risultati confrontati con quelli ottenuti dal modello proposto dal National Energy Technology Laboratory, validati sulla base di dati sperimentali.
Nella fase successiva, il sistema modellato `e stato applicato a tre casi studio di interesse industriale: per la produzione di energia elettrica negli impianti a ciclo combinato con gassificazione integrata, nei processi di metanazione, nei processi per la sintesi del metanolo.
Mediante simulazioni, condotte con i software commerciali Thermoflex e UniSim Design, sono stati studiati gli effetti della desolforazione a caldo sulle prestazioni dei diversi sistemi.
Abstract
Chemical Engineering and Materials Doctoral school ”Pitagora”
Doctor of Philosophy
Chemical looping desulphurization: Model and Applications to Power Systems
by Jessica Settino
Absorption processes are currently used to efficiently remove sulfur compounds. In spite of the excellent desulphurization, this strategy is thermally inefficient, since it requires gas at low temperature. Aim of this work is to analyze alternative solutions operating at higher temperature. To this purpose, the chemical looping process has been investigated. It is a novel technology, where a sorbent, in contact with the raw fuel gas, is converted into its sulfide and then regenerated so as to restart the cycle. The system consists of two reactors: the regeneration and desulphurization reactor.
A mathematical model has been developed with the software Athena Visual Studio and the results compared with the model proposed by the National energy technology laboratory, validated through experimental date.
Afterward, the modeled system has been applied to three case study of industrial interest: for electricity production in the Integrated Gasification Combined Cycle, in methanation processes, in processes for methanol synthesis.
By means of simulation analysis, with the commercial software Thermoflex and UniSim Design, the effects of hot gas desulphurization on the performance of the different systems have been investigated.
I would like to thank my research advisor Prof. Mario Amelio, from University of Calabria, and Dr. Tilman Schildhauer, from Paul Scherrer Institut, for their precious guidance and support.
I am also grateful to Professors F. Di Maio and A. Di Renzo, for their valuable comments and suggestions.
A special thanks to Dr. Peter Jansohn who gave me the opportunity to be part of his research group and work in a so active and friendly environment.
Thanks to all the colleagues, always available for support from a professional and human point of view.
Thanks to all the people I met during this great experience, with its up and down.
Sommario iv
Abstract v
Acknowledgements vi
Contents vii
List of Figures x
List of Tables xiii
Acronyms xiv
Nomenclature xv
1 Introduction 1
1.1 Thesis aims and objectives . . . 4
1.1.1 Methods and instruments . . . 4
1.2 Overview . . . 6
2 Syngas desulphurization and sulfur recovery 9 2.1 Cold gas desulphurization technologies . . . 10
Physical Absorption . . . 12
Chemical Absorption . . . 12
2.2 Hot gas desulphurization technologies . . . 13
2.2.1 In situ desulphurization . . . 13
2.2.2 External desulphurization . . . 14
2.3 Sulfur recovery . . . 16
2.3.1 Claus Process . . . 16
2.3.2 Wet Flue Gas Desulphurization . . . 17
3 Chemical looping desulphurization process 19 3.1 Chemical looping desulphurization . . . 20
3.2 Sorbent Screening . . . 21
3.3 System Configuration . . . 25 vii
4 Chemical Looping Model 31
4.1 Reaction Kinetics . . . 32
4.1.1 Uniform-Conversion Model . . . 32
4.1.2 Shrinking core Model . . . 33
4.1.3 Grain Model . . . 37
4.2 Hydrodynamics . . . 39
4.3 Heat transfer . . . 41
4.4 Model assumptions . . . 42
4.5 Model validation . . . 43
4.6 Sensitivity Analysis & Results discussion . . . 44
4.7 Combination of In situ & external desulphurization . . . 47
4.8 Reactor Model Scale-up . . . 48
5 Application to Integrated Gasification Combined Cycle 50 5.1 IGCC with cold gas desulphurization . . . 50
5.2 IGCC with hot gas desulphurization . . . 55
5.3 Energy efficiency indicators . . . 58
5.4 Cold gas clean-up vs. Hot gas clean-up . . . 59
5.5 Effect of the desulphurization temperature . . . 63
5.6 Outlooks & perspective . . . 65
6 Application to Coal-to-SNG Process 67 6.1 Syngas Cleaning & conditioning . . . 68
6.2 Methanation reactor . . . 71
6.2.1 Adiabatic fixed bed reactor model . . . 71
6.3 Methanation Process . . . 75
6.4 Gas upgrading . . . 78
6.5 Results discussion & comparison . . . 80
6.6 Outlooks & perspective . . . 81
7 Application to Methanol Production 82 7.1 Methanol synthesis reactor . . . 84
7.1.1 Boiling water reactor model for Methanol synthesis . . . 85
7.1.2 Boiling water reactor model results . . . 91
7.2 Process Design with cold gas desulphurization . . . 93
7.3 Optimization & analysis . . . 96
7.3.1 Effect of reactor size . . . 96
7.3.2 Effect of reactor length . . . 97
7.3.3 Effect of the reactor pressure . . . 98
7.4 Process design with hot gas desulphurization . . . 100
7.5 Conclusions . . . 101
8 Conclusions and outlooks 103
A Flowsheet of the Methanation Process with CGD 106
C Flowsheet of the Methanol Synthesis Process with CGD 125 D Flowsheet of the Methanol Synthesis Process with HGD 133
Bibliography 141
1.1 Grubb curve of the development of a new technology . . . 3
2.1 Equilibrium in chemical and physical absorption processes . . . 11
2.2 Schematic representation of the absorption process. . . 11
2.3 H2S equilibrium concentration . . . 14
2.4 Sulphur Removal Technologies . . . 15
2.5 Wet FGD . . . 18
3.1 Scheme of Chemical looping desulphurization . . . 20
3.2 Reactor types and possible configurations . . . 29
3.3 Chemical looping desulphurization by transport reactors . . . 30
4.1 Chemical reactor model: influencing aspects . . . 31
4.2 Uniform Conversion Model: schematic representation. . . 33
4.3 Schematic representation of the Shrinking Core Model. . . 34
4.4 Schematic representation of the grain model. . . 37
4.5 Voidage profile . . . 41
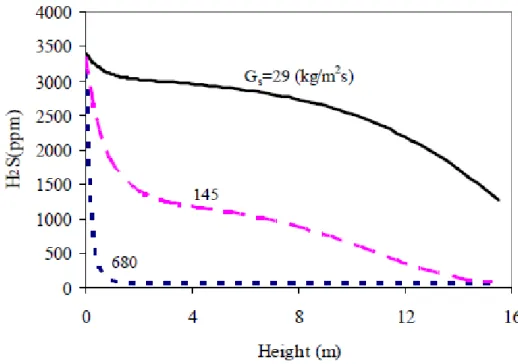
4.6 NETL model: H2S concentration along the reactor for different solid mass flows . . . 43
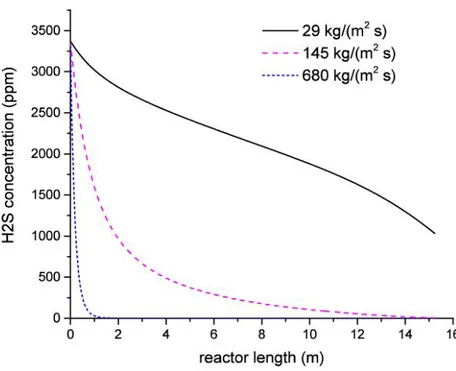
4.7 H2S concentration along the reactor for different solid mass flows . . . . 44
4.8 H2S concentration and ZnO conversion along the reactor for different solid mass flows . . . 45
4.9 H2S concentration for different initial sulfur concentration . . . 46
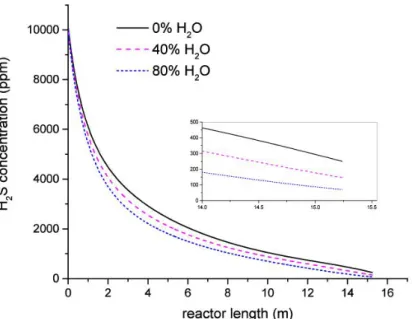
4.10 H2S concentration along the reactor for different operating temperatures 46 4.11 H2S concentration along the reactor for different water concentrations . 47 4.12 Solid mass flux required for in situ and external desulphurization for the same H2S exit concentration . . . 48
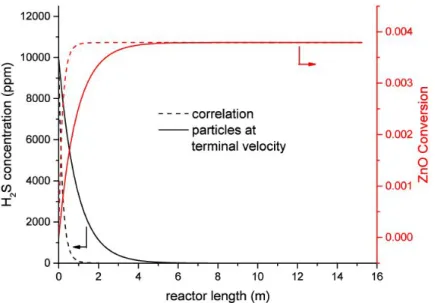
4.13 Effect of the estimated particle velocity on the H2S concentration and sorbent conversion . . . 49
5.1 Scheme of an Integrated Gasification Combined Cycle with cold gas desulphurization . . . 53
5.2 Scheme of a Heat Recovery Steam Generator. From: Lozza 2006 . . . . 55
5.3 Scheme of an Integrated Gasification Combined Cycle with hot gas desulphurization . . . 56
5.4 Hot gas desulphurization and regeneration unit. . . 57
5.5 Heat recovery from the hot exhaust of the gas turbine for cold gas desulphurization . . . 61
5.6 Heat recovery from the hot exhaust of the gas turbine for hot gas
desulphurization . . . 62
6.1 Alternative process unit technologies for each step of the Coal-to-SNG process with illustration of the energy integration system. . . 68
6.2 Flowsheet of the Rectisol Process in UniSim Design . . . 70
6.3 Concentration of the main reactant under adiabatic conditions for a Pressure of 1 atm, temperature of 550 K and H2/CO equal 3. . . 72
6.4 Temperature profile under adiabatic conditions . . . 73
6.5 Methane conversion under adiabatic conditions at 1-10-30 bar . . . 73
6.6 Temperature profile under adiabatic conditions at 1-10-30 bar . . . 74
6.7 Equilibrium Curve for methanation process . . . 75
6.8 Flowsheet of the methanation plant in UniSim Design . . . 76
6.9 Flowsheet of methanation process with hot gas desulphurization in UniSim Design . . . 77
6.10 Flowsheet of the Amine Process in UniSim Design . . . 79
7.1 Alternative process unit technologies for each step of the Methanol Production . . . 82
7.2 Scheme of a Quench Reactor. . . 85
7.3 Boiling Water Reactor . . . 86
7.4 Temperature profile at different pressures . . . 88
7.5 Methanol concentration at different pressures . . . 89
7.6 Temperature profiles in the adiabatic reactor for different inlet temperature 89 7.7 Methanol conversion profiles in the adiabatic reactor for different inlet temperature . . . 90
7.8 geometric reactor information to calculate the heat transfer coefficient . 90 7.9 Effect of the inlet temperature variation (180-230-280°C) on methanol conversion. . . 91
7.10 Effect of the shell temperature variation on methanol conversion . . . . 92
7.11 Effect of the shell temperature variation on the temperature profile . . . 92
7.12 Effect of the inlet flow variation on methanol fraction . . . 93
7.13 Flowsheet of the methanol production plant in UniSim Design . . . 95
7.14 Effect of reactor size variation on recirculated gas and methanol production 96 7.15 Effect of reactor size variation on the methanol fraction converted . . . 97
7.16 Effect of reactor size variation on compressor power . . . 97
7.17 Effect of reactor length variation on recirculated gas and methanol production . . . 98
7.18 Effect of reactor size variation on the methanol fraction converted . . . 98
7.19 Effect of reactor length variation on compressor power . . . 99
7.20 Effect of operating pressure variation on gas recycle and methanol production . . . 99
7.21 Effect of operating pressure variation on methanol conversion . . . 100
7.22 Effect of operating pressure variation on the power consumption of compressor K100, K101 and K102 . . . 100
7.23 Effect of operating pressure variation on overall power consumption . . 101
B.1 Flowsheet of methanation process with hot gas desulphurization in UniSim Design . . . 118 C.1 Flowsheet of the methanol production plant in UniSim Design . . . 126 D.1 Flowsheet of the methanol production plant with HGD in UniSim Design 134
1.1 Technology Readiness Levels . . . 7
2.1 Cold desulphurization technologies . . . 10
3.1 Main characteristic of reactors used for hot gas desulphurization. . . 26
4.1 Chemical and Physical properties of Zinc Titanate and model Parameters 39 4.2 Commercial riser characteristic. . . 48
5.1 Gasifier specifics . . . 52
5.2 Coal Properties . . . 52
5.3 Acid Gas Removal specifics . . . 54
5.4 Power Section specifics . . . 54
5.5 Gas Turbine specifics . . . 59
5.6 Performance of IGCC with Cold Gas Desulphurization . . . 60
5.7 IGCC desulphurization temperature variation . . . 64
5.8 Contaminants and emission limits . . . 65
5.9 Clean-up systems for hot gas desulfurization . . . 65
6.1 Clean syngas to the methanation reactor . . . 71
6.2 Gas composition before and after upgrading . . . 78
6.3 Efficiency indicators & produced SNG . . . 81
7.1 Gasification & Conditioning process . . . 83
7.2 Parameter Values . . . 88
7.3 Clean Syngas after Rectisol Process . . . 93
7.4 Clean Syngas after HGD . . . 101
AGR Acid Gas Removal ASU Air Separation Unit CCT Clean Coal Technologies CFD Computational Fluid Dynamics CGD Cold Gas Desulphurization CGE Cold Gas Efficiency
CL Chemical Looping
FGD Flue Gas Desulphurization
GM Grain Model
GT Gas Turbine
HGD Hot Gas Desulphurization HGE Hot Gas Efficiency
HHV High Heating Value
IEA International Energy Agency
IGCC Integrated Gasification Combined Cycle LHV Low Heating Value
SCM Shrinking Core Model SNG Synthetic Natural Gas ST Steam Turbine
TIT Turbine Inlet Temperature TRL Technology Readness Levels WEO World Energy Outlook WGS Water Gas Shift
A reactor cross sectional area m2 av particle surface area per unit reactor volume ms2mr−3
C Concentration mol m−3
Cp heat capacity J mol−1 K−1
D Diffusivity m2 s−1
Mw molecular weight g mol−1
˙
m, G mass flow kg s−1
n molar flow rate mol s−1
N molar flow of gas reacted per pellet mol s−1 nP number of sorbent particle
h gas-solid heat transfer coefficient W m−2 K−1
∆H enthalpy of reaction J mol−1
P Power W (Js−1)
r radial coordinate m
< reaction rate mol kgs−1s−1
R Ideal Gas Constant J mol−1 K−1
R0 particle radius m
T temperature K
t time s
X conversion of the sorbent
z axial coordinate m Greek symbols ε, εb bed voidage ε0 particle porosity η efficiency xv
µ viscosity Pa s ρ density kg m−3 ω mass fraction subscript 0 initial g gas or grain s solid cat catalyst
To my friends
and
To you, who are reading
Introduction
During the last decades, the energy demand grew exponentially, together with the services provided and the technological development. In parallel, new challenges, i.e. climate change and natural source depletion, arose. Through market instruments, including green certificate, aid investments, tax reduction or exemptions, governments tried to promote renewable energy conversion systems, increasing their competitiveness towards fossil fuel technologies. This project, funded by the European Social Fund (FSE) and Calabria Region, is also one of the initiative to promote the research and the development of new technical concepts.
In spite of the Community Research efforts and the policy measures, the fossil fuel infrastructures, with their well established know-how, are deeply rooted in the energy market, contrasting the introduction of new technologies. In fact, according to the assertions of the World Energy Outlook (WEO) 2007, published by the International Energy Agency (IEA), widely recognized for global energy analysis and statistics in the medium/long term, more than 80% of the primary energy supply still comes from fossil fuels such as coal, natural gas and oil, and this dependence is likely to continue in the coming decades. These projections have been confirmed by the WEO 2014, which highlights an increment of 15% of coal already in the next decade. Thus, even if the development of renewable technologies is essential to produce energy in a sustainable way, reducing pollutant emissions, it is also worth to note that, because of the prevalence of fossil fuel infrastructures and carbon availability at low price, it is reasonable to expect that coal will represent one of the primary energy transitional sources during the development of renewable technologies. Hence, the improvement of Clean Coal Technologies is a key element to lower the emissions in the short and medium term.
Clean Coal Technologies (CCT) refers to all that strategies which allows to increase the efficiency of coal conversion plants, respecting the most strict regulations. Among these strategies, including Ultra Super Critical steam power plants, coal liquefaction and gasification, the latter is extremely attractive, with a wide range of possible applications,
as will be later highlighted.
Gasification of coal with air or oxygen produces the syngas, mainly composed of H2, CO, CO2, H2O, CH4 and various contaminants such as NH3, H2S and COS, which must be removed before using. These contaminants in fact could seriously damage the downstream technologies and harm the environment; for this reason their emission is restricted by law. A large number of purification processes is available: traditional ones require syngas cooling, followed by a subsequent heating that reduces significantly the overall efficiency of the process. The development of purification processes at high temperature is a key step to increase energy efficiency of the gasification process and reduce costs of the final products.
This work is focused on the removal of sulfur compounds, especially hydrogen sulfide, which must be reduced to concentrations of a few ppm, to both non-damage the components of the plant and to reduce the environmental impact once the hydrogen sulfide is transformed into SO2.
The high temperature syngas desulphurization is still recent and more efforts are needed to reach a mature level. Hot Gas Desulphurization is based on the use of regenerable metal oxide to adsorb H2S through a chemical looping process. This work will be focused on the investigation of this technology, as well as on its applications for:
1. direct electricity generation in Integrated Gasification Combined Cycle (IGCC) 2. high value energy carriers production, such as hydrogen or natural gas
3. synthesis of valuable products, like methanol, highly required in the chemical industry.
A preliminary analysis of the desulphurization process itself and its interaction with the components of the system in which it is introduced, is necessary. This particularly applies to chemical looping. In fact, even if the chemical looping process is quite known in chemical industry, its application to hot gas desulphurization is recent and still at an early stage of its technological development, according to the definition given by the Technology Readiness Assessment Guide published in 2011 by the US Department of Energy and adopted by the European commission in the work HORIZON 2020. In this document, the technology development is defined as:
“the process of developing and demonstrating new or unproven technology, the application of existing technology to new or different uses, or the combination of existing and proven technology to achieve a specific goal.”
Technology Readiness Assessment Guide, (DoE, 2011) It is also worth noting that this definition includes new process design, seen as the combination of innovative and mature technologies. The above mentioned chemical
looping applications belong to this category. They are in fact a combination of several units interconnected to each other, with different maturity level, addressed to as Technology Readiness Levels (TRL). This aspect cannot be neglected when comparing different process designs, since the unit with the lowest TRL would introduce same uncertainty with regard to the overall system behavior.
In the Technology Readiness Assessment Guide a scale of nine TRL values is defined, from TRL1 to TRL9 which indicates a developed and proven technology, as described in more detail in table 1.1 at the end of this chapter. These guidelines assist the user through the whole research and development phases to the commercial plant, as the ’Grubb curve’, in figure 1.1, highlights. It is actually at this stage that the high risk and cost involved impede the technology development. The continuous black line refers to the investments’ cost which decrease to almost a constant value once the technology has reached a mature level, in gray instead, risks and uncertainty are represented. They are much higher in the early stages than later. This trend is due to the acquired know-how which reduces the risk derived from the low level of understanding of the process. Following the technological development of the chemical looping process and
Research
Development
Demonstration Deployment State of the Art
Technology Evolution over Time
Capital Requiremen t × T ec hnology Risk 1st commercial service Full Size Demonstration Plant
1 2 3 4 5 6 7 8 9 Actual Estimate TRL Mature Technology 2nd plant in service 3rd plant in service
Figure 1.1: Grubb curve of the development of a new technology. From: Teske, 2014
of its applications is beyond the scope of this thesis. The study will be limited to the first two steps TRL1 and 2, in which new technology concepts are identified, evaluated and selected based on literature review, modeling and simulation analysis. In fact,
Computational Aided Methods are particularly important in this phase, representing powerful tools for process analysis and optimization, process integration and cost estimation.
1.1
Thesis aims and objectives
On the basis of what has been said, the aim of this thesis will be to:
1. develop a model of the chemical looping desulphurization process with a good confidence level;
2. identify potential applications;
3. investigate the new process design through simulation analysis and the influences of the new technology on the operating conditions of the other component units, and vice versa;
4. compare the new process design with the previous one to evaluate if there is any potential advantage.
1.1.1 Methods and instruments
In order to achieve the above specified targets, an holistic approach has been used, according to the principles of the systems engineering method:
”The systems engineering method recognizes each system as an integrated whole even though composed of diverse, specialized structures and sub-functions. It further recognizes that any system has a number of objectives and that the balance between them may differ widely from system to system. The methods seek to optimize the overall system functions according to the weighted objectives and to achieve maximum compatibility of its parts.”
Systems Engineering Tools by Chestnut, 1965. Even if there could be many objectives (minimize cost, maximize the output or the efficiency), in this context, the focus will be limited to the energetic requirements of the systems, optimized in order to increase their efficiency, respecting the technical constrains. The analysis has been carried out through modeling and simulations (M&S). Even if these words are often used as synonymous, they actually indicate different aspects:
”Modeling is the process of producing a model; a model is a representation of the construction and working of some system of interest. A model is similar to but simpler than the system it represents. One purpose of a model is to enable the analyst to predict the effect of changes to the system. On the one hand, a model should be a close approximation to the real system and incorporate most of its salient features. On the other hand, it should not be so complex that it is impossible to understand and experiment with it. A good model is a judicious tradeoff between realism and simplicity.”
”A simulation of a system is the operation of a model of the system. The model can be reconfigured and experimented with; usually, this is impossible, too expensive or impractical to do in the system it represents. The operation of the model can be studied, and hence, properties concerning the behavior of the actual system or its subsystem can be inferred. In its broadest sense, simulation is a tool to evaluate the performance of a system, existing or proposed, under different configurations of interest and over long periods of real time.”
Introduction to modeling and simulation Maria, 1997 It is important to underline that models can mainly be divided into to categories: macroscopic models and CFD models. The CFD models are based on the conservation laws of mass, energy and momentum, giving a deep insight into the flow pattern. The mathematical model instead considers the object of study from a macroscopic point of view, with the implementation of the basic principles of mass and energy balances and/or empirical correlations. This way will be pursued to model the chemical looping process, due to the lower computational cost, which allows the integration of the model in the simulation of more complex systems.
In this work Athena Visual Studio has been used as modeling tool. Athena is a software package, developed to model chemical reactors, adsorption processes and catalytic reactions etc. It numerically solves sets of partial differential and/or algebraic equations with different boundary conditions. Suitable for both dynamic and steady-state analysis, it has the advantage of integrating in a single environment all tools that assist the user in the technology development phase: modeling, parameter estimation, optimal experimental design and model discrimination. Thus, the analyst is driven to a more active use of the model, not seen as a passive representation of experimental data but as an instrument which, based on the information step by step
implemented, leads to a better experimental planning. It also enables the direct link with other software (Excel, Aspen Plus, UniSim Design etc.), an extremely useful feature for subsequent simulations. As a consequence of the low maturity level of the analyzed technology and the subsequent lack of facilities, no experiments have been performed. Even if the model is based on literature data, sometimes not extremely recent due to confidential information and/or patent, it provides enough accurate results for a preliminary analysis. The chemical looping model, implemented in Athena, or more precisely, the two reactors that make up the chemical looping (as will be described in chapter 3), are later linked in UniSim Design to analyze their mutual influence and to simulate the overall system.
In UniSim Design, it was possible to automatically update all the inputs and outputs, allowing the user to control all the model parameter inside the UniSim environment. The latter is a commercial software, well known for system analysis and optimization. It has been used to simulate the overall plants for natural gas and methanol production and to investigate the effects of introducing the chemical looping on the whole system.
Furthermore, the use of this new technology for hot desulphurization has been evaluated in reference to an Integrated Gasification Combined Cycle. In this case, the amount of data required made the use of an other commercial software necessary, Thermoflex, specialized in simulation of power systems. Still based as UniSim on heat and mass balances, it enables the user to choose the components of the plant among the one actually available on the market, ensuring more accurate and reliable predictions.
1.2
Overview
This work is organized in two main sections. In the first part, the main focus is on chemical looping, in the second one, possible applications are discussed. Chapter 2 is a review of the technologies currently used for the desulphurization, whose limits and key strengths are underlined. In Chapter 3, the chemical looping process is described, different sorbents and reactor configurations are illustrated and compared in order to furnish a clear explanation of the factors leading to the choice of one rather than the other. Chapter 4 provides a detailed description of the developed model, analyzing the influence of the key variables on the reactor performance. The next three chapters deal with chemical looping applications: chapter 5 refers to Integrated Gasification Combined Cycles for electricity production, chapter 6 regards the production of methane by coal-syngas while chapter 7 suggests a new process design for the methanol synthesis. Finally, the most interesting results are summarized in chapter 8.
Table 1.1: Definition of the Technology Readiness Levels. From: Teske, 2014 and DoE, 2011
Relative Level of Technology Development Technology Readiness Level Definition Description Basic Technology Research TRL 1 Basic principles observed and reported
This is the lowest level of technology readiness. Scientific research begins to be translated into applied R&D. Examples might include paper studies of a technology’s basic properties or experimental work that consists mainly of observations of the physical world. Supporting Information includes published research or other references that identify the principles that underlie the technology.
Basic Technology Research or Research to Prove Feasibility TRL 2 Technology concept and/or application formulated
Once basic principles are observed, practical applications can be invented. Applications are speculative, and there may be no proof or detailed analysis to support the assumptions. Examples are still limited to analytic studies. Supporting information includes publications or other references that outline the application being considered and that provide analysis to support the concept. The step up from TRL 1 to TRL 2 moves the ideas from pure to applied research. Most of the work is analytical or paper studies with the emphasis on understanding the science better. Experimental work is designed to corroborate the basic scientific observations made during TRL 1 work.
Research to Prove Feasibility TRL 3 Analytical and experimental critical function and/or characteristic proof of concept
Active research and development (R&D) is initiated. This includes analytical studies and laboratory-scale studies to physically validate the analytical predictions of separate elements of the technology. Examples include components that are not yet integrated or representative tested with simulants. Supporting information includes results of laboratory tests performed to measure parameters of interest and comparison to analytical predictions for critical subsystems. At TRL 3 the work has moved beyond the paper phase to experimental work that verifies that the concept works as expected on simulants. Components of the technology are validated, but there is no attempt to integrate the components into a complete system. Modeling and simulation may be used to complement physical experiments. Technology Development TRL 4 Component and/or system validation in laboratory environment
The basic technological components are integrated to establish that the pieces will work together. This is relatively ”low fidelity” compared with the eventual system. Examples include integration of ad hoc hardware in a laboratory and testing with a range of simulants and small scale tests on actual waste. Supporting information includes the results of the integrated experiments and estimates of how the experimental components and experimental test results differ from the expected system performance goals. TRL 4-6 represent the bridge from scientific research to engineering. TRL 4 is the first step in determining whether the individual components will work together as a system. The laboratory system will probably be a mix of on hand equipment and a few special purpose components that may require special handling, calibration, or alignment to get them to function.
Continuation ... Relative Level of Technology Development Technology Readiness Level Definition Description Technology Development TRL 5 Laboratory scale, similar system validation in relevant environment
The basic technological components are integrated so that the system configuration is similar to (matches) the final application in almost all respects. Examples include testing a high-fidelity, laboratory scale system in a simulated environment with a range of simulants and actual waste. Supporting information includes results from the laboratory scale testing, analysis of the differences between the laboratory and eventual operating system/environment, and analysis of what the experimental results mean for the eventual operating system/environment. The major difference between TRL 4 and 5 is the increase in the fidelity of the system and environment to the actual application. The system tested is almost prototypical. Technology Demonstration TRL 6 Engineering pilot-scale, similar (prototypical) system validation in relevant environment
Engineering-scale models or prototypes are tested in a relevant environment. This represents a major step up in a technology’s demonstrated readiness. Examples include testing an engineering scale prototypical system with a range of simulants. Supporting information includes results from the engineering scale testing and analysis of the differences between the engineering scale, prototypical system/environment, and analysis of what the experimental results mean for the eventual operating system/environment. TRL 6 begins true engineering development of the technology as an operational system. The major difference between TRL 5 and 6 is the step up from laboratory scale to engineering scale and the determination of scaling factors that will enable design of the operating system. The prototype should be capable of performing all the functions that will be required of the operational system. The operating environment for the testing should closely represent the actual operating environment.
System Commissioning TRL 7 Full-scale, similar (prototypical) system demonstrated in relevant environment
This represents a major step up from TRL 6, requiring demonstration of an actual system prototype in a relevant environment. Examples include testing full-scale prototype in the field with a range of simulants in cold commissioning. Supporting information includes results from the full-scale testing and analysis of the differences between the test environment, and analysis of what the experimental results mean for the eventual operating system/environment. Final design is virtually complete.
TRL 8 Actual system completed and qualified through test and demonstration.
The technology has been proven to work in its final form and under expected conditions. In almost all cases, this TRL represents the end of true system development. Examples include developmental testing and evaluation of the system with actual waste in hot commissioning. Supporting information includes operational procedures that are virtually complete. An Operational Readiness Review (ORR) has been successfully completed prior to the start of hot testing.
System Operations
TRL 9 Actual system operated over the full range of expected mission conditions.
The technology is in its final form and operated under the full range of operating mission conditions. Examples include using the actual system with the full range of wastes in hot operations.
Syngas desulphurization and
sulfur recovery
Gasification processes using fuels with high sulfur content, such as coal, lead to a raw syngas rich in sulfur compounds, mainly H2S. This component, once released in the atmosphere, reacts with oxygen forming SO2, responsible for acid rain. In consequence of this, the international environmental regulations and in particular the European directive 30/78/1980 impose strict emission limits. Moreover, sulfur compounds cause corrosion problems to both piping and plant components, catalyst poisoning, health and safety risk. Thus, removing H2S impurities, in the most effective and efficient way, is essential. Many purification technologies are available, a review is presented in Wiheeb et al. 2013, while the most used ones are presented in the following sections.
They can be classified into:
• cold (low-temperature) gas desulphurization systems (CGD) • hot (or high-temperature) gas desulphurization systems (HGD).
The former are proven technologies, at a mature level and commercially available. They operates below 300 °C, typically in a range of 20-60 °C and some of them even require cryogenic stages. Physical and chemical absorption processes belong to this group. The main limits of cold wet technologies are the negative effect on the efficiency, caused by cooling and reheating duties, and the production of liquid effluent that must be treated.
Hot gas desulphurization systems are based on the adsorption of H2S with sorbents. Compared to CGD, they are dry processes, operating above 400°C. This determines an advantage in terms of both thermal efficiency and waste water treatments. These technologies are still under development and their reliability on a long term, is still not proven.
Once H2S is removed from the syngas, it has to be recovered. Thus, the principal sulfur recovery strategies will be also described.
2.1
Cold gas desulphurization technologies
Currently, desulphurization of gas stream is mainly based on absorption systems, where the acid gas is transferred from the gaseous phase into the solvent. Depending on the interaction between component to be removed and solvent, the absorption processes can be classified into chemical and physical. In table 2.1, the most common and widespread chemical and physical absorption processes, are summarized.
Table 2.1: Cold desulphurization technologies
methodology desulphurization technology operating temperature Absorption Physical Absorption: Selexol(DMPEG) -40°C Rectisol (Methanol) -10/-70 °C Purisol (NMP) -20/40 °C Chemical Absorption:
(MDEA, MEA, DEA et.) 20/60 °C
Figure 2.2 shows a schematic representation of a gas absorption system. In the absorber, the raw syngas is washed with a regenerable solvent, exploiting the tendency of the acid components to pass into solution with particular solvents. The purified gas exits from the head of the column while the solvent saturated of the gaseous compounds previously absorbed is extracted from the bottom. Usually, this process is favored by high pressure (5-205atm) and low temperature (20-60°C). The absorption loading capacity is different whether a physical or chemical solvent is used. In the first case, the removal capacity depends on the solubility of the acid gas which, accordingly to Henry’s law, is proportional to the partial pressure of the component that must be removed. Thus, for a given partial pressure, the amount of solvent required is proportional to the volumetric gas flow rate. Instead, when chemical absorption is used, the required solvent is proportional to the removed acid gas. For this reason, as figure 2.1 highlights, the use of physical processes is convenient when the compound to be removed is present
at high concentrations, thus with high partial pressure, in this case in fact, the volume of solvent required is less than that need in chemical processes for the same operation. In any case, the solvent, rich in acid compounds, must be regenerated, releasing the
Figure 2.1: Equilibrium in chemical and physical absorption processes
Figure 2.2: Schematic representation of the absorption process. Source: Wiheeb et al., 2013
acid components before being recycled to the absorber. This process is carried out at high temperature (115-130°C ) and low pressure (1.4-1.7atm). There are three possible regeneration strategies:
• flash desorption • stripping
The flash desorption represents the most economic method. It is based on pressure reduction, so that it will be the final pressure which determines the acid gas content in the regenerated solvent.
When stripping is used, the pressure reduction is followed by a desorption process where the rich solvent is contacted with an inert gas stream. In this way an almost pure solvent can be obtain. The drawback could be a diluted steam of contaminants leaving the regenerator.
The highest purity can be achieved with a reboiler. In this case in fact, the temperature increase reduces the solubility of the acid gas, which is released in the gas phase and acts as a ”stripping stream”. This represents the most expensive method, due to the heat required by the reboiler.
Flashing and stripping are usually applied for physical absorption while a reboiler is needed to break the bonds between solvent and solute in chemical absorption processes. The regenerated solvent is then compressed, cooled and recirculated to the absorber, while the gaseous compounds extracted from the regeneration column are sent to a specific treatment section.
Physical Absorption
These are the principal physical absorption processes currently used: 1. Rectisol
2. Purisol 3. Selexol
The first two have been developed for high pressure syngas production, (Hochgesand, 1970). The Rectisol process was patented by Lurgi and Linde. Its first application was during the 1950s in the Sasol-Secunda CTL Plant, which further proved its suitability for H2S and CO2 removal. Moreover, it was observed that it allows to absorb many other contaminants like ammonia and cyanides.
The Purisol process instead has been developed by Lurgi. It was applied to natural gas sweetening, even if recent successful applications on high pressure hydrogen have also been developed. It showed to be very selective towards H2S.
Chemical Absorption
Chemical processes differ for the use of solvent based on aqueous solutions of amines. Many chemical solvents are available for syngas sweetening: Monoethanolamine (MEA), diethanolamine (DEA), methyldiethanolamine (MDEA), di-isopropanol amine (DIPA), belonging to the group of alkanol-amines. The first alkanolamines, as sorbent for acid
gases removal, have been developed by RR Bottoms in 1930. Triethanolamine (TEA) were the earliest commercially available. Today MEA and DEA or a combination of both are widely used. MDEA shows an higher affinity with H2S and is usually preferred for desulphurization process also because of its lower energy requirements for solvent regeneration. Often a combination of different solvents is used but should be considered that this makes the regeneration a more critical step.
As shown in table 2.1, typical absorption processes are carried out at temperatures of 20-60°C but the reduction of removal efficiency as a consequence of temperature increase has to be taken into account. In fact, as reported in Wiheeb et al. 2013, increasing the temperature from 20°C to 60°C, the H2S removal efficiency decreases from 99% to 93% .
2.2
Hot gas desulphurization technologies
The increasing interest for high temperature sulfur removal is due to its potential in enhancing the efficiency, avoiding heat loss and reducing H2S concentration below 1 ppm. Hot gas desulphurization is based on the adsorption of H2S on solid compounds, mainly metal oxide which, under reducing conditions, are converted to their sulfide. Sorbents can be classified into non-regenerable and regenerable. The former are used for in situ, while the latter for external desulphurization, (Meng et al., 2010).
2.2.1 In situ desulphurization
In the In situ desulphurization, the sorbent is added directly into the gasification chamber at temperatures of 800-1000°C, (Abbasian et al., 1990b). Sorbents typically used for this application are alkali metals (Ca,Ba,Sr), as well as natural sorbents, containing high level of them, like dolomite (CaCO3MgCO3) and limestone (CaCO3), (Abbasian et al., 1990a, ´Alvarez Rodr´ıguez and Clemente-Jul, 2008, Borgwardt and Roache, 1984). Limestone, depending on the operating conditions, reacts with H2S through two different mechanism:
direct sulphidation:
CaCO3+ H2S → CaS + CO2+ H2O (2.1) or for sufficiently high temperature, CaO is produced by calcination of CaCO3, which then reacts with the hydrogen sulfide:
CaCO3 → CaO + CO2 (2.2)
Studies performed by Fenouil and Lynn, 1995a,b Zevenhoven et al., 1996, 1998 and on limestone and dolomite highlight the influence of the temperature on the sulfur removal capacity.
The highest desulphurization level can be reached for temperature slightly above the calcination temperature, because of thermodynamical equilibrium. Furthermore, for pressure of 35 bar typical of many gasifiers, with already low CO2 and H2O concentration, it is difficult to reduce H2S below 100 ppm, as figure 2.3 shows. The
Figure 2.3: H2S equilibrium concentration as a function of temperature, H2O and
CO2(from: Fenouil and Lynn 1995a)
equilibrium concentration of H2S can be obtained through the correlation suggested by Fenouil and Lynn 1996:
yH2S = 0.00175 yH2O y0.364CO2 P0.364 (2.4) where P is expressed in bar. In spite of the low price of the CaO-based sorbents, the thermodynamic limitation previously discussed and disposal problems of the produced waste limit the use of In situ desulphurization.
2.2.2 External desulphurization
In contrast to the in situ desulphurization, the external desulphurization occurs in a subsequent step. The syngas, exiting the gasifier, is introduced in a reactor and put in contact with the sorbent, which reacts with H2S and is converted in its sulfide. The sorbent is then regenerated with oxygen, steam or SO2 to restart the cycle. Depending on the fluidizing agent, a stream containing SO2 or H2S will be obtained at the regenerator exit. This approach is also known as Chemical Looping Desulphurization Process and will be analyzed in detail in the next chapter.
2. Syngas desulphurization and sulfur re covery 15 Desulphurization Process
Hot Gas Desulphurization Cold Gas Desulphurization
in Situ Desulphurization External Desulphurization
Chemical Looping by
2.3
Sulfur recovery
The gas stream rich in sulfur compounds, at the exit of the desorption column, is sent to the sulfur recovery unit to convert sulfur compounds to elemental sulfur. The aim of this recovery is two-fold: to obtain elemental sulfur salable on the market and to minimize pollutant emissions to the atmosphere. According whether H2S or SO2 is contained in the gas stream, different approach are used. Generally, H2S recovery is obtained by the Claus Process, while SO2 is treated with wet scrubbers.
2.3.1 Claus Process
As described by Cau and Cocco, the Claus Process allows to recover 90-98% of the initial sulfur, converting it to elemental sulfur. The main reactions are the following:
H2S + 3
2O2 → SO2+ H2O (2.5)
A thermal reaction, where part of the H2S is oxidized to SO2
2H2S + SO2 → 3S + 2H2O (2.6)
A catalytic stage, in which H2S reacts with SO2 to form elemental sulfur and water. Thus the global reaction will be:
3H2S + 3
2O2→ 3S + 3H2O (2.7)
The first step is represented by a fast and high temperature (1200-1400°C) oxidation carried out with an amount of air sufficient to oxidize about a third of the H2S. Afterwards, the hot gaseous stream is cooled in a heat recovery steam generator producing medium pressure steam and sent to the catalytic reactor at a temperature of about 200-260°C. One or more of these thermal and catalytic stages could be necessary to promote further H2S conversion. Finally, the gas is cooled to condense and remove the sulfur and the thermal energy released is recovered producing low pressure steam.
If the H2S concentration is below 10-15% in volume, other processes, like Selectox and Stretford are used. They consist of a catalytic stage to convert directly H2S into elemental sulfur.
When high sulfur recovery is required, the exhaust gas of the Claus plant, known as ”tail gas”, is sent to an other unit for further treatment. This section is usually used to dispose waste gases from other sections of the plant.
The Scot process is the most widely used. It consists of a low temperature catalytic stage, which allows to convert the sulfur compounds present into H2S, through a
cobalt and molybdenum based catalysts. The H2S is then cooled from 150°C to ambient temperature and sent to an absorption column operating with amines. The H2S-rich gas, at the exit of regeneration column is recycled to the Claus section while the treated gas from the top of the absorption column are incinerated or directly released into the atmosphere.
2.3.2 Wet Flue Gas Desulphurization
SO2 is produced by combustion processes as a consequence of the oxidation of sulfur compounds or, as for chemical looping, it derives from sorbent regeneration as will be described in chapter 3. There are many technologies to remove sulfur dioxide, one of these are the “wet scrubbers”. As described in Lozza 2006, they are used in at least 90% of the applications and allows to obtain very high removal efficiency, 92-95%. Moreover they represents a mature technology, with a well established know-how. They are based on absorption processes; the gas to be treated is put in contact with an aqueous solutions of calcium based sorbent which reacts with SO2 producing gypsum or hydrated calcium sulphate (CaSO4·2H2O), as equations 2.8 to 2.10 show. For an optimal sulfur recovery, an excess of sorbent should be used (Ca/S equal to 1.1/ 1.2).
SO2+ H2O → H2SO3 (2.8)
CaCO3+ H2SO3 → CaSO3+ CO2+ H2O (2.9)
CaSO3+ 1
2O2+ 2H2O → CaSO4· 2H2O (2.10) The calcium based sorbents usually used are limestone (CaCO3), dolomite (CaCO3· MgCO3) or hydrated lime (Ca(OH)2). The former are usually preferred because of their low cost.
To ensure a commercial high quality product, as equation 2.10 show, a sufficient amount of oxygen, should be provided. This is obtained by blowing air on the bottom of the scrubber, as highlighted in figure 2.5.
Chemical looping
desulphurization process
Chemical looping has gained in few decades increasing attention of the scientific community, due to its many applications. From a general point of view, it is based on the mechanism of adsorption. The term adsorption refers to heterogeneous processes, in which bonds are established between the surface of the solid and the reacting component. Thus, the adsorption capacity is approximately proportional to the available surface area which, in case of porous sorbents, is not only the external surface, but also the one formed by the internal walls of the pores. For this reason, the solid can usually adsorb up to minimal traces of solute, making the process of adsorption ideal to treat dilute solutions.
The chemical looping system consists in two reactors: a fuel reactor where the sorbent is reduced and the regenerator where it is re-oxidized with a cycling process.
Based on this basic concept, a wide range of applications have been developed, analyzed and discussed:
Chemical Looping Combustion (CLC), for combustion purpose delivering pure CO2 in the dried flue gas that can be immediately captured and stored in CCS application; It includes Syngas-CLC process, in situ Gasification CLC, Chemical Looping with Oxygen Uncoupling (CLOU).
Chemical Looping for H2 production which includes Chemical Looping Reforming (CLR), Chemical Looping Hydrogen (CLH), Coal Direct Chemical Looping Process (CDCL), Syngas Chemical Looping Process (SCL).
Calcium looping cycle for CO2 capture
Detailed review of chemical looping are widely available in literature, (Adanez et al., 2012, Fan, 2011), as well as on the used intermediate material which, for the above
mentioned applications is known as oxygen carrier, as firstly introduced by Lewis and Gilliland 1954 in their patented work ”Production of pure carbon dioxide”.
Only later, in 1990s chemical looping has been applied for hot gas desulphurization.
3.1
Chemical looping desulphurization
In the chemical looping process for hot gas desulphurization, the sorbent, usually a metal oxide, is brought in contact with the syngas and is converted into its sulfide. In the next step, the sorbent is regenerated with air so as to restart the cycle. These reactions, represented schematically in figure 3.1, can be expressed in a general form as follow:
MeOx Gas inlet
H2S - depleted N2, SO2
Gas
N2, O2 MeSx
Figure 3.1: Scheme of Chemical looping desulphurization
desulphurization:
xH2S(g)+ MeOx→ MeSx+ xH2O(g) (3.1) regeneration:
M eSx+ 3xO2(g) → xSO2(g)+ M eOx (3.2) For the regeneration, reaction 3.2 considers oxygen as oxidizer, since this is the most common procedure, but also steam or even SO2can be used, depending on the particular sorbent. Using steam as oxidizer the reaction becomes:
M eSx+ xH2O(g) → xH2S(g)+ M eOx (3.3) Steam allows to operate at constant temperature, while the regeneration with oxygen leads to strongly exothermic reaction. Regarding the regeneration with SO2, the main advantage is represented by the direct production of elemental sulfur but it is applicable
only to few sorbents: Iron, Cerium and Manganese, according to reaction 3.4 M eSx+ x 2SO2(g) → 3x 2S(g)+ M eOx (3.4)
During the regeneration, side reactions could occur, as the formation of metal sulfate, an inert with respect to the desulphurization, which consequently reduces the sorbent reactivity:
M eS + 2O2(g) → M eSO4 (3.5)
Thus, it is important to determine the conditions under which reaction 3.5 occurs, in order to guarantee a satisfactory performance over many sulphidation and regeneration cycles.
Since the sorbent properties and reaction mechanisms change with temperature, pressure and/or syngas composition, it is essential to specify the operating conditions.
In particular, it would be advantageous to use an adsorption pressure close to the gasification pressure, usually of 20-30 bar, to avoid the use of compressors.
Similarly, the regeneration should be carried out at the same pressure of the absorption process, to reduce problems linked to pressure change.
Regarding the temperature, two different ranges could be identified:
high desulphurization temperature, above 650 °C ensures high reaction rate but also increases the risk of sintering which leads to lower desulphurization efficiency low desulphurization temperatures, in the range of 350-550 °C, are characterized by lower reaction rate but present the advantage of a good compromise between thermal efficiency and technical and economical feasibility.
Lower temperatures reduce sintering problems ensuring good performance for longer periods, contemporary ensuring a wider sorbent choice, (Slimane and Abbasian, 2000b). Once the area of analysis is well defined, the subsequent step is a careful investigation of the sorbent characteristics.
3.2
Sorbent Screening
The development and commercialization of chemical looping desulphurization systems strongly depends on the improvement of sorbent materials properties. As underlined in Atimtay and Harrison 1998, the main features required to a sorbent are the following:
• selective reaction with H2S and COS to guarantee a removal efficiency up to 99% in the temperature range of 400-650°C
• chemical stability and high reaction rate for both sulfidation and regeneration • good thermal properties to avoid sintering as well as reduction of the sorbent
porosity and of the contacting surface area
• mechanical strength to reduce attrition or cracking and ensure the lowest loss of sorbent over many cycles.
Not surprisingly, finding an element, that can fulfill all these requirements simultaneously, is not an easy task. Often a compromise is needed. To increase the rate of reaction for example, smaller particles with high porosity and large surface area could be used, but the resistance to attrition and deterioration decreases proportionally.
For a first screening, in order to identify the suitable sorbents, thermodynamic calculations have been performed by many authors, (Girard et al., 2014, Meng et al., 2009, Slimane and Abbasian, 2000b, Westmoreland and Harrison, 1976). Thermodynamic studies provide two important information:
• operating conditions under which a reaction is promoted and its products are stable
• heat of reaction.
Westmoreland and Harrison 1976 analyzed the oxides of 28 elements and determined their sulfur removal at equilibrium, minimizing the free energy. From these results, considering as selecting criteria a removal efficiency of more than 95%, the most promising sorbents turned out to be Zn, Cu, Fe, Mo, Ba, Ca, Co, Mn, Sr, V and W. Every sorbent has its own advantages and limitations. Further studies tried to overcome the sorbent degradation by adding a supporting material, to increase the mechanical stability. Mixed oxides and natural sorbents containing high concentration of them have been also tested. As in Frau 2009, the most suitable for hot gas desulphurization are described: Iron oxide, cerium oxide, copper oxide, tin oxide, zinc oxide and mixed-metal oxide such as zinc titanate.
Iron oxide
Iron oxide reacts with H2S according to the following reactions:
desulphurization
3H2S(g)+ F e3O4(s)→ 3F eS(s)+ 3H2O(g) (3.6) regeneration
4F e3O4(s)+ O2(g) → 6F e2O3(s) (3.8) As reactions 3.7 and 3.8 show, during the regeneration both the converted sorbent and the unreacted F e3O4 are oxidized, producing F e2O3 which reacts with CO and H2 to produce again F e3O4.
3F e2O3(s)+ CO + H2→ 2F e3O4(s)+ H2O(g)+ CO2(g) (3.9) This step represents a loss in term of valuable components in the syngas stream. Moreover, this sorbent is not suitable for desulphurization temperatures above 550°C, because of thermodynamic equilibrium leading to too low conversions. Nevertheless, in the temperature range of 400-450°C, it shows a high reactivity which makes it suitable for medium temperature applications.
Cerium oxide
Cerium oxide can be used for high temperature applications, above 600°C, where it shows a good removal efficiency and easy regeneration, which can be carried out using SO2 as regenerating agent. The possibility to obtain elemental sulfur directly from the regeneration process, avoiding the recovery section, represents an extremely interesting property. Nevertheless, its limited success is due to the high cost and its low absorption capacity at low temperatures, which makes necessary more than one desulphurization step.
Copper oxide
The main limit of Copper oxide (Cu2O) is the tendency to reduce to elemental copper. In recent studies to stabilize the sorbent and increase its sulfur removal efficiency the use of mixed metal oxide, in particular manganese, and alumina have been suggested in Slimane and Abbasian 2000a
Tin oxide
Tin oxide SnO2 adsorbs H2S according to the following reaction:
desulphurization
SnO2(s)+ H2S(g)+ H2(g)→ SnS(s)+ 2H2O(g) (3.10) regeneration
As reaction 3.11 shows, the regeneration is carried out using steam. This allows to avoid the strong temperature increase typical of air regeneration processes. In this way, it is possible to preserve the chemical and mechanical properties of the sorbent, over several sulfidation/regeneration cycles. According to the studies of Haldor Topsoe A/S, SnO2 allows to obtain final H2S concentrations below few ppm. However, the main drawback is represented by its stability, for temperatures above 231.9 °C, in fact, Sn is stable in liquid and metallic form.
Zinc oxide
Zinc oxide reacts with H2S as reaction 3.12 shows:
desulphurization
H2S(g)+ ZnO(s)→ ZnS(s)+ H2O(g) (3.12) regeneration
ZnS(s)+3
2O2(g) → SO2(g)+ ZnO(s) (3.13) As eq. 3.13 shows, oxygen is used as regeneration agent, because of the highly exothermic reaction and the risk of sulfate formation, diluted air is used. Regarding the desulphurization step instead, ZnO shows excellent performance:
• highly favorable thermodynamics • fast reactions
However, ZnO shows a strong tendency to volatilization with consequently loss of sorbent.
For this reason it is used in mixture with other metal oxide. According to Elseviers and Verelst 1999, among zinc-based sorbents, zinc titanate (Zn2TiO4) is the most effective for intensive desulphurization.
Zinc Titanate
Zinc Titanate (Zn2TiO4) is composed of zinc oxide and titanium dioxide, but only the former reacts with H2S, while TiO2 increases its stability and reduce its tendency to volatilization. desulphurization H2S(g)+ 1 xZnx(s)+ T iyOx+2y (s)→ ZnS(s)+ y xT iO2(s)+ H2O(g) (3.14)
regeneration
xZnS(s)+ yT iO2(s)+ 3x
2O2(g)→ xSO2(g)+ ZnxT iyOx+2y (s) (3.15) The properties of this sorbent are strongly affected by the relative amount of the two compounds, since increasing the ZnO content the stability of the sorbent decreases, but its removal efficiency increases. An optimal ZnO /TiO2 value of 1.5 has been obtained. Particularly important is the regeneration process carried out with dilute air to prevent sulfate formation. Moreover, the temperature has to be in the range of 725-760 °C; temperature above 725°C prevents the formation of sulfates, while temperatures below 760°C prevents ZnO sintering. Even if Zinc Titanate allows to obtain very high removal efficiency, it is quite expensive. In recent studies (Jun et al., 2001), Zn-Ti-based sorbents mixed with cobalt and nickel have been tested showing a good desulphurization capacity without deactivation over many sulphidation/regeneration cycles.
Due to its properties and ensuring low residual H2S concentration of the order of few ppm at temperature of 500-650°C, zinc titanate will be used in the developed model.
It is worth pointing out that physical and mechanical properties, such as sorbent dimension, gas-solid interfacing surface area, attrition resistance are also influenced by the used reactor. This aspect will be analyzed in detail in the next section.
3.3
System Configuration
As previously mentioned, the hot gas desulphurization consist of two reactors, which could work in series or in parallel. The reactor types that can be used are:
• fixed bed • fluidized bed • transport reactor
Operating conditions as well as syngas composition have a strong impact on the choice of the reactor type, which on the other hand strongly affects the mechanical and physical properties of the sorbent. Table 3.1 summaries the main characteristic of the above mentioned reactors, discussed with more detail in the following sections, Frau 2009.
Table 3.1: Main characteristic of reactors used for hot gas desulphurization. Adapted from: Atimtay and Harrison 1998, Frau 2009
Reactor type Fixed bed Fluidized bed Transport reactor Reactor features:
Operation mode discontinuous continuous continuous reactor
dimensions
large medium small
pressure drop high medium low
heat exchange troublesome good good
temperature distribution large temperature gradients uniform uniform gas velocity (m/s) 0-0.7 0.01-0.4 2-20 solid hold-up 0.6 0.3-0.55 0.01-0.1 solid residence time
hours minutes seconds
sorbent characteristics:
particle size 2-10 mm 50-500 µm 50-500 µm
particle utilization efficiency
small high maximal
Fixed bed reactor
In early studies, the desulphurization process was based on the combination of two fixed bed reactors, as represented in figure 3.2a. The syngas is sent to one reactor while the other is regenerated. When the H2S concentration reaches the breakthrough value, the valve switches the syngas to the regenerated reactor. Thus, in each reactor alternatively occurs regeneration and desulphurization processes. This is responsible of the discontinuous operating conditions. Because of the low attrition, high mechanical strength is not required but a pellet of large size (3-6mm) is needed to reduce the pressure drop. However this leads to higher diffusion resistance with consequently lower reaction rate.
Even if these problems could be reduced using using egg-shell sorbent, where the active material is a layer on an inert core, the experiments with fixed bed reactors have shown unsteady SO2 production, due to the low heat exchange which could leads to high temperatures, damaging the equipment and reducing the sorbent reactivity. As previously mentioned, in fact, the regeneration reaction can lead to significant temperature increase. For all these reasons, this configuration is not used.
Fluidized bed reactor
Compared to fixed bed reactors, fluidized bed ensures continuous operating conditions and higher flexibility since it enables to use different operating conditions for the regeneration and desulphurization. Two different units are used, one for each process step, in this case it is the sorbent which circulates between the two reactors. For this reason, higher sorbent resistance to attrition is required, compared to fixed bed but in any case lower than that necessary for the riser. The fluidized bed reactor offers a good compromise between the complexity of the entrained bed reactor and a good heat transfer which together with a uniform temperature allows to avoid hot spots and uncontrolled temperature increase. For this configuration, particles of low dimension are used, in the range of 100-300 µm. This ensures an optimal reactivity, with residence times in the order of minutes. Nevertheless, some important disadvantages, linked to bubble formation, should be considered:
• complex flow behavior, the gas moves both in bubble and emulsion phase
• by-passing of the gas in bubble phase, due to a limited mass transfer between the two phases.
Transport reactor
Similarly to bubbling fluidized bed, two units are used, one for the regeneration the other for the desulphurization, while the solid sorbent circulates between the two reactors. This systems are characterized by:
• reduced amount of sorbent in the reactor • short residence times
• high throughput
• excellent gas-to-particle mass and heat transfer
In this systems, the sorbent is diluted. This allows to avoid temperature run away during the regeneration process, but higher sorbent reactive is required, moreover if considered the low residence time in the order of seconds.However, sorbent reactivity does not represent a problematic aspect if considered that small size particles (<300 µm) are used, but the high particle velocity imposes strict requirements on their mechanical strength.
Based on the above described reactor type, the different configurations considered for hot gas desulphurization are schematically represented in figure 3.2.
Usually reactors of the same type, dimension and constructing material are used for both desulphurization and regeneration reactors, while different operating conditions are chosen. However, since similar particle size are used for both bubbling fluidized bed and circulating fluidized bed reactors, hybrid systems are also developed. Further considerations are needed for a good technical choice. As reaction 3.5 shows during the regeneration side reactions leading to formation of sulfate occur. Even if sulfates decompose, when high temperature are reached, their formation and decomposition cause mechanical stress which leads to particle breakage i.e loss of sorbent. A critical step is represented by the regeneration where sulfates formation and sorbent deterioration increase proportionally with time, with a negative impact on the overall desulphurization process. A good solution to minimize and prevent this problem is to reduce the contact time between the sorbent and the regeneration gas. This aim can be achieved of course through fluid bed but even more with risers, where the residence time is in the order of seconds. Moreover, to meet economic requests, due to the high operating pressure, the use of small reactor diameter would be preferred. The stress that the material undergoes because of the pressurized fluid is directly proportional to the reactor diameter. Since usually a huge amount of gas is elaborated, if small reactor diameter are used, high gas velocities are required. For all these reasons, the chosen reactor type is a transport reactor, i.e. a riser, for both
Air
Syngas
(a) Fixed bed reactors
Air Syngas
(b) riser - riser
syngas air
(c) Fluid bed reactors
Air Syngas
(d) fluid bed - riser
Figure 3.2: Reactor types and possible configurations
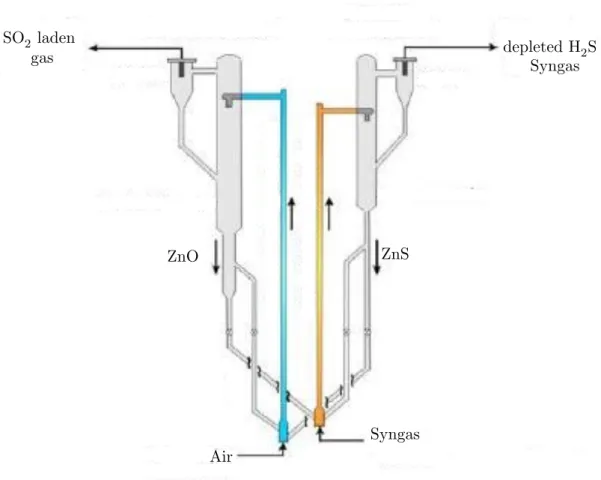
regeneration and desulphurization. A more detailed representation of these configuration is given in figure 3.3 for the particular case of zinc titanate. As shown in figure 3.3, the syngas is introduced in the desulphurization reactor, represented in yellow, from the bottom. The flue gas carries along with it the particles of zinc titanate sorbent due both to their small dimensions and weight and to the high gas velocity. During their residence time in the reactor, the particles react with H2S as described by reaction 3.14. The reacting ZnO (TiO2 is in fact inert as stated above) is, in this way, converted in its sulfide ZnS. In the upper region of the of the riser, the cyclone allows to separate from the gas stream the heaviest particles which fall to the hopper. Afterwards, they are sent to a second reactor, represented in blue, for the
Air Syngas depleted H2S Syngas SO2 laden gas ZnS ZnO
Figure 3.3: Chemical looping desulphurization by transport reactors. Adapted from: Monazam and Shadle 2005
regeneration. The process is similar from a hydrodynamic point of view, but as fluidizing agent air is used, or more precisely, air diluted with nitrogen reaching an O2 concentration of 2% to avoid the formation of zinc sulphate. The regenerated zinc titanate is again separated from the gas containing SO2 and recycled back to restart the process, while the SO2 laden gas is recovered by wet scrubbing as gypsum, as described in chapter 2.
A model of these system has been developed. The two riser, highlighted in blue and yellow in figure 3.3 have been implemented in Athena Visual Studio, while the interaction between the two reactors has been realized in UniSim with a proper interface code. These aspects will be described in detail in the next Chapter.