1
ALMA MATER STUDIORUM – UNIVERSITY OF BOLOGNA
SCHOOL OF ENGINEERING AND ARCHITECTURE
Department of Electrical, Electronic and Information Engineering
"Guglielmo Marconi"
COURSE OF LAUREA MAGISTRALE IN ELECTRONICS AND
COMMUNICATIONS SCIENCE AND TECHNOLOGY
MASTER THESIS
IN
ADVANCED ELECTROMAGNETIC TRANSMISSION
TECHNIQUES AND DEVICES M
INVESTIGATION IN THE USE OF TIME-MODULATION
TECHNIQUE FOR AN ULTRA-WIDEBAND READER
By Candidate:
VIJAYVARDHANREDDY KOTHAKAPA
SUPERVISOR
Prof. Ing. MASOTTI DEIGO
CO-SUPERVISOR Ing. MARCO FANTUZZI
2
Acknowledgement
First of all, I want to take this opportunity to express my genuine gratitude to my supervisor, as well as my mentor Dr. Diego Masotti, for guiding me into the appealing and fascinating world of wireless communication, particularly the antenna array system. I am grateful that he has not only provided me with excellent supervision, invaluable guidance, and assistance, but also much patience, encouragement and all-around support throughout the period of my thesis. It is my great honor to work with him and he is the kindest and wonderful supervisor that I have ever seen in my life.
I would like to express my special thanks to my Thesis Co-Supervisor Mr. Marco Fantuzzi. The Lab door was always open for me whenever I ran into a trouble or had a question about my research or writing. He consistently allowed this paper to be my own work but steered me in the right the direction whenever he thought I needed it.
I am very grateful to all of my colleagues in the office, for their practical and insightful discussion, constructive advice and outstanding assistance to the contribution of this thesis, as well as making me have a pleasant time at the university.
Finally, I must express my profound gratitude to my parents, sister and to my friends for providing me with unfailing support and continuous encouragement throughout my years of study and through the process of researching and writing this thesis. This accomplishment would not have been possible without them. Thank you.
3
List of Acronyms
CST
Computer simulation Technology
MWS
Micro-wave Studio
UWB
Ultra-Wide band
UHF
Ultra-High Frequency
RFID
Radio Frequency Identification
MHz
Mega Hertz
TMAs
Time Modulated Arrays
TMAA
Time Modulated Antenna Array
TMLA
Time Modulated Linear Array
ETMA
Enhance Time Modulated Array
WPT
Wireless Power Transfer
HB
Harmonic Balance
SLL
Side Lobe Level
WSN
Wireless Sensor Network
TOA
Time-Of-Arrival
TDOA
Time Difference of Arrival
DOA
Direction-of-Arrival
IR-UWB
Impulse Radio-Ultrawide band
PPM
Pulse position Modulation
PAM
Pulse Amplitude Modulation
WPAN
Wireless Personal Area Networks
SNR
Signal-to -Noise Ratio
AOA
Angle of Arrival
AF
Array Factor
4
GA
Genetic Algorithm
SIR
Signal to Interference Ratio
SOI
Signal of Interest
ADC
Analog to Digital Converter
DAC
Digital to Analog Converter
AM
Amplitude Modulation
SLL
Side Lobe Level
SR
Sideband Ratio
FM
Frequency Modulation
EH
Energy Harvest
5 Table of Figures……….…06
Abstract
………...….10Contents
Chapter 1: Introduction………...11 1.1 UWB………...12 1.2 TMA……….13 1.3 RFID……….14Chapter 2: UWB LOCALIZATION with TMA……….….15
Chapter 3: New UWB TMA two-spiral array………...…17
Chapter 4: DESIGN of a UWB ANTENNA………...22
Chapter 5: MATLAB SCRIPT ……… ………..…….47
Chapter 6: Simulation Results………...….48
6.1 Periodical or Sinusoidal input RF signals………. ………...48
6.2 UWB Pulse excitation………...….…51
CONCLUSION………...60
6
Table of Figures
Figure. 1. Schematic representation of a linear -element TMA with detailed
diodes switch bias networks, including dc-block capacitors ...14
Figure 2: Layout of two UWB Archimedean spiral antennas ………...17
Figure 3: The two 0.5TM points must be aligned in the figure of a two-element array for localization ………...18
Figure 4: Fixed ∑ and steerable ∆ pattern of an ideal array of two elements……….19
Figure 5: UWB wave form of pulse ……….20
Figure 6: Frequency spectrum of the adopted UWB pulse ………...20
Figure 7: Planar two elements of TMAs with spaced monopoles ………...22
Figure 8: UWB-UHF dipole antenna ………....22
Figure 9: Two arm Archimedean spiral antenna ………...25
Figure 10: Two Archimedean spiral antennas with the distance /2@4Ghz in CST studio……….26
Figure 11: Cartesian and polar plots for Farfield at frequency_3000MHz [1] .……….27
Figure 12: Cartesian and polar plots for Farfield at frequency_3000MHz {1[1,0]+2[1,0]}………..28
Figure 13: Cartesian and polar plots for Farfield at frequency_3000MHz {1[1,0]+2[1,180]}………..29
Figure 14: Cartesian and polar plots for Farfield at frequency_3000MHz [2] ……….30
Figure 15: Cartesian and polar plots for Farfield at frequency_3500MHz [1] ………31
Figure 16: Cartesian and polar plots for Farfield aT frequency_3500MHz {1[1,0]+2[1,0]} ………...32
Figure 17: Cartesian and polar plots for Farfield at frequency_3500MHz {1[1,0]+2[1,180]}………..33
Figure 18: Cartesian and polar plots for Farfield at frequency_3500MHz [2] ……….34
Figure 19: Cartesian and polar plots for Farfield at frequency_4000MHz [1] ……….35
Figure 20: Cartesian and polar plots for Farfield at frequency_4000MHz {1[1,0]+2[1,0]} ………...36
Figure 21: Cartesian and polar plots for Farfield at frequency_4000MHz {1[1,0]+2[1,180]} ………...37
7
Figure 23: Cartesian and polar plots for Farfield at frequency_4500MHz [1] ………....39
Figure 24: Cartesian and polar plots for Farfield at frequency_4500MHz {1[1,0]+2[1,0]} ……….40
Figure 25: Cartesian and polar plots for Farfield at frequency_4500MHz {1[1,0]+2[1,180]} ……….41
Figure 26: Cartesian and polar plots for Farfield at frequency_4500MHz [2] ………42
Figure 27: Cartesian and polar plots for Farfield at frequency_5000MHz [1] ………43
Figure 28: Cartesian and polar plots for Farfield at frequency_5000MHz {1[1,0]+2[1,0]} ……….44
Figure 29: Cartesian and polar plots for Farfield at frequency_5000MHz {1[1,0]+2[1,180]}………..45
Figure 30: Cartesian and polar plots for Farfield at frequency_5000MHz [2] ………46
Figure 31: Simulation of the sinusoidal pattern for 2UWB_3GHz ……….48
Figure 32: Simulation of the sinusoidal pattern for 2UWB_3.5GHz ………...49
Figure 33: Simulation of the sinusoidal pattern for 2UWB_4GHz ………...49
Figure 34: Simulation of the sinusoidal pattern for 2UWB_4.5GHz ………50
Figure 35: Simulation of the sinusoidal pattern for 2UWB_5GHz ……….50
Figure 36: The Sum and Difference patterns in correspondence of the 15th harmonic of the UWB spectrum i.e. at 3GHz. (with diameter d=0%) ………51
Figure 37: The Sum and Difference patterns in correspondence of the 15th harmonic of the UWB spectrum i.e. at 3GHz (with diameter d=4%) ……….52
Figure 38: The Sum and Difference patterns in correspondence of the 15th harmonic of the UWB spectrum i.e. at 3GHz (with diameter d=8%) ……….52
Figure 39: The Sum and Difference patterns in correspondence of the 15th harmonic of the UWB spectrum i.e. at 3GHz (with diameter d=16%) ...………53
Figure 40: The Sum and Difference patterns in correspondence of the 15th harmonic of the UWB spectrum i.e. at 3GHz (with diameter d=32%) ………...53
Figure 41: The Sum and Difference patterns in correspondence of the 20th harmonic of the UWB spectrum i.e. at 4GHz (with diameter d=0%) ……….54
Figure 42: The Sum and Difference patterns in correspondence of the 20th harmonic of the UWB spectrum i.e. at 4GHz (with diameter d=4%) ……….54
8
Figure 43: The Sum and Difference patterns in correspondence of the 20th harmonic
of the UWB spectrum i.e. at 4GHz (with diameter d=8%) ……….…55 Figure 44: The Sum and Difference patterns in correspondence of the 20th harmonic
of the UWB spectrum i.e. at 4GHz (with diameter d=16%) ………...……55 .
Figure 45: The Sum and Difference patterns in correspondence of the 20th harmonic
of the UWB spectrum i.e. at 4GHz (with diameter d=32%) ………...56 Figure 46: The Sum and Difference patterns in correspondence of the 25th harmonic
of the UWB spectrum i.e. at 5GHz ((with diameter d=0%))………...56 Figure 47: The Sum and Difference patterns in correspondence of the 25th harmonic
of the UWB spectrum i.e. at 5GHz (with diameter d=4%) ……….57 Figure 48: The Sum and Difference patterns in correspondence of the 25th harmonic
of the UWB spectrum i.e. at 5GHz (with diameter d=8%) ……….58 Figure 49: The Sum and Difference patterns in correspondence of the 25th harmonic
of the UWB spectrum i.e. at 5GHz (with diameter d=16%) ………...59 Figure 50: The Sum and Difference patterns in correspondence of the 25th harmonic
10
Abstract
In the communication world, the demand for latest technologies growth is increasing day-by-day, especially for antenna arrays. Ultra-wideband Technology is a trusted key for future generation radio frequency identification systems to conquer them as high as the limitations of the ongoing narrow bandwidth radio frequency identification technology like decreasing the space coverage, insufficient ranging resolution for accurate localization, sensitivity to interference, and multiple access capabilities.
The idea in practice is to apply the Time Modulation technique which means the presence of switches at the antenna ports, which is a new procedure, but typically adopted for narrowband antennas arrays. So, for the arrays working at a single frequency.
Here we are trying to see if it is possible to apply this excitation technique also to ultra-wideband antennas. So, in this case, instead of having two monopoles for instance as well as our application, we have used two Ultra-wideband antennas working in the lower European UWB band [3.1 – 4.8]GHz.
For single narrow band antennas, we see what it happens only at single band frequency. In this case, having UWB antennas, we must split our 2GHz band from 3 to 5GHz into windows of 500MHz.
This dissertation mainly focuses on the two important characteristics. They are: localization and power transmission both realized by the time modulated antenna array and evaluates their application in the communication system. The first step of experiment localization is carried out on a computer by using the software tool called Computer Simulation Technology (CST) in the range from 3GHz to 5GHz and then merging the results with a MATLAB programming to extract the far-field results and by using Nonlin software which was developed by the researchers of DEI: with this procedure we are able to evaluate the simulation results of far-field by taking into account all the possible phenomena, both linear and non-linear, taking place in the radiating system under test.
Index terms -- Linear antenna arrays, time modulated array, Ultra-wideband reader, wireless power transfer, localization, radio frequency identification, Electromagnetic analysis, Digital Communication.
11
Chapter 1: INTRODUCTION
In the modern society, there is a lot of applications based on networked low-cost nodes (tags) that are shared or distributed in the space: logistic, wireless sensor networks, and industrial automation. The development of information technologies is in an exorable way leading us towards the introduction of systems more and more distributed in the environment.
Wireless services are more demanding and one of the fast growing sectors telecommunication history as they provide mobility, capacity, and robustness. Moreover, antennas and most of all a proper combination of antennas play a vital role in wireless systems communication and signal processing helps to achieve the desired goal by receiving desired signals and filtering unwanted ones.
One of the important features of the sensor network is sustainability. The investigation of latest technologies is aimed to reduce power consumption and to design small antennas with low loss and beam steering features. Antenna devices of sensor networks must be capable of sensing, the electromagnetic field in the environment, thus adopting the radiation characteristics of the generated field to improve the quality of service of the communication link and to reduce the power consumption and smart antenna technology has to consider the hardware complexity, making the solution feasible in the context of sensors.
Indoor location sensing system has become more popular in recent years. The primary progress in indoor location sensing system has been made during the last ten years. Therefore, both the research and commercial and industries are currently involved in the research and development of the systems.
Wireless technology has extended its applications to medical, industrial, public safety and transport system due to their accessibility. For this reason, wireless power transfer (WPT) is foreseen as one of the key enabling technologies for an energy-aware world, for the effective implementation of the so popular paradigm of the Internet of Things. With these smart strategies, providing RF energy to a large number of wireless nodes has become leading of importance.
Wireless power transmission (WPT) is attracting a wide range of courses in different types of fields and also becoming a major active research area because of its potential in providing massive technology. The wireless power transmission will be mandatory to use in the future because this technology enables the transmission of electrical energy from a power source to an electrical load across an air gap without interconnecting wires.
Radio-frequency identification (RFID) is a technology working at a radio frequency for the real-time object identification. This technique is facing a rapid adoption in several fields. An RFID system consists of readers and tags applied to objects. So, this technology is used to automatically identify the object and/or tracking them. So in this RFID technology, the RFID tag is used attached to the objects which we want to track. So, the RFID reader is continuously sending radio waves: whenever the tagged object is in the range of the reader then this RFID tag is used to transmit its feedback signal to the reader. By using the RFID technology we can track even multiple objects at the same time.
12
RFID communication takes place between one or more readers and one or more tags. The reader is typically the bigger, more expensive and intelligent part of the RFID link, while the tag is usually of smaller dimensions, cheaper and with less computational power on board. They communicate with each other and they exchange information. By using the signals received from the tags, readers are able to identify tags position, with different techniques (e.g.TDOA, AOA, etc).
In UWB localization applications the antennas are designed to "work properly" on a very wide bandwidth, typically of 500 MHz or more. Where "work properly" means they have good and constant radiation characteristics (i.e. gain, radiation efficiency, rad. patterns, etc.).
UWB localization is just a method that uses UWB techniques for localization purpose. UWB techniques consist in communicating via signals that have an extremely short duration (often referred to as "pulses"), and this means that in frequency domain they occupy a very large bandwidth ("UWB" stands for Ultrawide Bandwidth).
UWB techniques are used because they have many advantages with respect to narrowband communication: they use extremely low power signals in terms of spectral density and they are very robust versus fading, which is typically present in indoor environments. When the communication between readers and tags takes place with UWB techniques, instead of narrowband signals, you can say you are working with UWB localization techniques.
1.1 UWB
UWB is a communication method which can be used in the wireless networking that can use a low power consumption and attain high bandwidth connections. To transmit the huge data over a short distance without using a large amount of power. UWB technology is, therefore, utilizing that can utilize a very low energy level for short-range, high-bandwidth communications by exploiting a consistent portion of the radio spectrum.
While conventional wireless signals occupy bandwidth between several hundred kilohertz and tens of megahertz UWB (ultra-wideband) technology sends and receives data at bandwidths over 500MHz at very low power spectral densities. Because of the low power density level of UWB signals and their high frequencies, they can only travel up to a limited distance and do not interfere much with other waves. When determining locations using wireless signals the length of signal pulse affect accuracy IR UWB (Impulse Radio Ultra-wideband) uses very short pulses of nanoseconds which allow measuring distances with a high degree of accuracy. The bandwidth of an antenna is the antenna operating frequency band within which the antenna performances, such as input impedance, radiation pattern, gain, efficiency, and etc., are the desired ones. The most commonly used definitions for the antenna bandwidth are the fractional bandwidth (for narrow or wideband definition) and the bandwidth ratio (for ultra-wideband definition).
The fractional Bandwidth is defined as
13
The Bandwidth ratio is defined as
BW=f
h/f
l:1
• fl is the lower frequency of the operation band. • fh is the lower frequency of the operation band. • fc is the lower frequency of the operation band.The advantages of UWB can finally be summarized in this way:
• Coexistence with current narrowband and wideband radio services. • It has large channel capacity.
• The ability to work low signal-noise ratios. • Low transmit power.
• High performance in multipath channels.
1.2 TMA
Generally, arrays of the antennas are excited using narrowband signals, but time modulation is an excitation technique used to control radiation power spectrum by enabling or disabling individual array elements and by exiting them with variable periodic pulses by means of switches: The frequency with which they are driving is often called modulation frequency(FM) and is several orders of magnitude lower than the RF carrier to be transmitted(f0). These arrays are called Time Modulation Arrays (TMAs). This technique takes full advantage of a new degree of freedom at the time. In this way, beam steering becomes easy and cheap.
Recent works have achieved a great control over the sidelobes of the main power pattern at the radiated RF carrier signal f0. But one of the major characteristics of TMA is the fact that, due to their time-dependent array factor, they are able to radiate at the harmonics of the RF carrier (f0±fM): the so-called sideband radiation. Many types of research have focused on the reduction of the sideband radiation through the strategic control of the on/off pulses that modulate the excitations of the antenna elements. More recently, some applications have demonstrated to be possible through the useful exploitation of the sideband radiation: localization and WPT are among these applications.
14
Figure. 1. Schematic representation of a linear-element TMA with detailed diodes switch bias networks, including dc-block capacitors [1]
1.3 RFID
As already said, an RFID system contains two components; RFID reader and the RFID tag. This RFID tag could be an active tag, or it could be a passive tag, or it could be a semi-passive tag. Now, these passive tags do not have their own power supply. So, each passive tag relies on the radio waves which is coming from the RFID reader as its source of energy. While in case of a semi-passive tag, they used to have their own power supply. But for transmitting the feedback signal back to the RFID reader they used to rely on the signal which is coming from the RFID reader. While in case of an active tag, they use to have their own power supply. But for transmitting the signal back to the reader also they are relying on their own power supply. So, as this passive tag does not have their own power supply, so the range is less compared to the active and semi-passive tags.
Now, this RFID reader consists of three components. So, the first component of RFID reader is RF signal generator. So, this signal generator generates the radio waves which are transmitted using this antenna and also to receive the feedback signal which is coming from the tag, the RFID reader also has a receiver of signal detector and to process the information which is being sent by the RFID tag, this RFID reader also has micro-controller. Now let us see about RFID tags, which are being used today are passive tags. Because these passive tags are quite cheaper compared to the active tags as well as they do not require any power source, so they are quite compact and eco-friendly.
15
Chapter 2: UWB localization with TMA
The new idea of this thesis work is to implement UWB localization application in an indoor environment where there are several sensors, equipped with rectifying antenna and are randomly placed, by resorting to a UWB reader adopting the Time Modulation Technique. The localization system is a set of measurements used to find the unknown positions of target nodes. UWB technology offers the potential of achieving high ranging accuracy through Time on arrival (TOA) measurements even in harsh environment. UWB devices have low complexity, size, and cost.
The TMA has been fully deployed in wireless power transmission (WPT) two-step procedure but using narrowband antennas. In the first step, only two antenna elements of TMA are periodically driven by using switches to localize the Ntag tags. In the second step, the nA- element array is used to precisely energize the previously detected tags. So, in both cases, we are taking into the account the advantage from TMA capabilities to perform a various type of radiations at fundamental f0 and the first sideband harmonics f0±fM. The new idea of this thesis job is to reproduce for the first time, the first step with UWB antennas, thus creating the first TMA-UWB reader to be adopted for indoor localization.
Localization Step:
The UWB technology has the advantage of extremely low power consumption, robustness against fast fading, enabling sub-meter precision indoor localization. For localization process in RFID system, we have deployed tags and readers in an indoor environment with a known position. The UWB RFID tag is normally attached to an object that needs to be localized. An indoor positioning system is a system that continuously and in real time determine the position of an object in an indoor environment and has various applications. In comparison with the outdoor environment, the indoor environments are more complex than the outdoor environment because there are several objects such as pieces of equipment walls, and people that may reflect signals and lead to multi-path and delay problems.
The use of UWB is suggested in indoor scenarios because it is very robust (with respect to fading). UWB transmitter can be very simple and is characterized by an extremely low duty cycle transmitted signal. Such a transmitter has a low complexity and low consumption depending on the pulse repetition.
One of the applications of UWB technology in RFID field is location tracking in indoor environments. In these, applications the tag position is not estimated based on the distance between tag and readers but instead, localization schemes based on time difference of arrival (TDOA) and angle of arrival (AOA) of the incoming of signals are adopted. These localization strategies make use of more UWB readers, placed in known positions, that need to perform onboard calculations.
16
The UWB tag broadcasts through backscattering the received signals in periodic burst and is received by the readers placed at known positions. Readers are synchronized through a wired connection and share their respective TOA independently and TDOA is computed with respect to common reference clock provided.
The measurement of time is in the order 1ns or less so, in order to calculate the position at least three readers with known positions and two TDOA measurements are required. Each of these two measurements is geometrically interpreted to hyperbola of the constant time difference between two readers. Whereas, in cases where the angle of arrival (AOA) is deployed, the angle of arrival of the incoming radio signal is measured and can be estimated by multiple antennas which are separated by know distance [antenna array]. In this case, synchronization is not necessary.
The idea proposes in this thesis, try to avoid the use of a high number of UWB readers and to resort to heavy calculations, by means of the new UWB-TMA reader based on a UWB application of the monopulse radar principle.
17
Chapter 3: New UWB TMA two-spiral array reader
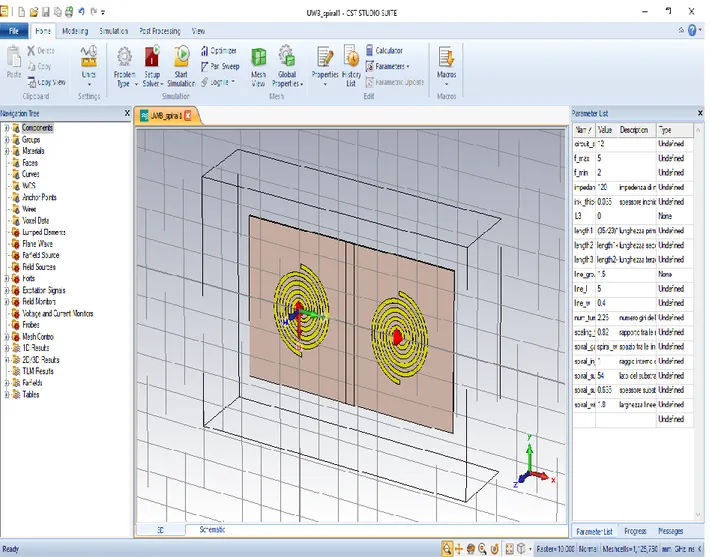
The system is shown in Figure 2 and it consists of two Archimedean spiral antennas separated by a distance of λ/2@4GHz.
Figure 2: Layout of two UWB Archimedean spiral antennas
Time modulation is typically adopted as excitation for narrowband antenna arrays through the switches present at each antenna port. In this thesis, we are trying to see if it is possible to apply the excitation technique adopted for narrowband antenna arrays to Ultra-wideband antenna arrays, too. So, for this case instead of having two narrowband monopoles we consider two UWB Archimedean spiral antennas.
In this case, we have to split our 2GHz band from 3 to 5GHz into windows of 500MHz and we have to look what happens in each window in order to verify if the Sum (∑) and Difference (∆) patterns behave in the proper way in the whole bandwidth, in such a way to suitably exploiting the monopulse radar principle all over the UWB band.
18
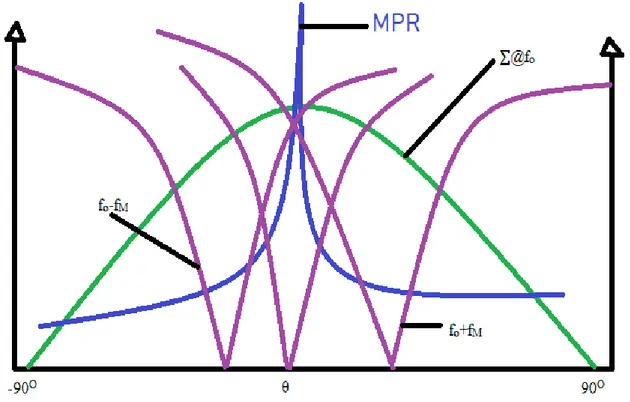
The UWB system works at frequency f0 in the band of 3GHz to 5GHz and the modulation frequency fM = 1MHz i.e. it is the frequency with which we periodically open and closes the switches. In previous works, single frequency TMA of two monopoles was adopted for the localization of tagged objects: the idea was to use the radiation patterns of the sum (∑) at f0 and the difference (∆) at f0±fM by exciting the monopole with the symmetric red pulses of Figure:3. If we then combine the sum and difference, it is possible to create the figure of merit Maximum Power Ratio (MPR).
MPR = ∑[dB
m] - ∆[dB
m]
Which is extremely useful for localization purposes, has already demonstrated with narrowband arrays.
Figure 3: The two 0.5TM points must be aligned in the figure of a two-element array for
19
Figure 4: Fixed ∑ and steerable ∆ pattern of an ideal array of two elements.
In practice, the Sum (∑) and Difference (∆) in the formula are the signals backscattered from the tag, and received at the sum, and at the different ports of the reader. So, this thin peak is shown in Figure:4 is very useful for localization it allows to accurately detect the direction from which the signal comes from.
Additionally, if we change the duty cycle of the two sequences driving the switches by acting on the parameter d of figure:3. we can change the position of the negative peak (hence the positive peak of the MPR, too, as in Figure:4) and, thanks to the TMA sideband radiation phenomenon, one peak is at the positive sideband f0+fM and the other one is at negative band side f0-fM. So, the purpose of my thesis work is to verify if we can reproduce this behavior with Ultra-wideband(UWB) antennas to have an accurate TMA-based UWB reader able to localize in indoor scenarios because it is robust with respect to the fading thanks to the large adopted spectrum.
So, we start verifying by the electromagnetic simulation of these two antennas and by the extraction of the field radiated by each antenna in the presence of the other, so in this way, we take into account the electromagnetic coupling. We introduce the information of the far-field radiated by each antenna in the NONLIN software which is a non-linear RF circuit simulator based on the Harmonic Balance method, that has been developed by the Unibo team of RFCAL laboratory. We start the simulation with a sinusoidal RF signal (f0) entering the antenna array. So, we made some trails with the RF tone ranging from 3GHz to 5GHz because here we want to verify the quality of radiation pattern of the Sum (∑) and Difference (∆) for the UWB array, what is important to underline in this case is; the distance between the antennas: - it is typically /2 for resonant antennas. Here we have antennas with huge bandwidth, so, we made a trade-off by choosing this distance equal to divided by 2 at the central frequency of the band (i.e. 4GHz).
20
In these conditions, we are extracting far field of the sum (∑) and difference (∆) for these frequencies of the UWB band and we also make the tuning of the rectangular pulses in order to change the position of the difference pattern for localization purposes.
Figure 5: UWB wave form of pulse
21
The last step is to replace the sinusoidal excitation with the UWB pulse, in order to test the system in realistic operating conditions. So, we made the long number of trails to select the proper shape of the exciting UWB pulse: the chosen shape was the that one shown in Figure:5, i.e. two pulses with opposite polarity (representing a logical “0”) with duration of 300ps, a period of 5ns and the separation of 800ps. The corresponding spectrum is shown in Figure:6: most of the spectral lines in the desired region, i.e. in between 3GHz and 5GHz. We make the simulation with fUWB is 250MHz (=1/5ns) representing the spacing between the adopted NH =32 harmonics (=> 32*200MHz = 6.4 GHz is the frequency band under exam) use to describe UWB signal and fM is 1MHz, under these excitation conditions we realize the extraction of the radiated field: in order to intercept the desired far-field, we have first to identify the proper harmonic in the spectrum: if we indicate with k*fUWB (with k=0, 1, 2, ….. 32) the generic frequency of spectrum, when k is 15 => kfUWB = 3GHz, k is 20 => kfUWB = 4GHz and k is 25 => kfUWB = 5GHz. So, the result which we obtain at the end is extremely rigorous because we make a non-linear/ electromagnetic simulation of the real system under the real excitation conditions, thus evaluating the real signal that this reader would send into space in the future.
22
Chapter 4: Design of a UWB Spiral Antenna
The idea is taken from planar two elements TMAs with λ/2 – spaced monopoles.
Figure 7: Planar two elements of TMAs with spaced monopoles. [1]
We have various types of wideband antenna available, in this case, we are going to design the Ultra-wideband antenna which looks like a spiral. In choosing antenna topology for UWB design, various kinds of factors are considered including physical profile, impedance bandwidth, radiation pattern, and radiation efficiency. In this thesis, two Archimedean spiral antennas are designed and simulated. A spiral is a well known wideband antenna and it has been used for many wideband RF systems. Two arms Archimedean spiral antenna has been chosen for investigation of Time Modulated linear array antenna techniques for an Ultra-wideband reader.
23
The Archimedean spiral antenna providing the minimum size has been chosen by comparison of the electromagnetic simulations of an Archimedean and logarithmic spiral antenna, both printed on a 1.5mm thick RF-4 substrate that is
ε
r= 4.3, tan(δ) =
0.025 at 10GHz: theArchimedean spiral resulted in less space-consuming (only 5.5*5.5 cm2 substrate footprint). Electromagnetic simulation results exhibit good radiating characteristics in the Ultra-wideband band, the antenna impedance has the almost has a constant value of 120 ohms while the radiating efficiency and realized gain are approximately equal to the 95 percent and 3.5dBi respectively.
The parametric study of two arm Archimedean spiral antenna is done by using the commercially available Computer Simulations Technology (CST), Microwave tool in the frequency range of 2.5GHz to 5GHz.
CAD APPROACH
We used CST MICROWAVE STUDIO (CST MWS) for our antenna design which is the leading-edge tool for the fast and accurate 3D simulation of high-frequency devices and market leader in Time domain simulation. It enables the fast and accurate analysis of antennas, filters, couplers, planar and multi-layer.
24
25
The adopted CAD approach is based on the Harmonic Balance method which is a widely used method for analysis or design of nonlinear RF circuit: according to its principles, the entire circuit, including the two Ultra-wideband (UWB) antennas and the switches, can be divided into two sub-networks. one is linear, it contains the linear lumped elements and the antennas, and it can be described in the frequency domain; the other one is non-linear, it contains switches and it can be accurately described in the time domain. The two sub-networks are connected by a number
n
B of common or device ports, where the Kirchhoff’s current laws are applicable in the frequency domain, in order to build the non-linear solving system.In figure 8 above we are seeing the dual mode UWB-UHF antenna from which my job started: it also has two UHF dipoles directly obtained from the two spiral arms. For the purpose of my thesis, these dipoles are useless because the energy harvesting capability at the UHF band, for which they were created, is not among the purposes of my job: - therefore I have to first eliminate the dipoles.
Figure 9: Two arm Archimedean spiral antenna
After removing the two ends of the dipoles, we need one identical antenna because the goal is to reproduce the localization step previously described by means of an array of two UWB spiral antennas. The distance between the two UWB antennas has been fixed at L=λ/2@4GHz: of
course, this is the standard distance at 4GHz only, because of the big frequency band here considered; as a consequence, the two antennas will be “closer” at the lower frequency (3GHz) and “more distant” at the higher frequency(5GHz). We have two ports for this two spiral antennas ie., P1 and P2. After finish to design dual antennas we have to start the simulation.
26
Figure 10: Two Archimedean spiral antennas with the distance /2@4GHz in CST studio.
After the end of the simulation, to plot the cartesian radiation pattern in the xz-plane (here keep phi const = 00), we have to select the post-processing in the CST CAD tool at the top and export the ASCII files for each frequency of the spectrum ie.
Ē = E
θ*i
θ+ E
ϕ*iϕ
In order to look at the Sum and Difference patterns, it is possible to properly combine the results of the two simulations with the excitation applied at port-1 and port-2, respectively. For Sum (∑) => p1[1,00]+p2[1,00]
For Difference (∆) => p1[1,00]+p2[1,1800]
The graph of the Far-field results is shown both in Cartesian and polar plots at all considered frequency of the UWB band.
27
28
29
30
31
32
33
34
35
36
37
38
39
40
41
42
43
44
45
46
47
Chapter 5:
MATLAB SCRIPTNow Run the MATLAB script for a two-port array for each frequency and create the files .txt: far-field_2500MHz.txt, far-field_3000MHz.txt, far-field_3500MHz.txt, far-field_4000MHz.txt, far-field_4500MHz.txt, far-field_5000MHz.txt.
Sample Programme fid=fopen('UWB_2500.txt','w'); f1=fopen('farfield_2.5p1.txt','r'); f2=fopen('farfield_2.5p2.txt','r'); indice=0; while fopen(f1) tline1 = fgets(f1); tline2 = fgets(f2);
if indice>180 && indice < 543
fprintf(fid,'%s\n','2500000000'); fprintf(fid,'%s\n',tline1(96:126)); fprintf(fid,'%s\n',tline2(96:126)); fprintf(fid,'%s\n',tline1(56:86)); fprintf(fid,'%s\n',tline2(56:86)); end indice=indice+1; end fclose(fid);
48
Chapter 6: SIMULATION RESULTS
The experiment is then carried out with the Nonlin software.
Here we are going to verify the localization capabilities of the UWB array in the following two cases.
▪ Case A: Periodical or Sinusoidal input RF signals (in the 3-5 GHz range).
▪ Case B: UWB Pulse excitation (occupying the 3-5 GHz portion of the spectrum). The simulation of our two-nonlinear radiating system finally allows the extraction of the actual field radiated by that the system; in this way, we are considering the electromagnetic couplings and the actual dynamic of the nonlinear switches.
6.1 Periodical or Sinusoidal input RF signals (in the 3-5 GHz range):
First of all, we have to examine the UWB behavior under sinusoidal excitation entering the antenna array. Here we make the simulation trails with five different types of frequencies: 3Ghz, 3.5Ghz, 4GHz, 4.5GHz, and 5GHz. Because we must verify the conditions of the radiation pattern of the Sum (∑) and Difference (∆). It is the first time we make this to UWB antennas.
As previously said, the distance between the two antennas with high bandwidth is divided by 2 @ 4GHz.
49
Figure 32: Simulation of the sinusoidal pattern for 2UWB_3.5GHz.
50
Figure 34: Simulation of the sinusoidal pattern for 2UWB_4.5GHz.
Figure 35: Simulation of the sinusoidal pattern for 2UWB_5GHz.
The previous curves show the excellent behavior of the Sum and Difference radiation patterns in the entire frequency band, including the negative peaks tuning by acting on the duty cycle of the driving sequences shapes, as explained before.
51
6.2 UWB Pulse excitation (occupying the 3-5 GHz portion of the spectrum):
In this case, we are going to replace the sinusoidal excitation with the UWB pulse. The corresponding results are reported in Figures 36 to 50.
We need to insert the 32 harmonics representing the pulse as excitations. After running this heavy simulation (because it is also takes into account the simultaneous modulation of the switches with fM = 1MHz) we are able to extract again the Sum and Difference patterns in correspondence of the 15th, 20th, and 25th harmonics of the UWB spectrum i.e. at 3, 4 and 5GHz.
Figure 36:The Sum and Difference patterns in correspondence of the 15th harmonic of the UWB spectrum i.e. 3GHz (with parameter d=0%)
52
Figure 37:The Sum and Difference patterns in correspondence of the 15th harmonic of the UWB spectrum i.e. at 3GHz (with parameter d=4%)
Figure 38:The Sum and Difference patterns in correspondence of the 15th harmonic of the UWB spectrum i.e. at 3GHz (with parameter d=8%)
53
Figure 39:The Sum and Difference patterns in correspondence of the 15th harmonic of the
UWB spectrum i.e. at 3GHz (with parameter d=16%)
Figure 40:The Sum and Difference patterns in correspondence of the 15th harmonic of the UWB spectrum i.e. at 3GHz (with parameter d=32%)
54
Figure 41: The Sum and Difference patterns in correspondence of the 20th harmonic of the UWB spectrum i.e. at 4GHz (with parameter d=0%)
Figure 42: The Sum and Difference patterns in correspondence of the 20th harmonic of the
55
Figure 43: The Sum and Difference patterns in correspondence of the 20th harmonic of the UWB spectrum i.e. at 4GHz (with parameter d=8%)
Figure 44: The Sum and Difference patterns in correspondence of the 20th harmonic of the UWB spectrum i.e. at 4GHz (with parameter d=16%)
56
Figure 45: The Sum and Difference patterns in correspondence of the 20th harmonic of the
UWB spectrum i.e. at 4GHz (with parameter d=32%)
Figure 46: The Sum and Difference patterns in correspondence of the 25th harmonic of the UWB spectrum i.e. at 5GHz (with parameter d=0%)
57
Figure 47: The Sum and Difference patterns in correspondence of the 25th harmonic of the UWB spectrum i.e. at 5GHz (with parameter d=4%)
Figure 48: The Sum and Difference patterns in correspondence of the 25th harmonic of the
58
Figure 49: The Sum and Difference patterns in correspondence of the 25th harmonic of the
UWB spectrum i.e. at 5GHz (with parameter d=16%)
Figure 50:The Sum and Difference patterns in correspondence of the 25th harmonic of the
59
The results are plotted in Figure:36 to Figure:50, show an excellent behaviour in terms of Sum and Difference radiation patter in all the frequency bands. This leads to conclude that the UWB array behaves well in the entire UWB band even under UWB excitation conditions.
The result we obtain at the end are extremely rigorous because we made a Non-linear electromagnetic simulation of the real system with real signals.
60
CONCLUSION
The distinct features of UWB Technology provides efficient solutions for RFID
Systems. The various fields take the advantage of real time object detection and
localization applications. The recent invention for UWB RFID is for commercial
purposes. The basic idea in this work is Time Modulation technique operated on
switches at the antenna ports. The proposed antenna system introduces a compact
and low-profile antenna.
In This thesis, I have studied two basic characteristics.
They are: localization and
power transmission both realized by the time modulated antenna array. But my
attention has been devoted mostly to “Localization”; for the first time,
localization has been carried out with an UWB two-spiral array driven according
to the time-modulation techniques. Study of Time Modulated Antenna array is
carried out by means of a nonlinear/electromagnetic co-simulation, based on the
combined use of the software tool called computer simulation technology (CST)
in the ranges at 3GHz to 5GHz for the electromagnetic analysis, and proprietary
software developed at the University of Bologna for the final circuit analysis of
the nonlinear radiating system.
With these tools we verified the localization capabilities of the UWB array in the
following two cases: A) periodic or sinusoidal input RF signals in the 3-5GHz
range and B) UWB pulse excitation, occupying the 3-5GHz portion of the
spectrum.
The results we obtain at the end are extremely rigorous because we made a
Nonlinear electromagnetic simulation of the real system under the real excitation
conditions, thus evaluating the real signal that this reader would send into the
space in the future. The promising behaviour of the UWB-TMA reader makes it
a future candidate for localization in harsh indoor environments.
61
REFERENCES
1.
Masotti, D., Costanzo, A., Del Prete, M., & Rizzoli, V. (2016). Time
modulation of linear arrays for real-time reconfigurable wireless power
transmission. IEEE Transactions on Microwave Theory and Techniques.
Vol.64, no.2, pp.331-332, Feb.2016.
2.
![Figure 3: The two 0.5T M points must be aligned in the figure of a two-element array for localization [1]](https://thumb-eu.123doks.com/thumbv2/123dokorg/7422884.99067/18.892.121.751.465.856/figure-t-points-aligned-figure-element-array-localization.webp)
![Figure 14: Cartesian and polar plots for Farfield at frequency_3000MHz [2]](https://thumb-eu.123doks.com/thumbv2/123dokorg/7422884.99067/30.892.108.809.177.571/figure-cartesian-polar-plots-farfield-frequency-mhz.webp)
![Figure 16: Cartesian and polar plots for Farfield at frequency_3500MHz {1[1,0]+2[1,0]}](https://thumb-eu.123doks.com/thumbv2/123dokorg/7422884.99067/32.892.109.811.107.502/figure-cartesian-polar-plots-farfield-frequency-mhz.webp)
![Figure 17: Cartesian and polar plots for Farfield at frequency_3500MHz {1[1,0]+2[1,180]}](https://thumb-eu.123doks.com/thumbv2/123dokorg/7422884.99067/33.892.109.810.108.512/figure-cartesian-polar-plots-farfield-frequency-mhz.webp)
![Figure 18: Cartesian and polar plots for Farfield at frequency_3500MHz [2]](https://thumb-eu.123doks.com/thumbv2/123dokorg/7422884.99067/34.892.109.808.140.545/figure-cartesian-polar-plots-farfield-frequency-mhz.webp)
![Figure 21: Cartesian and polar plots for Farfield at frequency_4000MHz {1[1,0] +2[1,180]}](https://thumb-eu.123doks.com/thumbv2/123dokorg/7422884.99067/37.892.110.811.141.546/figure-cartesian-polar-plots-farfield-frequency-mhz.webp)
![Figure 23: Cartesian and polar plots for Fairfield at frequency_4500MHz [1]](https://thumb-eu.123doks.com/thumbv2/123dokorg/7422884.99067/39.892.107.811.177.579/figure-cartesian-polar-plots-fairfield-frequency-mhz.webp)
![Figure 24: Cartesian and polar plots for Farfield at frequency_4500MHz {1[1,0]+2[1,0]}](https://thumb-eu.123doks.com/thumbv2/123dokorg/7422884.99067/40.892.110.811.141.540/figure-cartesian-polar-plots-farfield-frequency-mhz.webp)
