R E S E A R C H
Open Access
Expiratory flow limitation in intensive care:
prevalence and risk factors
Carlo Alberto Volta
1, Francesca Dalla Corte
1, Riccardo Ragazzi
1, Elisabetta Marangoni
1, Alberto Fogagnolo
1,
Gaetano Scaramuzzo
1, Domenico Luca Grieco
2, Valentina Alvisi
1, Chiara Rizzuto
1,3and Savino Spadaro
1*Abstract
Background: Expiratory flow limitation (EFL) is characterised by a markedly reduced expiratory flow insensitive to the expiratory driving pressure. The presence of EFL can influence the respiratory and cardiovascular function and damage the small airways; its occurrence has been demonstrated in different diseases, such as COPD, asthma, obesity, cardiac failure, ARDS, and cystic fibrosis. Our aim was to evaluate the prevalence of EFL in patients requiring mechanical ventilation for acute respiratory failure and to determine the main clinical characteristics, the risk factors and clinical outcome associated with the presence of EFL.
Methods: Patients admitted to the intensive care unit (ICU) with an expected length of mechanical ventilation of 72 h were enrolled in this prospective, observational study. Patients were evaluated, within 24 h from ICU admission and for at least 72 h, in terms of respiratory mechanics, presence of EFL through the PEEP test, daily fluid balance and followed for outcome measurements.
Results: Among the 121 patients enrolled, 37 (31%) exhibited EFL upon admission. Flow-limited patients had higher BMI, history of pulmonary or heart disease, worse respiratory dyspnoea score, higher intrinsic positive end-expiratory pressure, flow and additional resistance. Over the course of the initial 72 h of mechanical ventilation, additional 21 patients (17%) developed EFL. New onset EFL was associated with a more positive cumulative fluid balance at day 3 (103.3 ml/kg) compared to that of patients without EFL (65.8 ml/kg). Flow-limited patients had longer duration of mechanical ventilation, longer ICU length of stay and higher in-ICU mortality.
Conclusions: EFL is common among ICU patients and correlates with adverse outcomes. The major determinant for developing EFL in patients during the first 3 days of their ICU stay is a positive fluid balance. Further studies are needed to assess if a restrictive fluid therapy might be associated with a lower incidence of EFL.
Keywords: Respiratory insufficiency, Fluid therapy, Lung disease, Respiratory mechanics, Maximal expiratory flow rates, Critical care
Background
Expiratory flow limitation (EFL) is a dynamic condition in which expiratory flow has already reached its maximal value [1]. According to Mead et al. [2], once the expira-tory flow is limited at a given lung volume, there is a site in the intrathoracic airways where intrabronchial and extrabronchial pressure are equal, the so-called equal pressure point (EPP) [3]. Airways downstream of the EPP would be compressed, the diameter markedly
reduced, with the expiratory flow becoming insensitive to increases of expiratory driving pressure or to the con-traction of the expiratory muscles [1,4–7].
Clinically, EFL was demonstrated in patients with chronic obstructive pulmonary disease (COPD) [4, 8], acute respiratory distress syndrome (ARDS) [9, 10], acute and chronic heart failure [11, 12], cystic fibrosis [13], spinal cord injury [14] and obesity [15]. Recently, EFL has been described in patients undergoing general anaesthesia for major abdominal surgery, and its pres-ence was the best predictors of postoperative pulmonary complications [16].
© The Author(s). 2019 Open Access This article is distributed under the terms of the Creative Commons Attribution 4.0 International License (http://creativecommons.org/licenses/by/4.0/), which permits unrestricted use, distribution, and reproduction in any medium, provided you give appropriate credit to the original author(s) and the source, provide a link to the Creative Commons license, and indicate if changes were made. The Creative Commons Public Domain Dedication waiver (http://creativecommons.org/publicdomain/zero/1.0/) applies to the data made available in this article, unless otherwise stated. * Correspondence:[email protected]
1Department of Morphology, Surgery and Experimental Medicine, Azienda
Ospedaliera-Universitaria Arcispedale Sant’Anna, University of Ferrara, Via Aldo Moro, 8, 44124 Ferrara, Italy
The mechanisms leading to EFL can vary among different pathologies. COPD patients may develop EFL because of increased expiratory resistance [17] that tend to reduce the transmural pressure (i.e. the difference between the pressure inside and outside the airways), leading to the development of the EPP. Incomplete lung emptying is frequently associated with dynamic lung hyperinflation with the generation of intrinsic positive end-expiratory pressure (PEEPi) [18]. The latter can have several adverse effects on haemodynamic (i.e. cardiac output depression, increased pulmonary vessel resistance), respiratory muscle function (i.e. altered length-tension characteristics of the diaphragm, in-creased work of breathing) and patient-ventilator inter-action (i.e. patient-ventilator asynchrony). On the other hand, patients with ARDS [19] or those undergoing gen-eral anaesthesia [20] can experience a reduction of func-tional residual capacity (FRC) able both to increase the expiratory resistance and to favour the collapse of the small airways. The ensuing inspiration re-open those air-ways, and repetitive opening and closure of small airways has been shown to induce histological damage of small air-ways probably due to the development of high shear forces [21, 22]. This should elicit an inflammatory response and increase the risk of low lung volume injury [23,24].
Although EFL seems to represent a relevant patho-logical condition, surprisingly, only few studies evaluated the prevalence of EFL in critically ill patients. Alvisi et al. [8] demonstrated that almost every COPD patient (93%) is flow limited at intensive care unit (ICU) admis-sion for an acute and chronic respiratory failure, while Koutsoukou et al. [9] found that EFL might be common in patients with ARDS. However, both studies enrolled a small number of selected patients so that it is difficult to derive conclusions on the clinical relevance of EFL and its determinants.
The primary aim of the present study is to evaluate the prevalence of EFL in ICU patients requiring mechan-ical ventilation for acute respiratory failure, and to deter-mine the main clinical characteristics and risk factors associated with the presence of EFL. Secondly, we ex-plored the possible impact of the presence of EFL on pa-tients’ clinical outcome.
Methods
Design, setting and patients
We performed a prospective, observational study con-ducted in the general ICU of the S. Anna University Hospital, Ferrara, Italy. The study was approved by the ethics committee of our institution (Azienda Ospedaliero-Universitaria Ferrara Ethic Committee, protocol number: 74/2016). Informed consent was obtained from each patient or next of kin. Patients were recruited over a 12-month period between April 2016 and April 2017.
We screened and included all consecutive patients ad-mitted to the ICU older than 18 years with an acute re-spiratory failure and with an expected length of mechanical ventilation of 72 h or more, as judged by the physician in charge. Exclusion criteria were (1) preg-nancy, (2) haemodynamic instability (i.e. heart rate≥ 120 beats/min or cardiac arrhythmia; systolic blood pres-sure < 90 or vasopressor use, i.e. dopamine or dobuta-mine ≥ 5 μg/kg/min or noradrenaline ≥ 0.1 μg/kg/min), (3) presence of laparostomy and (4) active air leakage (i.e. pneumothorax or presence of thoracic drainage) (Additional file1).
The observational period started within 24 h from ad-mission to ICU and continued for at least 72 h. Patients were followed for outcome assessment until hospital discharge.
Determination of EFL and respiratory variables
All measurements were performed by three investigators (FDC, CR, EM) equally expert in respiratory mechanics and data collection. Patients were studied in a semi-recumbent position, with a head of bed angle of 30°.
The presence of EFL was determined by the PEEP test. The latter is based on a sudden decrease of PEEP from 3 to 0 cmH2O at the end of inspiration in order to
in-crease the expiratory driving pressure and establish whether or not the expiratory flow increases. If the ex-piratory flow increases after subtraction of PEEP, then the patient is classified as not flow limited. On the con-trary, if the expiratory flow does not increase after sub-traction of PEEP, the patient is classified as having EFL. This approach requires a specific manoeuvre to show two different flow-volume loops in the same display, and it is available on all modern ventilators. The flow-volume curve with 3 cmH2O of PEEP is used as a
refer-ence and fixed on the screen. The flow-volume curve of the ensuing breath in which PEEP is reduced to 0 cmH2O is superimposed to the previous one in order
to determine if the two flow-volume curves overlap (i.e. the expiratory flow does not increase), or the flow-volume curve at ZEEP exhibit an increase of the expira-tory flow (patient not flow limited) (Additional file 2). The accuracy and the reproducibility of the PEEP test have been compared to the Negative Expiratory Pressure (NEP) test and validated previously [20]. Further, the same PEEP test was used to determine the value of PEEP able to eliminate the presence of EFL, the so-called PEEP-EFL. The latter was calculated as the minimal value of PEEP that, according to the flow-volume curve, allows the expiratory flow to increase during tidal expiration (Fig.1). This was obtained by an incremental PEEP trial.
Respiratory mechanics were performed at zero-PEEP (ZEEP) by the standard airway occlusion technique using a 5-s expiratory occlusion followed by a 5-s
end-inspiratory occlusion [20]. The flow and additional re-sistance as well as the static compliance of the respira-tory system were computed using standard formulas [20]. During these tests, patients were deeply sedated using continuous intravenous infusion of propofol (1–2 mg/kg) and paralysed with a bolus of rocuronium brom-ide (0.6 mg/kg) and mechanically ventilated in volume-controlled mode. Patients with COPD were studied after at least 8 h from the administration of albuterol. As per our clinical practice, patients without COPD were not given bronchodilators.
The severity of chronic dyspnoea was rated according to the modified dyspnoea scale proposed by the Medical Research Council (mMRC) [25].
Data collection and outcome data
The presence of EFL was determined at the ICU admis-sion (within 12 h) and daily during the first 72 h. Data of respiratory mechanics were assessed at day 1 and at day 3 from ICU admission.
Demographics, anthropometrics, comorbidities, infor-mation and causes of hospitalisation were recorded into study-specific case report forms and database. COPD was defined according to recent ATS/ERS criteria [26], and COPD severity was assessed by the Global Initiative for COPD (GOLD) criteria [27]. Simplified Acute Physi-ology Score (SAPS) II and Sequential Organ Failure Assessment (SOFA) were determined during the first 24 h after ICU admission. The diagnosis of ARDS was based on the Berlin definition [28]. The occurrences of acute kidney injury (AKI) and septic shock were diagnosed according to international guidelines statements, Kidney Disease: Im-proving Global Outcomes (KDIGO) criteria [29] and sur-viving sepsis campaign (Sepsi-3) criteria [30], respectively.
Daily fluid balance was recorded as the algebraic sum of fluid intake and output per day, not including insens-ible losses, while cumulative fluid balance (CFB) was calculated as the algebraic sum of daily fluid balance during the observational period. We reported CFB as absolute number or divided by the admission weight of the patient (CFB/kg). Cumulative fluid overload (CFO) was calculated by dividing the CFB by the admission weight of each patient and was expressed as a percent-age, as previously proposed [31]. We considered a CFO≥
10% as severe fluid overload.
Fig. 1 Flow-volume curves of a representative patient aimed to determine the level of PEEP able to eliminate the presence of EFL (PEEP-EFL). a Until the subtraction of 4 cmH2O of PEEP the expiratory flow did not increased: the patient was considered flow limited at 4 cmH2O of PEEP. b Subtraction of 6 cmH2O of PEEP increased the expiratory flow. c Subtraction of 8 cmH2O increased the expiratory flow more than after the subtraction of 6 cmH2O of PEEP. The PEEP-EFL was 5 cmH2O. See text for further explanation
Outcome data such as days of mechanical ventilation, ICU and hospital length of stay and ICU and hospital mortality were retrieved from the hospital’s electronic patient chart.
Statistical analysis
Data are presented as frequencies and percentages and mean ± standard deviation or medians with 25th to 75th percentiles range [interquartile range], depending on the type of data and their distribution. The Shapiro-Wilk test was used to assess the assumption of normality. Categorical data were compared using the χ2 test or Fisher exact test as appropriate. Unpaired Student’s t tests or Mann-Whitney U tests for data with normal or non-normal distribution, respectively, were used to com-pare continuous variables.
Friedman test was used to test differences in CFB, CFB/kg and CFO within groups among three different time points (24 h, 48 h and 72 h from ICU admission). Kruskal-Wallis test and Mann-Whitney test were used to test differences in CFB, CFB/kg and CFO between groups at three different time points (24 h, 48 h and 72 h from ICU admission). Correlation between CFB/kg and intrinsic PEEP was assessed by linear regression.
The association between the presence of EFL at admis-sion and baseline patient characteristics was modelled using binary logistic regression analysis and reported as estimated odds ratio (OR) and relative 95% confidence interval (CI). Patients’ characteristics independently as-sociated with the presence of EFL at ICU admission were assessed in a multivariate logistic regression model. In the same fashion, a univariate logistic approach was used to assess the association between a CFO≥ 10%, the development of AKI in ICU, AHRF, ARDS or septic shock at admission and the incidence of EFL during the first 72 h of ICU stay.
Statistical analyses were performed using SPSS 20.0 statistical software (SPSS Inc., Chicago, IL). In all statis-tical analyses, a 2-tailed test was performed and the p value≤ .05 was considered statistically significant.
Results
A total of 121 patients were enrolled, and their main characteristics at admission are shown in Table 1. The most frequent causes for ICU admission were acute hypoxaemic respiratory failure (AHRF) (43%), sepsis (37%), ARDS (24%) and haemorrhagic shock (9%). Among the 121 patients included, 28 had a diagnosis of COPD and 6 of them were admitted for an acute exacer-bation of COPD.
Occurrence of EFL
Upon admission, 37/121 (31%) patients exhibited EFL, with a median PEEP-EFL of 8 cmH2O [6–10]. Among
the patients having EFL at admission, 19/37 (51%) had a diagnosis of COPD. Compared to those without EFL, flow-limited patients had a higher body mass index (BMI) (30.7 ± 6.8 vs 25.3 ± 3.9,p < 0.0001) and worse re-spiratory dyspnoea score [mMRC≥ 3 26/37 (70%) vs 9/ 84 (11%), p < 0.0001]. EFL was more frequently associ-ated with history of heart disease (28/37 (76%) vs 40/84 (48%),p = 0.004), COPD (19/37 (51%) vs 9/84 (11%), p < 0.0001) and chronic kidney disease (11/37 (30%) vs 10/ 84 (12%),p = 0.017). Furthermore, the main factors inde-pendently related to EFL at ICU admission were a BMI≥ 30 kg/m2(OR 3.6, 95% CI 1.0–12.6, p = 0.049), a mMRC score≥ 3 (OR 8.0, 95% CI 2.3–27.1, p = 0.001), a SOFA score≥ 6 (OR 3.6, 95% CI 1.1–12.0, p = 0.036) and a medical history of COPD (OR 4.7, 95% CI 1.5–14.4, p = 0.008) (Table2).
During the first 72 h of ICU stay, 21 additional pa-tients (17%) developed EFL. Specifically, 13 papa-tients (11%) became flow limited after 48 h and 8 (7%) after 72 h. Their clinical characteristics are reported in Add-itional file 2. Of note, they exhibited a BMI similar to the one of patients without EFL and the diagnosis of COPD (Additional file 3). Finally, patients becoming flow limited during the ICU stay exhibited values of PEEP-EFL statistically lower than those with EFL at ICU admission (Additional file4).
Data of respiratory mechanics
At the ICU admission, patients with EFL exhibited higher PEEPi (7 [4–10] vs 2 [1–2] cmH2O, p < 0.0001),
total airways resistance (22 [17–26] vs 16 [13–21] cmH2O/l/sp < 0.0001) and additional resistance (10 [6–
14] vs 7 [5–10] cmH2O/l/s, p = 0.001) (Table 3). These
differences remained constant during the ICU stay, be-ing detected also at 72 h after ICU admission (Table3). Of note, data of respiratory mechanics of patients devel-oping EFL during the ICU stay were not different from those obtained in the absence of EFL (Additional file5).
Cumulative fluid balance and EFL development
Patients who developed EFL during the first 72 h of ICU stay had a higher cumulative fluid balance and cumulative fluid overload compared to patients without EFL and with EFL at ICU admission. The trend of cumulative fluid ac-cumulation is shown in Fig.2and in Additional file6.
In patients developing EFL during the ICU stay, a higher cumulative fluid balance was associated with higher values of intrinsic PEEP on the day of EFL devel-opment (R2
= 0.304,p = 0.010) (Fig.3).
Moreover, a CFO≥ 10% over the first 2 and 3 days of ICU stay was associated with the development of EFL over the first 3 days of stay in ICU (OR 3.9, 95% CI 1.4– 10.9,p = 0.011 and OR 3.1 95% CI 1.1–8.5, p = 0.030, re-spectively) (Table4).
Outcomes
Overall, patients who had EFL at admission and developed EFL over the first 72 h of ICU stay were ventilated for a longer time (9 [5–15] vs 7 [3–14] days, p = 0.043) and had a longer ICU length of stay (14 [10–19] vs 10 [6–17] days, p = 0.034) and higher ICU mortality (17/58 (29%) vs 9/63 (14%),p = 0.044) compared to those without EFL.
Patients who developed EFL during the first 3 days of ICU stay were not ventilated for a longer time (8 [3–15] vs 7 [3–14] days, p = 0.448) and had no longer ICU length of stay (14 [8–18] vs 10 [6–17] days, p = 0.344) and higher ICU mortality (5/21 (24%) vs 9/63 (14%),p = 0.310) compared to patients who never developed EFL.
Discussion
The main results of the present study can be sum-marised as follows: (1) EFL is frequent among ICU
patients requiring mechanical ventilation for acute re-spiratory failure of different origin; (2) patients exhibit-ing EFL have worse parameters of respiratory mechanics and clinical outcome compared to those who did not; (3) the absence of EFL at ICU admission does not ex-clude its occurrence during ICU stay since part of the patients (17%) developed EFL after ICU admission; and (4) the development of EFL during the ICU stay was strongly associated with a positive fluid balance.
The presence of EFL was previously detected in 93% of the COPD patients at ICU admission [8], and their pathophysiological pulmonary characteristics explain why they are prone to develop EFL compared to other categories of patients. However, the presence of EFL has been previously demonstrated in other patients so that it could be hypothesised that an unknown amount of ICU patients other than COPD can exhibit EFL. This could
Table 1 Clinical and demographic characteristics of the patients at ICU admission
Variables Total (n = 121) NO EFL (n = 84) EFL (n = 37) p value
Age 68 ± 14 67 ± 15 71 ± 12 0.181 Male sex, n (%) 81 (67) 60 (71) 21 (57) 0.114 BMI, kg/m2 27.0 ± 5.6 25.3 ± 3.9 30.7 ± 6.8 < 0.0001 SOFA at admission 6 [4–9] 6 [4–8] 8 [6–10] 0.015 SAPSII 42 [31–48] 38 [29–47] 42 [35–53] 0.077 Smoking history, n (%) 0.343 Current smoker 29 (24) 17 (20) 12 (32) Former smoker 31 (26) 16 (25) 15 (26) mMRC≥ 3 35 (29) 9 (11) 26 (70) < 0.0001 NYHA≥ 2 62 (51) 27 (32) 35 (95) < 0.0001 Comorbidities, n (%) Heart diseases 68 (56) 40 (48) 28 (76) 0.004 Hypertension 42 (35) 28 (33) 14 (38) 0.632
Chronic cardiac ischaemia 43 (36) 22 (26) 21 (57) 0.001
COPD 28 (23) 9 (11) 19 (51) < 0.0001
OSAS 7 (6) 3 (4) 4 (11) 0.116
CKD 21 (17) 10 (12) 11 (30) 0.017
Reason for MV initiation, n (%)
AHRF 52 (43) 31 (37) 21 (57) 0.042 Sepsis 45 (37) 34 (41) 11 (30) 0.260 Septic shock 28 (23) 21 (25) 7 (19) 0.465 Haemorrhagic shock 11 (9) 8 (10) 3 (8) 0.803 Coma 13 (11) 11 (13) 2 (5) 0.208 ARDS 29 (24) 13 (16) 16 (43) 0.001 Mild 7 (24) 3 (23) 4 (24) Moderate 14 (48) 8 (62) 6 (38) Severe 8 (28) 2 (15) 6 (38)
EFL expiratory flow limitation, BMI body mass index, SOFA Sequential Organ Failure Assessment, SAPS II Simplified Acute Physiology Score, mMRC modified Medical Research Council dyspnoea scale,NYHA New York Heart Association classification, COPD chronic obstructive pulmonary disease, OSAS obstructive sleep apnoea syndrome,CKD chronic kidney disease, ICU intensive care unit, AHRF acute hypoxaemic respiratory failure, ARDS acute respiratory distress syndrome
Table 2 Association between baseline characteristics of patients and the presence of EFL at ICU admission according to logistic regression analysis adjusted for potential confounders
Variables Univariate analysis Multivariate analysis
Crude odds ratio 95% CI p value Adjusted odds ratio 95% CI p value BMI (ref: < 30 kg/m2)
≥ 30 kg/m2
7.0 2.8–17.3 < 0.0001 3.6 1.0–12.6 0.049
mMRC (ref: < 3)
≥ 3 19.7 7.3–52.8 < 0.0001 8.0 2.3–27.1 0.001
COPD (ref: absence)
Presence 8.8 3.4–22.6 < 0.0001 4.6 1.4–15.3 0.008
Heart disease (ref: absence)
Presence 3.7 1.6–8.3 0.002 1.6 0.5–5.0 0.418
CKD (ref: absence)
Presence 3.1 1.2–8.2 0.021 1.7 0.4–6.7 0.470
SOFA score (ref: < 7)
≥ 6 3.0 1.2–7.3 0.016 3.6 1.1–12.0 0.036
OSAS (ref: absence)
Presence 3.3 0.7–15.4 0.134
Age (ref: < 70)
≥ 70 0.9 0.5–2.1 0.968
Smoking history (ref: non-smoker)
Actual smoker 1.8 0.7–4.6 0.203
Past smoker 0.9 0.3–2.4 0.834
SAPS II (ref: < 41)
≥ 42 1.7 0.7–3.7 0.188
BMI body mass index, mMRC modified Medical Research Council scale for dyspnoea, COPD chronic obstructive pulmonary disease, CKD chronic kidney disease, OSAS obstructive sleep apnoea syndrome, SOFA Sequential Organ Failure Assessment, SAPS Simplified Acute Physiology Score
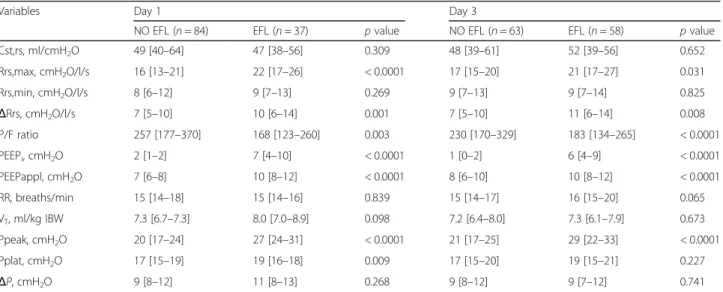
Table 3 Data of respiratory mechanics at day 1 and day 3 after ICU admission
Variables Day 1 Day 3
NO EFL (n = 84) EFL (n = 37) p value NO EFL (n = 63) EFL (n = 58) p value Cst,rs, ml/cmH2O 49 [40–64] 47 [38–56] 0.309 48 [39–61] 52 [39–56] 0.652 Rrs,max, cmH2O/l/s 16 [13–21] 22 [17–26] < 0.0001 17 [15–20] 21 [17–27] 0.031 Rrs,min, cmH2O/l/s 8 [6–12] 9 [7–13] 0.269 9 [7–13] 9 [7–14] 0.825 ΔRrs, cmH2O/l/s 7 [5–10] 10 [6–14] 0.001 7 [5–10] 11 [6–14] 0.008 P/F ratio 257 [177–370] 168 [123–260] 0.003 230 [170–329] 183 [134–265] < 0.0001 PEEPi, cmH2O 2 [1–2] 7 [4–10] < 0.0001 1 [0–2] 6 [4–9] < 0.0001 PEEPappl, cmH2O 7 [6–8] 10 [8–12] < 0.0001 8 [6–10] 10 [8–12] < 0.0001 RR, breaths/min 15 [14–18] 15 [14–16] 0.839 15 [14–17] 16 [15–20] 0.065 VT, ml/kg IBW 7.3 [6.7–7.3] 8.0 [7.0–8.9] 0.098 7.2 [6.4–8.0] 7.3 [6.1–7.9] 0.673 Ppeak, cmH2O 20 [17–24] 27 [24–31] < 0.0001 21 [17–25] 29 [22–33] < 0.0001 Pplat, cmH2O 17 [15–19] 19 [16–18] 0.009 17 [15–20] 19 [15–21] 0.227 ΔP, cmH2O 9 [8–12] 11 [8–13] 0.268 9 [8–12] 9 [7–12] 0.741
EFL expiratory flow limitation, Cst,rs static compliance of the respiratory system, Rrs,max total resistance of the respiratory system, Rrs,min flow resistance of the respiratory system,ΔRrs additional resistance of the respiratory system, P/F arterial partial oxygen pressure to fraction of inspired oxygen ratio, PEEPi intrinsic positive end-expiratory pressure,PEEP appl positive end-expiratory pressure applied at the ventilator, RR respiratory rate, VTtidal volume,IBW ideal body weight, Ppeak peak inspiratory pressure, Pplat plateau pressure, ΔP driving pressure
have relevant clinical consequences since the presence of EFL has numerous side effects [1], such as the presence of PEEPi [32] that might have detrimental effects on re-spiratory efficiency and cardiovascular function. Further, the reduction of the expiratory flow and the inability to increase it by the expiratory muscle contraction decrease the efficacy of cough and secretion removal [14] favour-ing the development of atelectasis, bronchitis and pneu-monia. Finally, EFL might imply cyclic opening/closure
of the small airways [7, 33] that can lead to hypoxaemia and ventilation/perfusion mismatch.
Interestingly, a large amount of the patients enrolled in the present study (48%) were flow limited within the first 72 h of ICU stay, suggesting that EFL is common in ICU patients. Patients with EFL had higher duration of mechanical ventilation, ICU length of stay and ICU mor-tality. These outcomes were associated with a more compromised respiratory function since these patients Fig. 2 Cumulative fluid balance over the first 3 days of ICU stay. Patients who developed expiratory flow limitation (EFL) after ICU admission (blue) had higher cumulative fluid balances compared to those flow limited at admission (violet), and those who never developed EFL (red)
Fig. 3 Correlation between CFB and values of PEEPi in patients developing EFL after the ICU admission. The correlation was determined the day the patients became flow limited
exhibited increased inspiratory and additional resistance and higher PEEPi.
However, our study shows another complementary as-pect that deserves clinical attention. We were surprised that 21 patients (17%) became flow limited after ICU ad-mission. While it is easily explainable that obese patients or those with COPD or heart disease can exhibit EFL at ICU admission, it could be less clear why patients might develop EFL during the ICU stay. Interestingly, the main determinant of EFL after ICU admission was a positive fluid balance. Patients who developed EFL during the first 72 h of ICU stay had the higher cumulative fluid overload (Table4and Fig.2); further, a CFO≥ 10% over the first 2 days of ICU stay was independently associated with EFL (OR 3.7, 95%CI 1.2–11.4, p = 0.025).
Hence, fluid therapy can have relevant clinical conse-quences even at the lung level. Physician should pay par-ticular attention to the amount of fluid administered. Excessive fluids administration can lead to EFL. The lat-ter has been demonstrated to be responsible of damage of small airways that elicit an inflammatory response [22, 23]. It was previously demonstrated that a positive fluid balance can worsen respiratory function, increase the occurrence of pulmonary complication and have an impact on patients’ outcome in patients with acute lung injury and ARDS [34–36].
Detecting and abolishing EFL should be part of the lung-protective strategy. Ventilation at low lung volume leading to EFL could be avoided by the use of PEEP. In patients with flow limited at the ICU admission, the value of PEEP able to avoid EFL was 8 [6–10] cmH2O
and then statistically decreased to 6 [5–8] at day 3, while in those developing EFL during the ICU stay, this value was 5 [5–6] cmH2O at day 1 and 5 [4–7] at day 3. The
effects of PEEP on EFL have been previously tested in patients with ARDS. Koutsoukou et al. [37] demon-strated that 10 cmH2O of PEEP abolished the presence
of EFL during tidal ventilation. The difference between the two studies could be the patients’ population, the se-verity of the underlying disease and the number of pa-tients enrolled. Koutsoukou et al. [37] studied 13 patients while we enrolled 121 patients with ARF of dif-ferent aetiologies.
The present study has some limitations: (1) it is a single-centre design with limited sample size. However, this is the first study aiming at identifying possible causes of EFL occurrence in an unselected cohort of ventilated patients; (2) we did not use other techniques such as extra-vascular lung water measurement or lung ultrasound to quantify lung oedema for confirming the association between cumulative fluid overload and EFL occurrence; (3) application of the PEEP test, as it is for all tests evaluating the presence of EFL, carries the need of having the patients for one breath at ZEEP. This could partially derecruit the lung, although the limited time on ZEEP ventilation should minimise the possible effects of the PEEP test on lung function; and (4) we have reported some data on the association between EFL prevalence/development and ICU mortality. However, these data should be regarded only as descriptive since the observational nature of this study and the small sam-ple size do not allow us to make any conclusion. Future larger studies are needed to prove the potential effect of EFL development on the increase of ICU mortality.
Conclusions
The presence of EFL is common among ICU patients re-quiring mechanical ventilation for acute respiratory failure of different aetiologies. Interestingly, the major determin-ant for developing EFL in patients during the first 3 days of their ICU stay is a positive fluid balance. Further studies are needed to assess if a restrictive fluid therapy might be associated with a lower incidence of EFL.
Supplementary information
Supplementary information accompanies this paper athttps://doi.org/10. 1186/s13054-019-2682-4.
Additional file 1. Flow chart of the study
Additional file 2. Flow-volume loops during positive end-expiratory pressure (PEEP) test
Additional file 3. Clinical and Demographic Characteristics of the Patients Enrolled grouped according to the absence / presence of EFL Additional file 4.“PEEP-EFL” values calculated according to the PEEP test in patients with EFL.
Additional file 5. Respiratory mechanics characteristic of the patients who developed EFL during the ICU stay.
Additional file 6. Cumulative fluid balance and cumulative fluid overload over the first 3 days of ICU stay.
Abbreviations
AHRF:Acute hypoxaemic respiratory failure; AKI: Acute kidney injury; ARDS: Acute respiratory distress syndrome; BMI: Body mass index;
Table 4 Association between severe cumulative fluid overload and development of expiratory flow limitation according to univariate logistic regression analysis
Variables Crude odds ratio 95%CI p value CFO≥ 10%
1st to 2nd ICU day of stay 3.9 1.4–10.9 0.011 CFO≥ 10%
1st to 3rd ICU day of stay 3.1 1.1–8.5 0.030
AKI in ICU 2.2 0.8–6.0 0.796
AHRF 0.2 0.1–1.2 0.075
ARDS 0.9 0.2–3.6 0.862
Septic shock 2.5 0.9–6.8 0.077
CFO cumulative fluid overload, AKI acute kidney injury, ICU intensive care unit, AHRF acute hypoxaemic respiratory failure, ARDS acute respiratory
CFB: Cumulative fluid balance; CFO: Cumulative fluid overload; CKD: Chronic kidney disease; CI: Confidence interval; COPD: Chronic obstructive pulmonary disease; Cst,rs: Static compliance of the respiratory system;ΔP: Driving pressure;ΔRrs: Additional resistance of the respiratory system; EFL: Expiratory flow limitation; EPP: Equal pressure point; KDIGO: Kidney Disease Improving Global Outcomes; IBW: Ideal body weight; ICU: Intensive care unit; MRC: Modified Medical Research Council; NYHA: New York Heart Association classification; OR: Odds ratio; OSAS: Obstructive sleep apnoea syndrome; PEEP: Positive end-expiratory pressure; PEEPappl: Positive end-expiratory pres-sure applied at the ventilator; PEEPi: Intrinsic positive end-expiratory-prespres-sure; P/F: Arterial partial oxygen pressure to fraction of inspired oxygen ratio; Ppeak: Peak inspiratory pressure; Pplat: Plateau pressure; RR: Respiratory rate; Rrs,max: Total resistance of the respiratory system; Rrs,min: Flow resistance of the respiratory system; SAPS: Simplified Acute Physiology Score;
SOFA: Sequential Organ Failure Assessment; VT: Tidal volume; ZEEP: Zero-PEEP
Acknowledgements
We would both like to thank all of the nursing and medical staff on the ICU at Sant’Anna Hospital, Ferrara, Italy.
Authors’ contributions
CAV, EM and SS contributed to design the conception and design of the study. FDC, CR, AF and GS participated in the acquisition and analysis of data for the study. CAV, FDC and SS drafted the work. DLG and RR contributed to the data interpretation and were involved in drafting and revising the manuscript. All authors collaborated to interpret data, revise the work critically for important intellectual content and approve the final version of the manuscript.
Funding None
Availability of data and materials
The datasets used and/or analysed during the current study are available from the corresponding author on reasonable request.
Ethics approval and consent to participate
The study was approved by the ethics committee of our institution (Azienda Ospedaliero-Universitaria Ferrara Ethic Committee, protocol number: 74/ 2016). Informed consent was obtained from each patient or next of kin. Consent for publication
Not applicable. Competing interests
The authors declare that they have no competing interests. Author details
1Department of Morphology, Surgery and Experimental Medicine, Azienda
Ospedaliera-Universitaria Arcispedale Sant’Anna, University of Ferrara, Via Aldo Moro, 8, 44124 Ferrara, Italy.2Department of Anesthesiology and
Intensive Care Medicine, Catholic University of The Sacred Heart, Milan, Italy.
3Department of Anesthesia and Intensive Care Unit, ASST Fatebenefratelli
Sacco, Luigi Sacco Hospital, Polo Universitario, University of Milan, Milan, Italy.
Received: 13 September 2019 Accepted: 21 November 2019
References
1. Junhasavasdikul D, Telias I, Grieco DL, et al. Expiratory flow limitation during mechanical ventilation. Chest. 2018;154:948–62.
2. Mead J, Turner JM, Macklem PT, et al. Significance of the relationship between lung recoil and maximum expiratory flow. J Appl Physiol. 1967;22: 95–108.
3. Hyatt RE. Expiratory flow limitation. J Appl Physiol Respir Environ Exerc Physiol. 1983;55:1–7.
4. Eltayara L, Becklake MR, Volta CA, et al. Relationship between chronic dyspnea and expiratory flow limitation in patients with chronic obstructive pulmonary disease. Am J Respir Crit Care Med. 1996;154:1726–34. 5. OF P, Butler JP. Expiratory flow limitation. Compr Physiol. 2011;1:1861–82.
6. Koulouris NG, Dimopoulou I, Valta P, Finkelstein R, Cosio MG, Milic-Emili J. Detection of expiratory flow limitation during exercise in COPD patients. J Appl Physiol (1985). 1997;82:723–31.
7. Koutsoukou A, Pecchiari M. Expiratory flow-limitation in mechanically ventilated patients: a risk for ventilator-induced lung injury? World J Crit Care Med. 2019;8:1–8.
8. Alvisi V, Romanello A, Badet M, et al. Time course of expiratory flow limitation in COPD patients during acute respiratory failure requiring mechanical ventilation. Chest. 2003;123:1625–32.
9. Koutsoukou A, Armaganidis A, Stavrakaki-Kallergi C, et al. Expiratory flow limitation and intrinsic positive expiratory pressure at zero positive end-expiratory pressure in patients with adult respiratory distress syndrome. Am J Respir Crit Care Med. 2000;161:1590–6.
10. Chen L, Del Sorbo L, Grieco DL, et al. Airway closure in acute respiratory distress syndrome: an underestimated and misinterpreted phenomenon. Am J Respir Crit Care Med. 2018;197:132–6.
11. Duguet A, Tantucci C, Lozinguez O, et al. Expiratory flow limitation as a determinant of orthopnea in acute left heart failure. J Am Coll Cardiol. 2000; 35:690–700.
12. Torchio R, Gulotta C, Greco-Lucchina P, et al. Orthopnea and tidal expiratory flow limitation in chronic heart failure. Chest. 2006;130:472–9.
13. Goetghebeur D, Sarni D, Grossi Y, et al. Tidal expiratory flow limitation and chronic dyspnoea in patients with cystic fibrosis. Eur Respir J. 2002;19:492–8. 14. Alvisi V, Marangoni E, Zannoli S, et al. Pulmonary function and expiratory
flow limitation in acute cervical spinal cord injury. Arch Phys Med Rehabil. 2012;93:1950–6.
15. Koutsoukou A, Koulouris N, Bekos B, et al. Expiratory flow limitation in morbidly obese postoperative mechanically ventilated patients. Acta Anaesthesiol Scand. 2004;48:1080–8.
16. Spadaro S, Caramori G, Rizzuto C, et al. Expiratory flow limitation as a risk factor for pulmonary complications after major abdominal surgery. Anesth Analg. 2017;124:524–30.
17. Guérin C, Coussa ML, Eissa NT, Corbeil C, Chassé M, Braidy J, Matar N, Milic-Emili J. Lung and chest wall mechanics in mechanically ventilated COPD patients. J Appl Physiol (1985). 1993;74:1570–80.
18. Armaganidis A, Stavrakaki-Kallergi K, Koutsoukou A, et al. Intrinsic positive end-expiratory pressure in mechanically ventilated patients with and without tidal expiratory flow limitation. Crit Care Med. 2000;28:3837–42. 19. Yonis H, Mortaza S, Baboi L, et al. Expiratory flow limitation assessment in
patients with acute respiratory distress syndrome. A reappraisal. Am J Respir Crit Care Med. 2018;198:131–4.
20. Marangoni E, Alvisi V, Ragazzi R, et al. Respiratory mechanics at different PEEP level during general anesthesia in the elderly: a pilot study. Minerva Anestesiol. 2012;78:1205–14.
21. Muscedere JG, Mullen JB, Gan K, et al. Tidal ventilation at low airway pressures can augment lung injury. Am J Respir Crit Care Med 1994; 149: 1327–1334.
22. D’Angelo E, Pecchiari M, Baraggia P, et al. Low volume ventilation causes peripheral airway injury and increased airway resistance in normal rabbits. J Appl Physiol (1985). 2002;92:949–56.
23. Pecchiari M, Monaco A, Koutsoukou A, Della Valle P, Gentile G, D'Angelo E. Effects of various modes of mechanical ventilation in normal rats. Anesthesiology. 2014;120:943–50.
24. Koutsoukou A. Expiratory flow limitation and airway closure in patients with acute respiratory distress syndrome. Am J Respir Crit Care Med. 2019;199: 127–8.
25. Mahler DA, Wells CK. Evaluation of clinical methods for rating dyspnea. Chest. 1998;93:580–6.
26. Society AT, Society ER. Diagnosis and management of stable chronic obstructive pulmonary disease: a clinical practice guideline update from the American College of Physicians, American College of Chest Physicians, American Thoracic Society, and European Respiratory Society. Ann Intern Med. 2011;155:179–91.
27. Global Initiative for Chronic Obstructive Lung Disease (GOLD). Global strategy for the diagnosis, management, and prevention of chronic obstructive pulmonary disease. 2018 [internet publication].
28. ARDS Definition Task Force. Acute respiratory distress syndrome: the Berlin Definition. JAMA. 2012;307:2526–33.
29. KDIGO AKI. Guideline Work Group. Diagnosis, evaluation, and management of acute kidney injury: a KDIGO summary (part 1). Crit Care. 2013;17:204.
30. Singer M, Deutschman CS, Seymour CW, et al. The third international consensus definitions for sepsis and septic shock (Sepsis-3). JAMA. 2016;315: 801–10.
31. Samoni S, Vigo V, Reséndiz LI, et al. Impact of hyperhydration on the mortality risk in critically ill patients admitted in intensive care units: comparison between bioelectrical impedance vector analysis and cumulative fluid balance recording. Crit Care. 2016;20:95.
32. VENTILAB group. Effect of external PEEP in patients under controlled mechanical ventilation with an auto-PEEP of 5 cmH2O or higher. Ann Intensive Care. 2016;6:53.
33. Valta P, Corbeil C, Lavoie A, et al. Detection of expiratory flow limitation during mechanical ventilation. Am J Respir Crit Care Med. 1994;150:1311–7. 34. Pediatric Acute Lung Injury and Sepsis Investigator's (PALISI) Network; Acute
Respiratory Distress Syndrome Clinical Research Network (ARDSNet). Fluid balance in critically ill children with acute lung injury. Crit Care Med. 2012; 40:2883–9.
35. Sepsis Occurrence in Acutely Ill Patients Investigators. High tidal volume and positive fluid balance are associated with worse outcome in acute lung injury. Chest. 2005;128:3098–108.
36. National Heart, Lung, and Blood Institute Acute Respiratory Distress Syndrome (ARDS) Clinical Trials Network. Comparison of two fluid-management strategies in acute lung injury. N Engl J Med. 2006;354:2564–75.
37. Koutsoukou A, Bekos B, Sotiropoulou C, et al. Effects of positive end-expiratory pressure on gas exchange and end-expiratory flow limitation in adult respiratory distress syndrome. Crit Care Med. 2002;30:1941–9.
Publisher’s Note
Springer Nature remains neutral with regard to jurisdictional claims in published maps and institutional affiliations.