Copyright 2016 American Medical Association. All rights reserved.
Altered Functional Subnetwork During Emotional
Face Processing
A Potential Intermediate Phenotype for Schizophrenia
Hengyi Cao, MB, MMedSc; Alessandro Bertolino, MD, PhD; Henrik Walter, MD, PhD; Michael Schneider, MD; Axel Schäfer, PhD; Paolo Taurisano, PhD; Giuseppe Blasi, MD, PhD; Leila Haddad, PhD; Oliver Grimm, MD; Kristina Otto, MSc; Luanna Dixson, BSc; Susanne Erk, MD, PhD; Sebastian Mohnke, MSc; Andreas Heinz, MD, PhD; Nina Romanczuk-Seiferth, PhD; Thomas W. Mühleisen, PhD; Manuel Mattheisen, MD; Stephanie H. Witt, PhD;
Sven Cichon, PhD; Markus Noethen, MD, PhD; Marcella Rietschel, MD, PhD; Heike Tost, MD, PhD; Andreas Meyer-Lindenberg, MD, PhD
IMPORTANCEAlthough deficits in emotional processing are prominent in schizophrenia, it has been difficult to identify neural mechanisms related to the genetic risk for this highly heritable illness. Prior studies have not found consistent regional activation or connectivity alterations in first-degree relatives compared with healthy controls, suggesting that a more
comprehensive search for connectomic biomarkers is warranted.
OBJECTIVES To identify a potential systems-level intermediate phenotype linked to emotion processing in schizophrenia and to examine the psychological association, task specificity, test-retest reliability, and clinical validity of the identified phenotype.
DESIGN, SETTING, AND PARTICIPATIONS The study was performed in university research hospitals from June 1, 2008, through December 31, 2013. We examined 58 unaffected first-degree relatives of patients with schizophrenia and 94 healthy controls with an emotional face-matching functional magnetic resonance imaging paradigm. Test-retest reliability was analyzed with an independent sample of 26 healthy participants. A clinical association study was performed in 31 patients with schizophrenia and 45 healthy controls. Data analysis was performed from January 1 to September 30, 2014.
MAIN OUTCOMES AND MEASURESConventional amygdala activity and seeded connectivity measures, graph-based global and local network connectivity measures, Spearman rank correlation, intraclass correlation, and gray matter volumes.
RESULTS Among the 152 volunteers included in the relative-control sample, 58 were unaffected first-degree relatives of patients with schizophrenia (mean [SD] age, 33.29 [12.56]; 38 were women), and 94 were healthy controls without a first-degree relative with mental illness (mean [SD] age, 32.69 [10.09] years; 55 were women). A graph-theoretical connectivity approach identified significantly decreased connectivity in a subnetwork that primarily included the limbic cortex, visual cortex, and subcortex during emotional face processing (cluster-level P corrected for familywise error = .006) in relatives compared with controls. The connectivity of the same subnetwork was significantly decreased in patients with schizophrenia (F = 6.29, P = .01). Furthermore, we found that this subnetwork
connectivity measure was negatively correlated with trait anxiety scores (P = .04), test-retest reliable (intraclass correlation coefficient = 0.57), specific to emotional face processing (F = 17.97, P < .001), and independent of gray matter volumes of the identified brain areas (F = 1.84, P = .18). Replicating previous results, no significant group differences were found in face-related amygdala activation and amygdala–anterior cingulate cortex connectivity (P corrected for familywise error =.37 and .11, respectively).
CONCLUSIONS AND RELEVANCEOur results indicate that altered connectivity in a visual-limbic subnetwork during emotional face processing may be a functional connectomic intermediate phenotype for schizophrenia. The phenotype is reliable, task specific, related to trait anxiety, and associated with manifest illness. These data encourage the further investigation of this phenotype in clinical and pharmacologic studies.
JAMA Psychiatry. 2016;73(6):598-605. doi:10.1001/jamapsychiatry.2016.0161
Published online May 4, 2016.
Editorialpage 555
Supplemental contentat
jamapsychiatry.com
Author Affiliations: Author
affiliations are listed at the end of this article.
Corresponding Author: Andreas
Meyer-Lindenberg, MD, PhD, Department of Psychiatry and Psychotherapy, Central Institute of Mental Health, Medical Faculty Mannheim, University of Heidelberg, Square J5, 68159 Mannheim, Germany (a.meyer-lindenberg @zi-mannheim.de). Research Original Investigation 598 (Reprinted) jamapsychiatry.com
Copyright 2016 American Medical Association. All rights reserved.
Copyright 2016 American Medical Association. All rights reserved.
S
chizophrenia is a highly heritable mental disorder char-acterized by severe deficits in emotion processing.1,2Meta-analyses of patient data have pointed to a strong association between emotional deficits and dysfunctions of the limbic system.3-5However, whether and how these
altera-tions relate to the genetic risk of schizophrenia remain un-clear. A useful strategy to identify genetic mechanisms is the search for intermediate phenotypes, which are heritable traits related to the genetic predisposition to the disorder.6,7The
study of unaffected first-degree relatives, who share an en-riched set of schizophrenia risk genes but do not manifest clini-cal symptoms, provides important evidence for the establish-ment of a putative intermediate phenotype.7-10Although this
strategy has been successful in cognitive domains, such as working memory,11declarative memory,12,13and reward
processing,14findings in emotional face processing have been
inconclusive, with decreased,15,16increased,17or unchanged18
amygdala reactivity and/or connectivity in relatives com-pared with controls.
This incongruence suggests that the search for an emotion-related intermediate phenotype may have to look beyond re-gional activation and connectivity analyses, which focus on a restricted set of regions and possibly overlook potential mul-tidimensional network changes. Previous work19-22using graph
theory–based methods has found significant alterations in the brain connectome of patients with schizophrenia during ac-tive tasks and resting state. The connectomic measures are heritable,23,24implying their utility for identifying
interme-diate phenotypes related to emotional face processing. Our study aimed to identify potential connectomic inter-mediate phenotypes related to emotional face processing in schizophrenia. First, we used graph theory–based character-ization of the connectome to identify potential functional net-work changes in unaffected first-degree relatives (58 rela-tives, 94 controls) using functional magnetic resonance imaging (fMRI) and a well-established emotional face-matching task.25
In accordance with prior findings,26we posited alterations in
connectivity between the visual cortex and the limbic system in relatives compared with controls. We further performed sev-eral follow-up analyses to investigate the utility of this poten-tial intermediate phenotype by testing for psychological as-sociation, task specificity, test-retest reliability, and potential structural confounds. Second, we tested in an independent sample for the presence of the identified phenotype in schizo-phrenia (31 patients, 45 controls) for clinical validation.
Methods
Participants
One hundred fifty-two healthy volunteers from 3 sites in Ger-many (Mannheim, Bonn, and Berlin) were included in our relative-control sample from June 1, 2008, through Decem-ber 31, 2013. Among these, 58 were unaffected first-degree relatives of patients with schizophrenia (mean [SD] age, 33.29 [12.56] years; 38 women), and 94 were healthy controls without a first-degree relative with mental illness (mean [SD] age, 32.69 [10.09] years; 55 women). The groups were
bal-anced for a broad range of demographic, psychological, task performance, and image quality parameters (P > .10 for all) (Table 1 and eMethods in theSupplement). All participants provided written informed consent for the protocols approved by the institutional review boards of the University of Heidelberg, University of Bonn, and Universitätsmedizin Charité, Berlin.
MRI Modalities and Paradigms
Participants completed a well-established emotional face-matching fMRI task.25,27,28The face-matching task is an
im-plicit emotional processing paradigm designed to challenge the amygdala.25,27,28The block-designed task consists of 2
condi-tions: an emotional condition (matching faces) and a control condition (matching forms). In the emotional condition, par-ticipants are presented with trios of faces from a standard set of pictures of facial affect29that depict fearful or angry
ex-pressions. Participants are instructed to match the 2 corre-sponding stimuli that illustrate the same individual. In the con-trol condition, participants are presented with trios of simple geometric shapes (circles, vertical and horizontal ellipses) and are asked to match the 2 corresponding geometric shapes. In addition, we acquired resting-state fMRI images and high-resolution structural images for the participants (eMethods in theSupplement).
Data Acquisition and Quality Control
The MRI data were acquired from 3 Siemens 3-T scanners (Siemens Trio) with identical protocols. For fMRI data quality assurance, we quantified several head motion parameters and signal-to-noise ratio. Head motion parameters were quanti-fied as previously detailed14,30-32and included the sum of
vol-ume to volvol-ume translational excursions across the time se-ries, the sum of volume to volume rotational excursions across the time series, and the mean voxel-based framewise displace-ment. The signal to noise ratio of images was calculated using the New York University Center for Brain Imaging dataQual-ity toolbox (http://cbi.nyu.edu/software/dataQuality.php).33-35
Statistical comparisons of data quality parameters between relatives and controls were performed with SPSS statistical software, version 20 (SPSS Inc), using independent t tests. As detailed in Table 1, groups were balanced for data quality assurance measures.
Key Points
QuestionDo unaffected first-degree relatives of patients with schizophrenia have functional brain abnormalities during emotion processing?
FindingsThis study identified significantly decreased
connectivity in a network, primarily including the limbic cortex and the visual cortex, during emotional face processing in unaffected first-degree relatives of patients with schizophrenia compared with controls. The connectivity of the same network was also significantly decreased in patients with schizophrenia. MeaningAltered connectivity in a visual-limbic network during emotional face processing may be an intermediate phenotype for schizophrenia.
Altered Functional Subnetwork During Emotional Face Processing Original Investigation Research
jamapsychiatry.com (Reprinted) JAMA Psychiatry June 2016 Volume 73, Number 6 599
Copyright 2016 American Medical Association. All rights reserved.
Copyright 2016 American Medical Association. All rights reserved.
Activity and Seed-Based Connectivity Analyses
We first aimed to replicate the negative amygdala activation and seed-based connectivity results reported by Rasetti et al.18
We followed the methods outlined in that study and used stan-dard procedures implemented in Statistical Parametric Map-ping, version 8 (http://www.fil.ion.ucl.ac.uk/spm/software /spm8/).Briefly, for the activity analysis, functional images were realigned, slice time corrected, normalized to the Montreal Neurological Institute brain template, spatially smoothed, and subjected to first-level general linear model estimation. For the analysis of group differences, first-level contrast images (face matching greater than form matching) were entered into a second-level random-effects model. Results were reported after familywise error (FWE) correction across an a priori defined anatomical mask of the bilateral amygdala from the Automated Anatomical Labeling (AAL) atlas.36For the
connectivity analysis, the mean time series of the bilateral amygdala from the AAL atlas were extracted after noise correction and entered into the level model. These first-level connectivity maps were then entered into a second-level random-effects model. Results for between-group effects
were reported after FWE correction across a bilateral anterior cingulate cortex mask from the AAL atlas (eMethods in the
Supplement).
Brain Network Analyses
Brain network analyses followed our previously published procedures.3 1The mean time series during the
face-processing task were extracted from each of the 90 anatomi-cal nodes defined by the AAL atlas and corrected for noise. Whole-brain connectivity matrices were then calculated by pairwise Pearson correlations between nodes. The derived con-nectivity matrices were analyzed at 2 levels. At the global level, we further thresholded the matrices with multiple densities and computed 4 commonly used global network properties (smallworldness, modularity, global efficiency, and character-istic path length) for each density. Repeated-measures analy-sis of covariance (ANCOVA) models were used for group com-parison with density as the within-subject factor and group (relatives vs controls) as the between-subject factor, covary-ing for age, sex, site, and mean framewise displacement. At the local level, the network-based statistic37,38was used for
link-Table 1. Sample Characteristics of Relatives of Patients With Schizophrenia and Healthy Controls for the Identification of an Intermediate Phenotypea
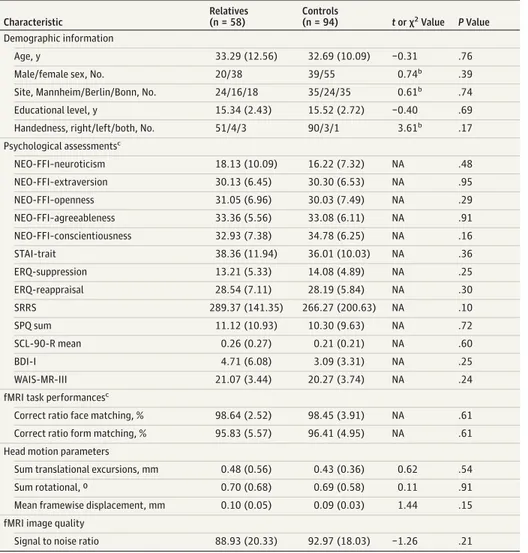
Characteristic Relatives (n = 58) Controls (n = 94) t or χ2Value P Value Demographic information Age, y 33.29 (12.56) 32.69 (10.09) −0.31 .76 Male/female sex, No. 20/38 39/55 0.74b .39
Site, Mannheim/Berlin/Bonn, No. 24/16/18 35/24/35 0.61b .74
Educational level, y 15.34 (2.43) 15.52 (2.72) −0.40 .69 Handedness, right/left/both, No. 51/4/3 90/3/1 3.61b .17
Psychological assessmentsc NEO-FFI–neuroticism 18.13 (10.09) 16.22 (7.32) NA .48 NEO-FFI–extraversion 30.13 (6.45) 30.30 (6.53) NA .95 NEO-FFI–openness 31.05 (6.96) 30.03 (7.49) NA .29 NEO-FFI–agreeableness 33.36 (5.56) 33.08 (6.11) NA .91 NEO-FFI–conscientiousness 32.93 (7.38) 34.78 (6.25) NA .16 STAI-trait 38.36 (11.94) 36.01 (10.03) NA .36 ERQ-suppression 13.21 (5.33) 14.08 (4.89) NA .25 ERQ-reappraisal 28.54 (7.11) 28.19 (5.84) NA .30 SRRS 289.37 (141.35) 266.27 (200.63) NA .10 SPQ sum 11.12 (10.93) 10.30 (9.63) NA .72 SCL-90-R mean 0.26 (0.27) 0.21 (0.21) NA .60 BDI-I 4.71 (6.08) 3.09 (3.31) NA .25 WAIS-MR-III 21.07 (3.44) 20.27 (3.74) NA .24 fMRI task performancesc
Correct ratio face matching, % 98.64 (2.52) 98.45 (3.91) NA .61 Correct ratio form matching, % 95.83 (5.57) 96.41 (4.95) NA .61 Head motion parameters
Sum translational excursions, mm 0.48 (0.56) 0.43 (0.36) 0.62 .54 Sum rotational, º 0.70 (0.68) 0.69 (0.58) 0.11 .91 Mean framewise displacement, mm 0.10 (0.05) 0.09 (0.03) 1.44 .15 fMRI image quality
Signal to noise ratio 88.93 (20.33) 92.97 (18.03) −1.26 .21
Abbreviations: BDI-I, Beck Depression Inventory (version I); ERQ, Emotion Regulation Questionnaire; fMRI, functional magnetic resonance imaging; NA, data not applicable;
NEO-FFI, NEO Five Factor Inventory; SCL-90-R, Symptom
Checklist-90–Revised; SPQ, Schizotypal Personality Questionnaire; SRRS, Social Readjustment Rating Scale; STAI-trait, trait subscale of the State-Trait Anxiety Inventory; WAIS-MR-III, matrix reasoning subscale of Wechsler Adult Intelligence Scale (version III).
aData are presented as mean (SD)
unless otherwise indicated.
bχ2Value.
cFor psychological assessments and
task performances, Mann-Whitney nonparametric tests were used because of the nonnormal distribution of the data.
Research Original Investigation Altered Functional Subnetwork During Emotional Face Processing
600 JAMA Psychiatry June 2016 Volume 73, Number 6 (Reprinted) jamapsychiatry.com
Copyright 2016 American Medical Association. All rights reserved.
Copyright 2016 American Medical Association. All rights reserved.
wise comparisons of the connectivity matrices between groups. This was done as previously described37,38by 2 steps. First, we
computed initial t test statistics for all pairwise connections (contrasting relatives and controls and controlling for age, sex, site, and mean framewise displacement), which generated a set of suprathreshold links. Second, permutation testing was used to derive corrected P values for the generated link clus-ters (eMethods in theSupplement).
Follow-up Analyses
We performed several follow-up analyses to substantiate our connectomic finding as a potential intermediate phenotype for schizophrenia. In follow-up analyses 1 to 4, we reduced data dimensionality by averaging the connectivity estimates of all links in the identified subnetwork for each participant. See eMethods in theSupplementfor details on the rationale and methods of the follow-up analyses.
Association With Trait Anxiety
Trait anxiety is an important assessment of emotion stability and may plausibly relate to the identified subnetwork con-nectivity phenotype. We probed for the presence of this asso-ciation by calculating the Spearman rank correlation be-tween the mean subnetwork connectivity estimates and trait anxiety scores derived from the State-Trait Anxiety Inven-tory across the participants in the control group. Significance was set at P < .05.
Clinical Association
We further aimed to verify the presence of alterations in the identified subnetwork connectivity phenotype in schizophre-nia. For this, we collected fMRI data from independent samples of 31 patients with schizophrenia (mean [SD] age, 30.58 [7.05] years; 7 women) and 45 healthy controls (mean [SD] age, 32.00 [9.50] years; 19 women). Participants were recruited from psychiatric hospitals and communities in and around Mannheim, Germany, and Bari, Italy. All patients were diag-nosed as having schizophrenia by psychiatrists according to the Structured Clinical Interview for DSM-IV and were taking
antipsychotic medication. Participants from Mannheim com-pleted the same face-matching fMRI task used in the rela-tives study, and participants from Bari underwent scanning with a slightly modified version of the task39and a different
scanner (Signa 3-T scanner, GE Healthcare) (Table 2 and eMethods in theSupplement). Data processing followed the same procedures described in the first study. Mean subnet-work connectivity was calculated for each participant and group difference in the derived metric was tested using an ANCOVA model, covarying for age, sex, site and mean frame-wise displacement.
Test-Retest Reliability
Test-retest reliability of the identified subnetwork connectiv-ity measure was analyzed using an independent sample of 26 healthy controls scanned twice with the same face-matching task (mean [SD] age, 24.4 [2.8] years; 15 women; mean [SD] scan interval, 14.6 [2.1] days; data previously reported by Cao et al31). Intraclass correlation coefficient (ICC) was used as an
index of robustness. Consistent with established criteria,30,31,40
an ICC greater than 0.40 was interpreted to be indicative of fair to good reliability.
Task Specificity
To investigate whether the identified subnetwork finding is specific to emotional face processing or represents a task-independent functional connectomic alteration, we com-pared the subnetwork connectivity measure during face processing with that during the resting state in the same in-dividuals. Group differences during 2 fMRI task conditions (ie, face matching, resting state) and group by task interaction effects were examined using a repeated-measures ANCOVA model.
Structural Analysis
We analyzed high-resolution structural data of relatives and controls to test whether the identified functional alterations may be influenced by structural differences. We compared mean gray matter volumes of the identified subnetwork nodes Table 2. Sample Characteristics of the Patient and Control Groups for the Clinical Validation Studya
Characteristic
Patients With Schizophrenia (n = 31)
Healthy Controls
(n = 45) t or χ2Value P Value
Demographic information
Age, y 30.58 (7.05) 32.00 (9.50) −0.75 .46 Male/female sex, No. 24/7 26/19 3.15b .08
Site, Mannheim/Bari, No. 12/19 19/26 0.09b .76
fMRI task performancesc
Face matching, % correct 90.99 (16.88) 96.37 (4.51) NA .15 Form matching, % correct 92.21 (9.52) 97.78 (4.40) NA .16 Head motion parameters
Sum translational excursions, mm
0.57 (0.66) 0.63 (0.56) −0.44 .67 Sum rotational excursions, º 0.86 (0.79) 0.71 (0.56) 0.98 .36 Mean framewise
displacement, mm
0.13 (0.11) 0.08 (0.05) 2.64 .03 fMRI image quality
Signal to noise ratiod 203.73 (104.37) 220.43 (113.35) 0.65 .52
Abbreviations: fMRI, functional magnetic resonance imaging; NA, data not applicable.
aData are presented as mean (SD)
unless otherwise indicated.
b
χ2
Value.
c
For task performances,
Mann-Whitney nonparametric tests were used because of the nonnormal distribution of the data.
dNote that the data was partly
derived from a different fMRI scanner compared with the relatives study.
Altered Functional Subnetwork During Emotional Face Processing Original Investigation Research
jamapsychiatry.com (Reprinted) JAMA Psychiatry June 2016 Volume 73, Number 6 601
Copyright 2016 American Medical Association. All rights reserved.
Copyright 2016 American Medical Association. All rights reserved.
derived from high-resolution structural MRI and voxel-based morphometry. We also computed structural covariance ma-trices of cross-participant correlations between gray matter volumes and investigated linkwise group differences in the structural matrices. Significance was set at P < .05 after FWE correction.
Results
Activity and Seed-Based Connectivity Analyses in Relatives and Controls
Consistent with a previous study,18significant differences in
amygdala activity (small-volume P corrected for FWE = .37) and amygdala–anterior cingulate cortex seeded connectivity (small-volume P corrected for FWE = .11) between healthy first-degree relatives and controls during the face-matching task were not detected.
Brain Network Analysis in Relatives and Controls
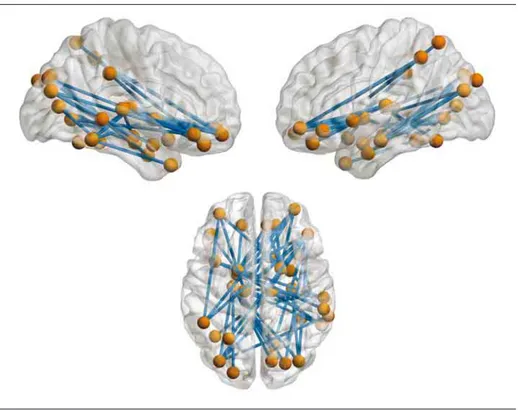
At the global level, no significant group differences were found for the measured network properties (P = .82 for smallworld-ness, P = .59 for modularity, P = .46 for global efficiency, P = .43 for characteristic path length) (eFigure 1 in theSupplement). At the subnetwork level, the network-based statistic identi-fied a cluster that showed significantly decreased coupling in relatives compared with controls (P corrected for FWE = .006), which consisted of 49 links between pairs of 33 nodes chiefly in the limbic system (amygdala, hippocampus, parahippo-campal gyrus, insula, orbitofrontal cortex), the visual cortex (calcarine sulcus, fusiform gyrus, superior and middle
occipi-tal gyrus, cuneus, lingual gyrus), and the subcortex (pall-idum and thalamus) (Figure 1 and eTable 1 in the Supple-ment). The mean connectivity across all subnetwork links was significantly decreased in relatives of patients with schizo-phrenia.
Follow-up Analyses
Psychological Association
The Spearman correlation analysis revealed a significantly negative correlation between mean subnetwork connectiv-ity and State-Trait Anxiety Inventory trait scores (ρ = −0.22, P = .04) (Figure 2), suggesting that lower subnetwork connectivity is associated with higher anxiety in healthy individuals.
Clinical Association
We observed a significant decrease of mean subnetwork con-nectivity in patients with schizophrenia compared with healthy controls (P = .01, partial η2= 0.08, indicating a medium
ef-fect size41) (Figure 3). This finding indicates that the
identi-fied subnetwork alteration is also present in patients with the same directionality detected in first-degree relatives. Test-Retest Reliability
The ICC values for mean subnetwork connectivity were ICC2,1= 0.57 and ICC3,1= 0.57. These values indicate a fair to
good reliability of the identified intermediate phenotype. Task Specificity
In contrast to a significant group difference detected for the emotional task (P = 6.13 × 10⁻¹⁰), analysis of participants’
rest-Figure 1. Altered Visual-Limbic Subnetwork in Relatives of Patients With Schizophrenia During Emotional Face Processing
All links in this subnetwork show decreased connectivity in relatives compared with controls. Cluster-level
P corrected for familywise error
= .006.
Research Original Investigation Altered Functional Subnetwork During Emotional Face Processing
602 JAMA Psychiatry June 2016 Volume 73, Number 6 (Reprinted) jamapsychiatry.com
Copyright 2016 American Medical Association. All rights reserved.
Copyright 2016 American Medical Association. All rights reserved.
ing state data revealed no significant between-group differ-ences in mean subnetwork connectivity (P = .29). In addi-tion, a significant group by task interaction was found for the subnetwork measure (P = 4.0 × 10⁻⁵) (Figure 2).
Structural Analysis
There were no significant differences in mean gray matter vol-umes of the identified subnetwork nodes (P = .18) (eFigure 2 in theSupplement) and in the constructed structural covari-ance matrices (P corrected for FWE > .99) between relatives and controls.
Discussion
In this study, we identified decreased functional connectivity in a visual-limbic subnetwork in unaffected first-degree rela-tives during emotional face processing, verified comparable ab-normalities in patients with schizophrenia, and provided evi-dence of the utility of this potential intermediate phenotype by analyses of its psychological association, reliability, task depen-dence, and potential structural confounds. In humans, emo-tion processing depends on at least 2 multinodal cooperative brain systems42-44: a ventral system for the identification of
emotional significance and the initiation of corresponding re-sponses, including fusiform gyrus, amygdala, insula, basal gan-glia, thalamus, ventral anterior cingulate cortex, and orbito-frontal and ventrolateral preorbito-frontal cortex, and a dorsal system for the regulation of affective states, including dorsolateral and dorsomedial prefrontal cortex, dorsal anterior cingulate cor-tex, and hippocampus. In schizophrenia, meta-analytical evi-dence points toward functional alterations in multiple brain nodes during emotional face processing, including fusiform gyrus,3,5amygdala,3-5hippocampus,5medial and dorsolateral
prefrontal cortex,3,5and subcortex.3,5Because these deficits
range across more than 1 aforementioned system, they may plausibly reflect a failure in the coordination of interacting func-tional subunits of the emofunc-tional network. A previous study26
further found decreased effective connectivity among several of these brain regions in unaffected siblings of patients with schizophrenia. This finding may imply that the proposed mul-tisystem coordination failure relates to the genetic risk of the illness. In line with this proposal, our study identified a con-nectivity deficit in a large-scale emotional face-processing network in unaffected first-degree relatives of patients. The defi-cit spanned the ventral (eg, fusiform gyrus, amygdala, insula, basal ganglia, thalamus, orbitofrontal cortex) and dorsal (eg, hip-pocampus) emotion-processing systems. Because we verified consistent abnormalities in patients with schizophrenia, these findings highlight a potential connectomic intermediate phe-notype for schizophrenia.
We performed several follow-up analyses to sustain our subnetwork finding as a potential intermediate phenotype re-lated to emotional face processing. First, we found that the sub-network connectivity was significantly correlated with trait anxiety scores, suggesting a link between the identified sub-network and emotion-related personality. Second, we found that the subnetwork connectivity alteration in first-degree rela-tives was evident in the face-matching task but not in resting state, suggesting a degree of functional specificity of this po-tential intermediate phenotype. Third, consistent with our prior work,31we found that the subnetwork measure was
test-retest reliable, suggesting that the proposed connectivity fea-ture is a promising target intermediate phenotype for longi-tudinal studies, such as drug interventions.
We also addressed several important confounding fac-tors in this study. First, in accordance with common practice,6,8,14we controlled for demographic differences by
bal-ancing our sample for age, sex, site, educational level, and handedness. Second, similar to a prior study,14we controlled
for group differences in psychological characteristics and fMRI task performances, thereby ensuring that the detected sub-network anomalies are not confounded by these behavioral measures. Third, considering that head motion may cause spu-rious effects on connectivity measures,45,46we balanced our
sample for several head motion and signal-quality para-meters and adjusted for head motion in our analyses. Fourth, Figure 3. Alteration of the Identified Subnetwork in Patients
0.5 0.4 0.3 0.2 Mean Subnet w ork Connectivit y Controls Patients P =.01
Similar to first-degree relatives of patients with schizophrenia, patients with schizophrenia have significantly decreased connectivity estimates in the identified visual-limbic subnetwork compared with healthy controls. Bars indicate mean values. Error bars indicate SEs.
Figure 2. Follow-up Analyses for the Identified Subnetwork
0.5 0.4 0.3 0.2 Mean Subnet w ork Connectivit y Mean Subnet w ork Connectivit y P = 6.13 × 10⁻¹⁰ P = .29 0.7 0.6 0.5 0.4 0.3 0.2 Face Matching Resting State STAI Trait 20 30 40 50 60 70 Controls Relatives P = 4.0 × 10⁻⁵ ρ = –0.22 P = .04
The mean subnetwork connectivity is negatively correlated with trait anxiety scores derived from the State-Trait Anxiety Inventory (STAI) in the subsample of healthy controls. The mean subnetwork connectivity reveals a significant difference between relatives of patients with schizophrenia and healthy controls during the emotional face-matching task but not in the resting state. The group by task interaction is significant. Bars indicate mean values. Error bars indicate SEs.
Altered Functional Subnetwork During Emotional Face Processing Original Investigation Research
jamapsychiatry.com (Reprinted) JAMA Psychiatry June 2016 Volume 73, Number 6 603
Copyright 2016 American Medical Association. All rights reserved.
Copyright 2016 American Medical Association. All rights reserved.
given that morphometric abnormalities have been reported for some subnetwork nodes in patients with schizophrenia,47-49
we probed for potential group differences in gray matter vol-umes and structural covariance patterns of the nodes. The re-sults suggest that the functional subnetwork alterations are not explained by preexisting structural anomalies.
Our data have provided empirical evidence of several conceptual requirements outlined for putative intermediate phenotypes.6-10Specifically, this subnetwork is altered in
un-affected individuals with increased genetic risk for schizophre-nia, is associated with the illness, and is quantitatively reliable. Although establishing a neuroimaging intermediate phenotype that satisfies all requirements is extremely challenging and rarely accomplished in practice,10and some other measures for this
subnetwork finding require further investigation (eg, heritabil-ity), our study points to a promising intermediate phenotype for schizophrenia during emotional face processing.
There were some negative findings of this study. First, con-sistent with the findings of Rasetti et al,18we did not find
sig-nificant differences in face-related amygdala activation and seed-based connectivity measures, suggesting a greater sen-sitivity of the connectomic approach in search for intermedi-ate phenotypes during emotional face processing. Second, there were no significant group differences in measured global network properties. Global properties are, by nature, less sen-sitive to focal changes at the subnetwork level yet require strin-gent correction for multiple comparisons.50Furthermore,
global network properties derived from the face-matching task have been found less reliable than connectivity properties on which the network-based statistic method is based.31These
points may have plausibly contributed to the negative results in global properties.
Our study has several limitations. First, despite the rela-tively large sample size, first-degree relatives in our study were from several generations, with a small number of individuals younger than 20 years. However, most previous studies15,17,18
only focus on healthy siblings older than 20 years to mini-mize potential confounding effects, such as cohort-specific life experiences and prodromal effects.7,8Second, our findings are
based on an emotional face-matching task that allows the as-sessment of perceptual functions related to emotional face pro-cessing but not the differentiation of specific emotional func-tions in the amygdala and other limbic regions. Third, the exclusion of psychiatric disorders in relatives and controls in our study were based on self-report assessments rather than standardized interviews. Fourth, future work should repli-cate and extend these results by examining test-retest prop-erties of the identified subnetwork pattern and investigating the ability of the subnetwork to distinguish relatives and con-trols in independent samples.
Conclusions
Our study provides initial evidence of a visual-limbic subnet-work alteration during emotional face processing that may be a promising intermediate phenotype for schizophrenia. The data presented in the study support the further exploration of this potential connectomic intermediate phenotype in clini-cal and pharmacologic studies.
ARTICLE INFORMATION
Submitted for Publication: December 7, 2015; final
revision received January 17, 2016; accepted January 24, 2016.
Published Online: May 4, 2016.
doi:10.1001/jamapsychiatry.2016.0161.
Author Affiliations: Department of Psychiatry and
Psychotherapy, Central Institute of Mental Health, Medical Faculty Mannheim, University of Heidelberg, Mannheim, Germany (Cao, Schneider, Schäfer, Haddad, Grimm, Otto, Dixson, Tost, Meyer-Lindenberg); Department of Basic Medical Sciences, Neuroscience and Sense Organs, Università degli Studi di Bari “Aldo Moro,” Bari, Italy (Bertolino, Taurisano, Blasi); Biomarkers and Clinical Imaging, Hoffmann-La Roche, Basel, Switzerland (Bertolino); Department of Psychiatry and Psychotherapy, Universitätsmedizin Charité, Berlin, Germany (Walter, Erk, Mohnke, Heinz,
Romanczuk-Seiferth); Institute of Human Genetics, University of Bonn, Bonn, Germany (Mühleisen, Cichon, Noethen); Institute of Neuroscience and Medicine (INM-1), Research Centre Jülich, Jülich, Germany (Mühleisen, Cichon, Noethen); Department of Genomics, Life and Brain Center, University of Bonn, Bonn, Germany (Mühleisen, Cichon, Noethen); Department of Genomic Mathematics, University of Bonn, Bonn, Germany (Mattheisen); Department of Biomedicine, University of Aarhus, Aarhus, Denmark
(Mattheisen); Department of Genetic Epidemiology in Psychiatry, Central Institute of Mental Health,
Medical Faculty Mannheim, University of Heidelberg, Mannheim, Germany (Witt, Rietschel); Department of Biomedicine, University of Basel, Basel, Switzerland (Cichon).
Author Contributions: Drs Cao, Bertolino, Walter,
Tost, and Meyer-Lindenberg contributed equally to this study. Drs Cao and Tost have full access to all the data in the study and take responsibility for the integrity of the data and the accuracy of the data analysis.
Study concept and design: Cao, Walter, Tost,
Meyer-Lindenberg.
Acquisition, analysis, or interpretation of data: Cao,
Bertolino, Walter, Schneider, Schäfer, Taurisano, Blasi, Haddad, Grimm, Otto, Dixson, Erk, Mohnke, Heinz, Romanczuk-Seiferth, Mühleisen, Mattheisen, Witt, Cichon, Noethen, Rietschel, Tost,
Meyer-Lindenberg.
Drafting of the manuscript: Cao, Dixson, Schneider,
Tost.
Critical revision of the manuscript for important intellectual content: Cao, Bertolino, Walter,
Schneider, Schäfer, Taurisano, Blasi, Haddad, Grimm, Otto, Dixson, Erk, Mohnke, Heinz, Romanczuk-Seiferth, Mühleisen, Mattheisen, Witt, Cichon, Noethen, Rietschel, Tost,
Meyer-Lindenberg.
Statistical analysis: Cao, Schäfer, Taurisano, Grimm,
Cichon, Meyer-Lindenberg.
Obtained funding: Walter, Heinz, Noethen,
Rietschel, Tost, Meyer-Lindenberg.
Administrative, technical, or material support:
Walter, Schäfer, Grimm, Heinz,
Romanczuk-Seiferth, Cichon, Rietschel.
Study supervision: Tost, Meyer-Lindenberg. Conflict of Interest Disclosures: Dr Bertolino
reported working as a full-time employee of Hoffmann-La Roche, Basel, Switzerland. Dr Walter reported receiving a speaker honorarium from Servier. Dr Meyer-Lindenberg reported receiving consultant fees from AstraZeneca, Elsevier, F. Hoffmann-La Roche, Gerson Lehrman Group, Lundbeck, Outcome Europe Sárl, Outcome Sciences, Roche Pharma, Servier International, and Thieme Verlag and lecture fees, including travel expenses, from Abbott, AstraZeneca, Aula Médica Congresos, BASF, Boehringer Ingelheim, Groupo Ferrer International, Janssen-Cilag, Lilly Deutschland, LVR Klinikum Düsseldorf, Otsuka Pharmaceuticals, and Servier Deutschland. No other disclosures were reported.
Funding/Support: This study was supported by
IntegraMent grants 01ZX1314G and 01ZX1314B (Drs Meyer-Lindenberg, Walter, and Heinz) and NGFNplus MooDS grants 01GS08144, 01GS08147, and 01GS08148 (Drs Noethen, Cichon, Walter, Rietschel, Meyer-Lindenberg, and Heinz) from the German Federal Ministry of Education and Research and grants 115300 (Project EU-AIMS) (Dr Meyer-Lindenberg), 115008 (Project EU-NEWMEDS) (Dr Meyer-Lindenberg), 602805 (Project
EU-AGGRESSOTYPE) (Dr Meyer-Lindenberg), and 602450 (Project EU-IMAGEMEND) (Dr Meyer-Lindenberg) from the European Community’s Seventh Framework Programme. Dr Tost acknowledges support from grant 01GQ1102 from Research Original Investigation Altered Functional Subnetwork During Emotional Face Processing
604 JAMA Psychiatry June 2016 Volume 73, Number 6 (Reprinted) jamapsychiatry.com
Copyright 2016 American Medical Association. All rights reserved.
Copyright 2016 American Medical Association. All rights reserved. the German Federal Ministry of Education and
Research. Dr Cao is a PhD scholarship awardee of the Chinese Scholarship Council.
Role of the Funder/Sponsor: The funding source
had no role in the design and conduct of the study; collection, management, analysis, and
interpretation of the data; preparation, review, or approval of the manuscript; and the decision to submit the manuscript for publication.
Additional Contributions: Christine Esslinger, MD,
Dagmar Gass, Daniela Mier, PhD, and Carina Sauer, PhD (Central Institute of Mental Health, Manheim Germany), provided research assistance. No compensation was provided.
REFERENCES
1. van Os J, Kapur S. Schizophrenia.Lancet. 2009; 374(9690):635-645.
2. Kring AM, Elis O. Emotion deficits in people with
schizophrenia.Annu Rev Clin Psychol. 2013;9:409-433.
3. Taylor SF, Kang J, Brege IS, Tso IF, Hosanagar A,
Johnson TD. Meta-analysis of functional neuroimaging studies of emotion perception and experience in schizophrenia.Biol Psychiatry. 2012; 71(2):136-145.
4. Anticevic A, Van Snellenberg JX, Cohen RE,
Repovs G, Dowd EC, Barch DM. Amygdala recruitment in schizophrenia in response to aversive emotional material.Schizophr Bull. 2012; 38(3):608-621.
5. Li H, Chan RC, McAlonan GM, Gong QY. Facial
emotion processing in schizophrenia.Schizophr Bull. 2010;36(5):1029-1039.
6. Meyer-Lindenberg A, Weinberger DR.
Intermediate phenotypes and genetic mechanisms of psychiatric disorders.Nat Rev Neurosci. 2006;7 (10):818-827.
7. Rasetti R, Weinberger DR. Intermediate
phenotypes in psychiatric disorders.Curr Opin Genet Dev. 2011;21(3):340-348.
8. Preston GA, Weinberger DR. Intermediate
phenotypes in schizophrenia.Dialogues Clin Neurosci. 2005;7(2):165-179.
9. Cannon TD, Keller MC. Endophenotypes in the
genetic analyses of mental disorders.Annu Rev Clin Psychol. 2006;2:267-290.
10. Cao H, Dixson L, Meyer-Lindenberg A, Tost H.
Functional connectivity measures as schizophrenia intermediate phenotypes: advances, limitations, and future directions.Curr Opin Neurobiol. 2016;36: 7-14.
11. Rasetti R, Sambataro F, Chen Q, Callicott JH,
Mattay VS, Weinberger DR. Altered cortical network dynamics.Arch Gen Psychiatry. 2011;68 (12):1207-1217.
12. Rasetti R, Mattay VS, White MG, et al. Altered
hippocampal-parahippocampal function during stimulus encoding.JAMA Psychiatry. 2014;71(3): 236-247.
13. Erk S, Meyer-Lindenberg A, Schmierer P, et al.
Hippocampal and frontolimbic function as intermediate phenotype for psychosis.Biol Psychiatry. 2014;76(6):466-475.
14. Grimm O, Heinz A, Walter H, et al. Striatal
response to reward anticipation.JAMA Psychiatry. 2014;71(5):531-539.
15. Habel U, Klein M, Shah NJ, et al. Genetic load on
amygdala hypofunction during sadness in nonaffected brothers of schizophrenia patients.Am J Psychiatry. 2004;161(10):1806-1813.
16. Barbour T, Murphy E, Pruitt P, et al. Reduced
intra-amygdala activity to positively valenced faces in adolescent schizophrenia offspring.Schizophr Res. 2010;123(2-3):126-136.
17. van Buuren M, Vink M, Rapcencu AE, Kahn RS.
Exaggerated brain activation during emotion processing in unaffected siblings of patients with schizophrenia.Biol Psychiatry. 2011;70(1):81-87.
18. Rasetti R, Mattay VS, Wiedholz LM, et al.
Evidence that altered amygdala activity in schizophrenia is related to clinical state and not genetic risk.Am J Psychiatry. 2009;166(2):216-225.
19. Liu Y, Liang M, Zhou Y, et al. Disrupted
small-world networks in schizophrenia.Brain. 2008;131(Pt 4):945-961.
20. Fornito A, Yoon J, Zalesky A, Bullmore ET,
Carter CS. General and specific functional connectivity disturbances in first-episode schizophrenia during cognitive control performance.Biol Psychiatry. 2011;70(1):64-72.
21. Lynall ME, Bassett DS, Kerwin R, et al.
Functional connectivity and brain networks in schizophrenia.J Neurosci. 2010;30(28):9477-9487.
22. Alexander-Bloch AF, Gogtay N, Meunier D, et al.
Disrupted modularity and local connectivity of brain functional networks in childhood-onset
schizophrenia.Front Syst Neurosci. 2010;4:147.
23. Smit DJ, Stam CJ, Posthuma D, Boomsma DI, de
Geus EJ. Heritability of “small-world” networks in the brain.Hum Brain Mapp. 2008;29(12):1368-1378.
24. Fornito A, Zalesky A, Bassett DS, et al. Genetic
influences on cost-efficient organization of human cortical functional networks.J Neurosci. 2011;31(9): 3261-3270.
25. Hariri AR, Tessitore A, Mattay VS, Fera F,
Weinberger DR. The amygdala response to emotional stimuli.Neuroimage. 2002;17(1):317-323.
26. Diwadkar VA, Wadehra S, Pruitt P, et al.
Disordered corticolimbic interactions during affective processing in children and adolescents at risk for schizophrenia revealed by functional magnetic resonance imaging and dynamic causal modeling.Arch Gen Psychiatry. 2012;69(3):231-242.
27. Pezawas L, Meyer-Lindenberg A, Drabant EM,
et al. 5-HTTLPR polymorphism impacts human cingulate-amygdala interactions.Nat Neurosci. 2005;8(6):828-834.
28. Tost H, Kolachana B, Hakimi S, et al. A common
allele in the oxytocin receptor gene (OXTR) impacts prosocial temperament and human
hypothalamic-limbic structure and function.Proc Natl Acad Sci U S A. 2010;107(31):13936-13941.
29. Ekman P, Friesen WV. Pictures of Facial Affect.
Palo Alto, CA: Consulting Psychologist Press; 1976.
30. Plichta MM, Schwarz AJ, Grimm O, et al.
Test-retest reliability of evoked BOLD signals from a cognitive-emotive fMRI test battery.Neuroimage. 2012;60(3):1746-1758.
31. Cao H, Plichta MM, Schäfer A, et al. Test-retest
reliability of fMRI-based graph theoretical properties during working memory, emotion processing, and resting state.Neuroimage. 2014; 84:888-900.
32. Yan CG, Cheung B, Kelly C, et al.
A comprehensive assessment of regional variation in the impact of head micromovements on functional connectomics.Neuroimage. 2013;76: 183-201.
33. Friedman L, Glover GH. Report on a multicenter
fMRI quality assurance protocol.J Magn Reson Imaging. 2006;23(6):827-839.
34. Simmons A, Moore E, Williams SC. Quality
control for functional magnetic resonance imaging using automated data analysis and Shewhart charting.Magn Reson Med. 1999;41(6):1274-1278.
35. Weisskoff RM. Simple measurement of scanner
stability for functional NMR imaging of activation in the brain.Magn Reson Med. 1996;36(4):643-645.
36. Tzourio-Mazoyer N, Landeau B,
Papathanassiou D, et al. Automated anatomical labeling of activations in SPM using a macroscopic anatomical parcellation of the MNI MRI single-subject brain.Neuroimage. 2002;15(1):273-289.
37. Zalesky A, Fornito A, Bullmore ET.
Network-based statistic.Neuroimage. 2010;53(4): 1197-1207.
38. Zalesky A, Cocchi L, Fornito A, Murray MM,
Bullmore E. Connectivity differences in brain networks.Neuroimage. 2012;60(2):1055-1062.
39. Blasi G, Popolizio T, Taurisano P, et al. Changes
in prefrontal and amygdala activity during olanzapine treatment in schizophrenia.Psychiatry Res. 2009;173(1):31-38.
40. Cicchetti DV, Sparrow SA. Developing criteria
for establishing interrater reliability of specific items.Am J Ment Defic. 1981;86(2):127-137.
41. Cohen J. Statistical Power Analysis for the Behavioral Sciences. Mahwah, NJ: Lawrence Erlbaum
Associates; 1988.
42. Phillips ML, Drevets WC, Rauch SL, Lane R.
Neurobiology of emotion perception I.Biol Psychiatry. 2003;54(5):504-514.
43. Phillips ML, Drevets WC, Rauch SL, Lane R.
Neurobiology of emotion perception II.Biol Psychiatry. 2003;54(5):515-528.
44. Damasio AR. Toward a neurobiology of
emotion and feeling. Neuroscientist. 1995;1(1):19-25.
45. Power JD, Barnes KA, Snyder AZ, Schlaggar BL,
Petersen SE. Spurious but systematic correlations in functional connectivity MRI networks arise from subject motion.Neuroimage. 2012;59(3):2142-2154.
46. Van Dijk KR, Sabuncu MR, Buckner RL. The
influence of head motion on intrinsic functional connectivity MRI.Neuroimage. 2012;59(1):431-438.
47. Wright IC, Rabe-Hesketh S, Woodruff PW,
David AS, Murray RM, Bullmore ET. Meta-analysis of regional brain volumes in schizophrenia.Am J Psychiatry. 2000;157(1):16-25.
48. Steen RG, Mull C, McClure R, Hamer RM,
Lieberman JA. Brain volume in first-episode schizophrenia.Br J Psychiatry. 2006;188:510-518.
49. Haijma SV, Van Haren N, Cahn W, Koolschijn
PC, Hulshoff Pol HE, Kahn RS. Brain volumes in schizophrenia.Schizophr Bull. 2013;39(5):1129-1138.
50. Achard S, Salvador R, Whitcher B, Suckling J,
Bullmore E. A resilient, low-frequency, small-world human brain functional network with highly connected association cortical hubs.J Neurosci. 2006;26(1):63-72.
Altered Functional Subnetwork During Emotional Face Processing Original Investigation Research
jamapsychiatry.com (Reprinted) JAMA Psychiatry June 2016 Volume 73, Number 6 605
Copyright 2016 American Medical Association. All rights reserved.
© 2016 American Medical Association. All rights reserved.
Supplementary Online Content
Cao H, Bertolino A, Walter H, et al. Altered funcgtional subnetwork during emotion face
processing: a potential intermediate phenotype for schizophrenia. JAMA Psychiatry.
Published online May 4, 2016. doi:10.1001/jamapsychiatry.2016.0161.
eMethods
eFigure 1. Global Network Properties for the Two Compared Groups
eFigure 2. Mean Gray Matter Volume of Brain Nodes in the Identified Visual-Limbic
Network
eTable. Details of the Nodes and Links in the Identified Subnetwork During Emotion
Processing
eReferences
This supplementary material has been provided by the authors to give readers additional information about their work.
© 2016 American Medical Association. All rights reserved.
eMethods
Identification of a potential connectomic intermediate phenotype Sample characteristics and psychological assessments
Functional network alterations related to the genetic risk for schizophrenia were examined in 58 unaffected degree relatives of schizophrenia patients and 94 healthy controls without a first-degree relative with mental illness. All individuals were of European ancestry. Exclusion criteria included a lifetime history of significant general medical, psychiatric or neurological illness, prior drug or alcohol abuse, and head trauma. The psychiatric diagnoses of the index patients were established by psychiatrists according to the Structured Clinical Interview for Diagnostic and Statistical Manual of Mental Disorders. The recruited relatives were asked to provide official documents signed by psychiatrists which confirmed that they had a first-degree relative with schizophrenia. The first-degree relatives consisted of different generations including siblings, parents and children of the index patients (22 siblings, 10 parents, 24 children, with 4 subjects age < 20 years). All subjects were evaluated by a battery of clinical and psychological assessments for the exclusion of overt mental illness. Clinical assessments included the Symptom Checklist-90 Revised (SCL-Checklist-90-R) 1, the Schizotypal Personality Questionnaire (SPQ) 2 and Beck
Depression Inventory (BDI) 3. Intelligence was tested by the Matrix Reasoning subscale of Wechsler Adult Intelligence Scale (WAIS-MR) 4. Personality and emotion regulation were tested by using the NEO Five Factor Inventory (NEO-FFI) 5, the State-trait Anxiety Inventory (STAI) 6 and the Emotion Regulation Questionnaire (ERQ) 7. Stressful life events were quantified using the modified Social Readjustment Rating Scale (SRRS) 8, with the assessment for the past two years instead of the original one year. Both groups were well balanced for a broad range of variables including demographics, head motion, image quality, task performances, and psychological measures (all P values > 0.10, see Table 1 in the main manuscript for details). MRI data acquisition
Magnetic resonance imaging data were acquired in Mannheim, Bonn and Berlin using three identical 3-Tesla MR scanners (Siemens Trio, Erlangen, Germany) and identical scanner
protocols. Functional data were acquired with gradient-recalled echo-planar imaging (GRE-EPI) sequences with the parameters TR 2000 ms, TE 30 ms, 28 oblique slices (descending acquisition) per volume, 4 mm slice thickness, 1 mm slice distance, 80° flip angle, 192 mm FOV, and 64 × 64 matrix. High-resolution structural data were acquired by using 3D magnetization-prepared rapid gradient-echo (MP-RAGE) sequences with the parameters TR 1570 ms, TE 2.75 ms, TI 800 ms, 176 sagittal slices, 1 mm slice thickness, 256 mm FOV, and 15° flip angle.
Image quality control
© 2016 American Medical Association. All rights reserved.
Head motion parameters were quantified as previously detailed 9-12 and included the sum of volume-to-volume translational excursions across the time series, the sum of volume-to-volume rotational excursions across the time series, and the mean voxel-based frame-wise displacement. The first measures calculate the sum of the root mean square of the three translational and rotational motion vectors from the x, y, and z axes. The third measure is a nonlinear combination of the volume-wise translations and rotations and reflects the mean voxel-specific distance relative to the previous image. The signal-to-noise ratio of images was calculated using the NYU CBI dataQuality toolbox (http://cbi.nyu.edu/software/dataQuality.php). Here, signal is defined as the mean voxel intensity of a given ROI in the brain, and noise is defined as the standard
deviation of the voxel intensities of a given ROI in the background. For more details, please refer to previous studies 13-15.
Face processing and resting state tasks
The face-matching task used in this study is presented in eight blocks of six trials (or 30 s) each with alternating epochs of face- and form-matching conditions (task duration: 4.3 min or 130 whole-brain scans). During the five minutes (or 150 whole-brain scans) resting state task, participants are instructed to close their eyes, relax, and refrain from specific mental activities. Afterwards, investigators verified with the participants that they had not fallen asleep during the scan.
Emotion processing: activation and seeded connectivity analyses Data preprocessing
For image preprocessing we followed standard routines of the Statistical Parametric Mapping software (SPM8, http://www.fil.ion.ucl.ac.uk/spm/software/spm8/). Briefly, this included the realignment to the first image of the scan, slice time correction, spatial normalization to the Montreal Neurological Institute (MNI) space with resampling to 3 × 3 × 3 mm3 voxels, and smoothing with a 9 mm full-width at half-maximum (FWHM) Gaussian kernel.
Amygdala activation analysis
Since we aimed for a replication of two previously reported negative findings with this task, the amygdala activation and seeded connectivity analyses of the face-matching task closely followed the procedures described in Rasetti et al 16. For the activation analysis, the preprocessed images were analyzed in a two-level procedure. At the first level, general linear models (GLM) were defined for each subject that included the boxcar reference vectors for the task conditions (convolved with the standard SPM hemodynamic response function) and the six head motion parameters from the realignment step (as covariates of non-interest). During model estimation the data were high-pass filtered (cut-off 128 seconds) and individual maps of the “face-matching >
form-matching” contrast were computed. The contrast images were used for a second-level
© 2016 American Medical Association. All rights reserved.
random effects analysis with group (relatives vs. controls) as variable of interest and age, sex, and site as nuisance covariates. Significance was measured at P < 0.05 family-wise error (FWE) corrected across an a priori defined anatomical mask of the bilateral amygdala from the Automated Anatomical Labeling (AAL) atlas 17.
Amygdala seeded functional connectivity analysis
Individual first-level GLMs of the seed-based connectivity analysis included the mean time series of the amygdala as regressor of interest (extracted using the bilateral AAL amygdala mask), and the following nuisance regressors: the six head motion parameters from the realignment step, the mean time series derived from cerebrospinal fluid (CSF) and white matter (WM) masks, and two regressors encoding for the task conditions. During model estimation the data were high-pass filtered (cut-off 128 seconds). The resulting statistical parametric connectivity maps were used for a second-level random effects group analysis as described above. Significance was measured at P < 0.05 FWE corrected across the bilateral ACC mask from the AAL atlas.
Emotion processing: brain functional network analyses Construction of connectivity matrices
Following the procedures of our previous study (Method M2 in the reference paper) 11, we extracted the mean task time series for each of the 90 nodes defined by the AAL atlas. The time series were corrected for task conditions, WM and CSF signals, and the six head motion parameters, and were high-pass filtered (cut-off 128 seconds). For the construction of brain networks, we computed pairwise Pearson correlation coefficients between the processed time series of each node, which resulted in a 90 × 90 two-dimensional correlation matrix for each subject.
Calculation and analysis of global graph properties
We used two different methodological approaches for the analyses of the functional connectivity matrices. At the global level, the matrices were thresholded in 1% intervals over a range of 31 densities from 10% to 40% where, for example, in the 10% thresholded matrix the top 10% of the highest positive correlations are represented as internode connections. We selected this density range based on our previous study with the same task and analysis method which shows that small-world networks are present in this range 11. We calculated four commonly used global properties for each of the densities: smallworldness (a measure of combination of large clustering coefficient (i.e. high segregation) and short path length (i.e. high integration)), modularity (the degree to which the network can be divided into non-overlapping modules), global efficiency (a measure of the efficiency of the whole network as quantified by the average inverse shortest path length) and characteristic path length (the average path length between all pairs of nodes in the network). For the detailed definition and calculation of these properties, please refer to past reviews 18,19. The computation for smallworldness and modularity were based on 100 times
© 2016 American Medical Association. All rights reserved.
network randomizations. We chose these specific properties since prior evidence suggest that they are heritable 20,21, and abnormalities in these measures have been repeatedly observed in schizophrenia 22-25. For statistical inference, repeated measures analysis of covariates (ANCOVA) models were used with densities as within-subject factor and group (relatives vs. controls) as between-subject factor, and age, sex, site, and mean head motion frame-wise displacement (FD) as covariates of non-interest.
Network-based statistic (NBS)
At the local level, network-based statistic (NBS) was used to identify clusters of functional links that are altered in the relatives group compared to the controls. NBS is a method to effectively control cluster-level family-wise error (FWE) for link-wise matrical comparisons and offers a larger power than mass-univariate tests on independent links. For details on this method, please refer to Zalesky et al 26,27. Consistent with prior studies 23,26-28, we applied initial t-tests
(contrasting relatives and controls) to each of the N(N-1)/2 = 4005 (N = 90) links in the
connectivity matrices, while controlling for age, sex, site and FD. This generated a P-value matrix representing the probability of accepting the null hypothesis for each link. All links with P values < 0.0005 were then thresholded into a set of suprathreshold links 28, and connected clusters within this set were identified by breadth first search 29. The significance of the identified clusters was tested by permutation testing, where the subjects were randomly reallocated into one of the two groups and the maximal size of the identified cluster was recalculated during each of the 5000 permutations. The corrected P value for the cluster was determined by the proportion of the derived cluster sizes in the permutation distribution that were larger than the observed group difference.
Follow-up analyses
Rationale for the follow-up supplemental analyses
Subsequent to the identification of the visual-limbic subnetwork abnormalities during emotion processing in the first-degree relatives of schizophrenia patients, we performed four post-hoc supplemental analyses to further validate the identified connectomic phenotype: 1) An analysis to investigate potential association between the subnetwork connectivity measures and trait anxiety scores, 2) An analysis to establish the test-retest reliability of the connectivity estimates during emotion processing in the identified visual-limbic subnetwork, 3) An analysis probing the specificity of the visual-limbic alterations by examining the same connectivity measure during resting state, and 4) An analysis probing the influence of potential structural confounds by quantifying the grey matter volumes and structural covariance of the identified subnetwork nodes in the first-degree relatives compared to the controls. In analyses 1-3 we reduced data
dimensionality by averaging the connectivity estimates of all links in the identified visual-limbic
© 2016 American Medical Association. All rights reserved.
cluster and condensed them into subject-specific univariate metrics that were then subjected to between-group comparisons. We chose this strategy to increase the sensitivity of these analyses and to stay consistent with the NBS method per se, which treats the whole cluster as an entity for which the null hypothesis can only be rejected at the cluster level 26. For the very same reason, in analysis 4), the mean grey matter volumes of the nodes in the identified visual-limbic cluster were condensed into subject-specific univariate metric (i.e., mean grey matter volume of the cluster nodes) for subsequent between-group volumetric analysis.
Since for methodological reasons, NBS findings can only be interpreted at the cluster level, we chose the cluster outcome of the comparison of relatives and controls as a starting point for subsequent analyses since the reverse strategy (i.e., the comparison of controls and patients as a starting point) would plausibly yield link-wise differences that relate to medication influences rather genetic predisposition, which would complicate our validation efforts and contradict the basic goal of this study.
Correlation between subnetwork connectivity and trait anxiety
Trait anxiety is an important assessment of emotion stability and may plausibly relate to the identified subnetwork connectivity phenotype. Here, we calculated the Spearman rank correlation between the mean subnetwork connectivity estimates and trait anxiety scores derived from the State-trait Anxiety Inventory (STAI). This correlation was only tested in the control group. Additional analyses showed that no significant correlation was found in relatives or in a combined sample, suggesting an independent replication is necessary to guard a type I error.
Test-retest reliability analysis of visual-limbic connectivity estimates
We have previously reported fair to good reliabilities for whole-brain connectivity estimates during emotional processing 11. However, it is unclear whether this observation generalizes to the specific visual-limbic subnetwork identified in this study. To probe this question, we reanalyzed the test-retest data from our prior study in which 26 healthy subjects were scanned twice with the same emotional face-matching task within two consecutive weeks (mean time interval: 14.6 ± 2.1 days, mean age: 24.4 ± 2.8 years, 15 females, see Cao et al. 11 for further details). The
preprocessing and network constructions followed the procedures described above, and the mean connectivity estimates of the identified visual-limbic subnetwork were extracted for each subject and measurement time point. Consistent with our previous studies 9,11, intra-class correlation coefficients (ICCs) were calculated to quantify reliability, namely, ICC(2,1) and ICC(3,1) according to the formula
ICC(2,1) = (BMS-EMS) / (BMS + (k-1)EMS + k(JMS-EMS)/n) ICC(3,1) = (BMS-EMS) / (BMS + (k-1)EMS)
© 2016 American Medical Association. All rights reserved.
where BMS is the between-subject mean square, EMS is the residual mean square, JMS is the between-session mean square, n is the number of subjects, and k is the number of sessions. These coefficients reflect the absolute agreement and relative consistency of measurements between sessions 30,31.
Visual-limbic resting state analysis
The vast majority of the relatives and controls (150 out of 152, 58 relatives and 92 controls) also participated in a five minutes resting-state fMRI experiment. This allowed us to examine the second question relevant to the utility of the observed visual-limbic subnetwork alterations: Whether the alterations in the relatives group are specific to emotion processing or a fundamental feature of the functional organization of brain networks in general. With the exception of a different band-pass setting (0.008 - 0.1Hz ) the preprocessing of the resting state data, node definition, and the construction of connectivity matrices followed the same procedures as those described for the emotional face-matching task. To test for group-dependent differences and group by task interactions, we extracted the mean connectivity estimates of the identified visual-limbic subnetwork links from the resting-state connectivity matrices and entered those as the dependent variable into a repeated-measures ANCOVA model. In this model, the tasks (i.e., emotional task, resting state) were included as within-subject factor and group (i.e., relatives, controls) were included as between-subject factor. Age, sex, site, and FD were included as covariates of non-interest. Significance was measured at P < 0.05.
Visual-limbic morphometry and structural covariance analysis
We acquired high-resolution structural images from the vast majority of the participants (58 relatives and 93 controls). The investigation of potential structural confounds followed a two-step procedure. First, we subjected the T1-weighted images to voxel-based morphometry (VBM8, http://dbm.neuro.uni-jena.de/vbm8/) 32 to calculate voxel-wise grey matter volumes for each subject. Briefly, this included tissue classification, spatial normalization to MNI space with a diffeomorphic image registration algorithm (DARTEL), correction for image intensity non-uniformity, correction for global brain grey matter volume, and smoothing with a 10 mm FWHM Gaussian kernel. We then extracted the grey matter volumes for each of the identified subnetwork nodes, averaged the volumes for each subject, and entered the values as dependent variable into an ANCOVA model that included group (relatives vs. controls) as variable of interest, and age, sex, site and FD as nuisance covariates. In addition, we constructed group-specific structural covariance matrices by computing pair-wise Pearson correlations of the grey matter volumes of the identified nodes across all subjects in that group. Following previously published procedures
33
, significant differences of the structural covariance matrices between relatives and controls were calculated by permutation testing (5000 times), where in each permutation, the subjects were randomly reallocated into one of the two groups and the deviations of each entry in the
© 2016 American Medical Association. All rights reserved.
covariance matrices were recalculated. P values for each entry were derived as the proportion of the deviations of each entry in the permutation distribution that were larger than the observed group difference. Afterwards, FWE correction was used to control for the false positive rate of the multiple comparisons of entries in the matrices.
Association of the identified phenotype with schizophrenia
Sample characteristics
While the examination of patient populations often bears the limitation of a potential medication-related confounding of fMRI data, the demonstration of comparable abnormalities in
schizophrenia is an important piece of evidence for the clinical validation of the proposed intermediate phenotype. We tested this question in an independent sample with 31 schizophrenia patients (age 30.58 ± 7.05 years, 7 females) and 45 healthy controls (age 32.00 ± 9.50 years, 19 females) recruited from psychiatric hospitals and communities in and around Mannheim,
Germany and Bari, Italy. The two groups were balanced for age, sex, site, and task performances (all P values > 0.08, see Table 2). The schizophrenia patients were diagnosed according to the Structured Clinical Interview for Diagnostic and Statistical Manual of Mental Disorders (DSM-IV) and were under stable anti-psychotic medications. The healthy controls were recruited after the exclusion of a lifetime history of significant general medical, psychiatric or neurological illness, prior drug or alcohol abuse, head trauma, and the presence of a first-degree relative with a history of psychiatric illness. All the subjects provided written informed consent for a protocol approved by the institutional review board of the Universities of Heidelberg and Bari.
MRI data acquisition
fMRI data of the subjects from Mannheim used the same sequence as reported above in the relatives study, while the data of the subjects from Bari were acquired on a GE Signa 3 Tesla scanner (Milwaukee, Wisconsin) with GRE-EPI sequence and the following sequence parameters: TR 3000 ms, TE 30 ms, 24 oblique slices per volume, 5 mm slice thickness, no distance factor, 240 mm FOV, 64 × 64 matrix.
Emotion processing task
The subjects from Mannheim participated in the same face-matching task as described above. The blocked-design emotion processing task acquired in Bari is a similar but extended version of the emotion processing task that has been used for the relatives- and imaging genetics studies in this work. Briefly, in addition to the face-matching and form-matching conditions described above, the task includes a third experimental condition challenging explicit emotion processing (face-labelling). In this condition, subjects were asked to label emotional target faces depicting fearful