SET
BOLOGNA
2017
Analysis of combustion conditions for CO and PM
emissions in wood pellet stoves
An experimental study
Luigi
F.
P
OLONINI1,
Domenico
P
ETROCELLI2,
Simone P. P
ARMIGIANI2, Adriano
M.
L
EZZI11 Dipartimento di Ingegneria Meccanica ed Industriale, Università degli Studi di Brescia,
via Branze 38, 25123 Brescia, [email protected]
2 AICO SpA, Via Kupfer 31, 25036 Palazzolo sull’Oglio BS, [email protected]
As pointed out by recent World Health Organization reports, aerosols are the cause of many diseases and premature death and the issue of reducing their production is receiving more and more attention. Besides, concern about greenhouse effect, caused also by the intense exploitation of fossil fuels, is shifting interest towards biomass fuels which have nominally zero-net emissions of greenhouse gases. Unfortunately, a poor exploitation of biomass can cause a significant generation of pollutant and particle emissions and consequently it is important to identify factors that control particulate matters (PM) in order to reduce them.
In this study, an extensive set of experiments on four wood pellet stoves (8-11 kW burning power) has been performed to investigate the relations between the main operation parameters of the stove and its emissions, in particular, carbon monoxide (CO) and PM emissions are correlated to the burning-pot geometry.
Furthermore, a new burning-pot model which allows to obtain very-low CO emissions is presented. As a matter of fact for optimal inlet air quantities, CO emissions can be reduced close to zero. At the same time, however, PM emissions are reduced but not as much as those of CO. This phenomenon is caused by PM composition that is composed of both organic – related to combustion quality and, as consequence, to CO levels – and inorganic matter.
Experiments show also an increment of PM emissions and a wide range of PM colours deposited on filters during tests with the innovative burning-pot: there is an apparent dependence of PM release on the time from ignition. It’s likely that this effect is due to ashes accumulation on the bottom of the burning pot and to their interaction with the primary air stream that flows over them.
1. INTRODUCTION
Nowadays concern about the greenhouse effect, caused also by the intense exploitation of fossil fuels, is shifting interest towards biomass fuels which have nominally zero-net emissions of greenhouse gases: generation of heat and power from biomass sources is becoming an important element of the energy scenario that will characterize the next years. Unfortunately, a poor exploitation of biomass can cause a significant generation of pollutant and particle emissions. It is generally acknowledged that aerosols are the cause of many diseases and premature death (Prüss-Ustün, 2016; WHO, 2016), hence the problem of analyzing and reducing aerosols produced by biomass fueled appliances is receiving increasing attention. In particular, it is becoming more and more important to identify which factors control and influence the emission of pollutants and particulate matters (PM) and how to reduce them. Limits of emissions in international and national regulations are becoming more restrictive. Within the framework set by the EU Ecodesign Directive (EU, 2009), for example, limit of PM emission for pellet stoves has been fixed to 20 mg/Nm3. This value will be enforced starting on January 1, 2022. In Italy, the public subsidies given to substitute an old heating appliance with a new, efficient one are defined by "Conto Termico 2.0" (MiSE, 2016) and are based on a classification that considers PM emission: for example, the upper limit for the best class is 15 mg/Nm3 for pellet stoves and 10 mg/Nm3 for pellet boilers.
On one hand, it is clear that the need for high efficiency and non-polluting devices that use renewable energy sources is becoming more important, both for the electricity generation and for the direct heating of spaces. On the other hand, manufacturers need clear and long term indications to plan the development of low emission appliances. An overview on emissions due to biomass combustion can be found in several papers (Brunner, 2009; Fernandes, 2013; Keeley, 2008; Petrocelli, 2014). The flue gases downstream of an ideal combustion are nitrogen (N2), oxygen
(O2), carbon dioxide (CO2) and water vapor (H2O), but in real combustion conditions several other components are
present: carbon monoxide (CO), nitrogen oxides (NO and NO2), hydrogen (H2), hydrocarbons (HC), poly-cyclic
aromatic hydrocarbons (PAHs), besides particulate matter (PM). In (Petrocelli, 2014) the effect of air excess on woody pellets combustion is analyzed: taking into consideration CO emissions, it is shown that for each stove exists an O2 concentration in the flue gas – hence an equivalent air excess – that minimizes CO generation. In (Brunner,
2009) stoves efficiency is analyzed: in particular, it is shown that maximum efficiency is obtained for an O2
concentration which is lower than the value that minimizes CO production, therefore a trade-off must be looked for between efficiency and CO emissions.
In addition to the O2 content effect, also the effect of the ratio between primary and secondary air is analyzed
(Brunner, 2009; Petrocelli, 2014): in order to reduce NOx emissions primary air has to be reduced as much as possible, even under stoichiometric air ratio; at the same time its residence time in the combustion chamber has to grow as much as possible; secondary air, instead, increases turbulence of gases in the combustion chamber promoting oxidation of CO and HC.
Aerosol formation processes are investigated also in several papers (Brunner, 2005; Wiinikka and Gebart, 2005; Wiinikka, 2006). In these studies theoretical models to explain how particles nucleate and how they change as a function of temperature is presented. Besides, information are given about chemical composition of PM in the flue gas. Different studies demonstrate that particle size from woody pellets combustion is mostly submicron with concentration peaks around 0,1 µm and 0,9 µm (El May, 2012; Wiinikka, 2005; Zellagui, 2017), composed by inorganic compounds of potassium, chlorine, nitrogen, calcium, magnesium and phosphorus – ash particles – and by soot from incomplete combustion (Fernandes, 2013).
The combustion of pellet has been studied with numerical approaches too: in (Costa, 2014) is presented a numerical model to simulate biomass combustion which consider two distinct phases (a drying phase and a combustion phase); in (Janajreh, 2013) is illustrated a numerical model that describe combustion taking into consideration the different zones of the combustion chamber.
This paper reports the preliminary results of a collaboration between AICO SpA and the University of Brescia aimed to reduce PM emissions of pellet stoves and boilers manufactured by AICO improving the combustion conditions. Reported particle concentration measurements range between 8 and 43 mg/Nm3, approximately. Under poor combustion conditions the soot component dominates and significant PM reduction can be obtained improving the combustion process. The inorganic component is expected to be relatively independent on combustion quality. Based on these considerations, the first goal of the research project was identified in verifying how much PM emission can be reduced upon improving the combustion.
To this end a campaign of experimental tests on currently produced stove models and on improved new ones was undertaken in order to investigate the relations between the main operation parameters of the stoves and their emissions. In particular, to identify the appliances settings that optimize combustion in terms of efficiency and
minimum CO production and then to verify whether this optimal configuration does minimize PM emissions as well. In addition, improvements were looked for, acting on burning pot geometry and air distribution.
Experimental tests reported here were carried out on four models of pellet stove: the four stoves had the same design and differed only in burning power and type of burning pot. Two stoves, A1 (8 kW) and A2 (11 kW), were equipped with a traditional burning pot, while the other two, B1 (8 kW) and B2 (10 kW), were equipped with a new burning pot model.
Tests point out that with the new burning pot, CO emissions can be cut down dramatically and, at the same time, the improved combustion reduces significantly PM. However, there is an apparent dependence of PM release from the time past from ignition. As time goes by PM emissions tend to increase. It's likely that this is a fluid mechanical effect caused by ashes accumulation on the bottom of the burning pot and by their interaction with the primary air stream that flows over them.
2. MATERIALS AND METHODS 2.1. Burning pot and stove models
The experimental data reported in this paper have been collected at AICO Testing Lab during the development of new pellet stove models. In particular, four stoves will be considered here, quite similar in design and burning power. The main difference among them is the type of burning pot mounted. Two types (denoted A and B) are tested that generate very different combustion conditions when the stoves are in operation.
The first two stoves tested will be denoted A1 and A2. They have burning power of 8 kW and 11 kW, respectively. They are equipped with a "traditional" burning pot.
The other two stoves, B1 and B2, have a nominal power of 8 kW and 10 kW, respectively. A "new" burning pot, recently developed and patented by AICO (AICO, 2016), is mounted in them.
Burning pot type A (mounted in stoves A1 and A2) is commonly adopted by most pellet stove manufacturers. Primary air enters through an array of holes on the bottom and then passes through the bed of embers and feeds the combustion. Secondary air is supplied from holes in the upper part of the burning pot walls and impinges directly on the flame. The relative proportion between primary and secondary air is not controlled directly. When ashes accumulate on the bottom of the pot partially obstructing or blocking the primary air flow, the amount of secondary air increases. A picture of this type of burning pot is shown in Figure 1 on the left.
Stoves B1 and B2 are equipped with an innovative burning pot model developed by AICO. A detailed description of this model can be found elsewhere (AICO, 2016), here we give only a brief description. It consists in a rectangular solid base: primary air is supplied through a meandering slit between the base and the sidewall. This air flow does not pass through the bed of embers, but along/over its side and upper surface. Secondary air is supplied at the top of the burning pot: it passes through several holes (not shown in Figure 1) and impinges on the flame. In this stove also primary and secondary air flow rates are not directly controlled. Ashes accumulation should not obstruct the primary air flow, therefore the relative proportion between primary and secondary air flow rate is expected to remain constant while the stove is in operation. A picture of this burning pot model is shown in Figure 1 on the right.
In all tests the same batch of pellet has been used: its quality is ENPLUS A1 (EN ISO 17225: 2015). Elemental concentrations and heating value are specified in Table 1.
2.2. Experimental setup and testing procedure
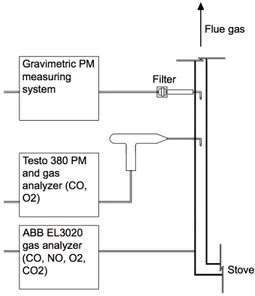
For all tests reported here we used the experimental setup and procedure proposed by the standards (EN 13284-1: 2001; EN 13240+A2: 2004; EN 14785: 2006) and used by other authors (Brunner, 2013; Fernandes, 2013; Petrocelli, 2014; Wiinikka, 2006). The whole stove, including the hopper, is put on a platform scale in order to measure the burning rate. The composition of flue gas is measured at the flue gas socket.
Each stove required a few days of testing (that will be denoted as "test sessions"). A regular test session started in the morning with the stove ignition and the operation parameters already set: the burning pot, in particular, was empty since all the residuals from the previous session were removed. After about one hour from ignition, combustion reaches quasi-steady conditions, detected upon monitoring the flue gases temperature. At this point a sequence of tests was performed. Each test lasted 30 minutes, while the time lag between two consecutive tests varied from 15 to 30 minutes approximately. Operation conditions during a test session were kept the same. At the end of the test session (extinguishing stage) pellet feeding was switched off and combustion air flow rate was increased to burn quickly what was left in the burning pot. This stage lasted 15 minutes, approximately.
Figure 1: Traditional burning pot, adopted in stoves A1 and A2 (left); innovative burning pot, adopted in stoves B1 and B2 (right) Table 1: Characteristics of pellet adopted during tests on wet basis
Element Concentration (%) Carbon (C) 48,12 Hydrogen (H) 5,70 Oxygen (O) 39,80 Nitrogen (N) 0,11 Water (W) 6,00 Ash 0,18
Low Heating Value (HLV) 17371 kJ/kg
During a test CO2, O2, CO, NO, and PM were measured and recorded every 5 seconds. At the end, average values
over the 30 minutes test were computed. At the same time, PM was also collected by a filter – gravimetric method: the sampling time being 30 minutes, i.e. the test duration. Time lag between two tests was necessary to replace the filter and calibrate the instrument.
The gas analyzers used are ABB EL3020 and Testo 380, equipped with cells to measure the concentration (volume fraction) of O2, CO, NO and PM in dry gas, i.e. the flue gas without H2O. Measurement accuracy is the following.
• O2: ±0,2% for both ABB EL3020 and Testo 380;
• CO: ±10 ppm when concentration is below 100 ppm; ±5% of reading, otherwise for Testo 380 and ±2 ppm for ABB EL3020;
• PM: ±0,1 mg/Nm3 for Testo 380.
The quartz fibre filter adopted has a retention efficiency of 99,998% of the particulate with 0,3 µm diameter. The balance adopted for measuring PM weight deposited on the filter has an accuracy of 0,1 mg.
A schematic sketch of PM and flue gas sampling system used in this study is explained in Figure 2. All measurements were conducted at the end of thermal transient.
In order to make a proper comparison of results, CO and PM are normalized at the same concentration of O2, using
the relation Xref = X (21 – O2,ref) / (21 – O2) (see EN 14785: 2006). Where X is the actual (averaged or instantaneous)
concentration of CO or PM in mg/Nm3, O2 the actual (averaged or instantaneous) concentration of O2 in %. O2,ref, the
reference concentration of oxygen, here 13%, and Xref, the concentration of CO or PM at reference conditions, in
mg/Nm3. All data shown in Figures are normalized.
3. RESULTS AND DISCUSSION
3.1. Comparison of emissions from different burning pots
The stoves tested have different behaviours and different performances in term of particulate emissions, in particular between stoves with different burning pot models.
In tests performed on stoves A1 and A2, average PM emissions are in a range between 22 and 43 mg/Nm3, average CO emissions are in a range between 77 and 165 mg/Nm3. Average O2 concentrations are in a range between 8,4%
and 10,9%. In tests performed with the stove A2, average PM emissions are in a range between 16 and 23 mg/Nm3, average CO emissions are in a range between 62 and 120 mg/Nm3. Average O2 concentrations are in a range
between 8,6% and 10,1%.
In tests performed on stove B1, average PM emissions are in a range between 11 and 23 mg/Nm3, average CO emissions are in a range between 5 and 115 mg/Nm3, with most of data under 10 mg/Nm3. Average O2
concentrations are in a range between 5,5% and 9,7%. In tests performed on stove B2, average PM emissions are in a range between 9 and 18 mg/Nm3, average CO emissions are in a range between 5 and 50 mg/Nm3, with most of data under 15 mg/Nm3. Average O concentrations are in a range between 7,4% and 12,1%.
Figure 2: Sketch of PM and flue gas sampling system
Results of stoves B1 and B2 exhibited a strong decrement of CO emissions compared with the stoves A1 and A2, from average value of 117 mg/Nm3 to average value of 17 mg/Nm3. At the same time, a decrement of PM released with the two stoves, from average value of 26 mg/Nm3 to average value of 13 mg/Nm3. A correlation between PM and CO emissions is demonstrated when the combustion change from non-ideal combustion with semi-high CO emissions to a quasi-ideal combustion with quasi-zero CO emissions with a strong decrement of PM emissions. These results are reported in Figure 3, where average levels of PM, CO and O2 are shown for all tests performed with
the different stoves.
3.2. Time dependence of PM emissions
Results presented in Section 3.1 show that the two types of stove release very different amount of pollutants. We explain this difference especially in terms of different combustion dynamics and air-pellet-ash interaction in the two types of burning pot.
In stoves A1 and A2, primary air enters from the bottom grid and passes directly through embers and pellets. Its mass flow rate is higher than the flow rate of secondary air. With this type of burning pot is not possible to increase the ratio secondary/primary air beyond a certain limit, because a minimum flow rate from the bottom grid is necessary to avoid accumulation of unburnt material and ashes in the burning pot. On the other hand, primary air flow increases the entrainment of PM. Furthermore, the flow rate of primary air is strongly influenced by the quantity of pellets in the burning pot and this can cause instability of combustion. With time, especially when primary air flow rate is low, ashes accumulate on the grid reducing inlet area for primary air. The consequence is that the secondary/primary air ratio increase, but the total amount of air decrease. This reduces the total excess air with time.
The combined effects of non-ideal distribution of air in the burning pot and entrainment of dust can justify the higher level of average PM released by the stoves A1 and A2. A similar mechanism is described in (Wiinikka and Gebart, 2005): they observed that fine PM released in the flue gas was maximum when the combustion was fed only by the primary air coming from the bottom.
The geometry of burning pot of stove B1 and B2 allows to get very low and stable levels of CO in flue gas, even less than 10 mg/Nm3, and it is possible to consider the combustion "quasi-ideal". In this burning pot there are not holes on the bottom, but primary air enters from the bottom-side of the burning pot and causes a semi-pyrolysis process, because pellets in the centre of the burning pot warm in air lacking conditions and release combustion gases. This combustion permits a decrement of PM release.
In stoves of type B, consecutive tests within the same test session exhibit an increment of PM emissions. Further, the colour of particulate collected by the filter changes from test to test. At the beginning, the combustion releases a minimum quantity of PM, then PM emissions continue to increase with time. We explain this phenomenon as caused by a change in combustion conditions due to ash accumulation in the burning pot: as the ash level in the pot rises above a threshold, it interacts with the primary air enhancing entrainment.
CO = 158 mg/Nm3 CO = 114 mg/Nm3 CO = 111 mg/Nm3 CO = 149 mg/Nm3 CO = 115 mg/Nm3 CO = 165 mg/Nm3 CO = 127 mg/Nm3 CO = 77 mg/Nm3 CO = 155 mg/Nm3 CO = 109 mg/Nm3 0 5 10 15 20 25 30 35 40 45 50 0 2 4 6 8 10 12 14 PM ( m g /N m 3 ) O2 (%) Case A1; 8 kW; 1850 rpm CO = 83 mg/Nm3 CO = 111 mg/Nm3 CO = 62 mg/Nm3 CO = 120 mg/Nm3 0 5 10 15 20 25 30 35 40 45 50 0 2 4 6 8 10 12 14 PM ( m g /N m 3 ) O2 (%) Case A2; 11 kW; 2300 rpm CO = 8 mg/Nm3 CO = 8 mg/Nm3 CO = 7 mg/Nm3 CO = 5 mg/Nm3 CO = 7 mg/Nm3 CO = 59 mg/Nm3 0 5 10 15 20 25 30 35 40 45 50 0 2 4 6 8 10 12 14 PM ( m g/ N m 3) O2 (%) Case B1; 8 kW; 1350 rpm CO = 7 mg/Nm3 CO = 7 mg/Nm3 CO = 7 mg/Nm3 CO = 7 mg/Nm3 CO = 5 mg/Nm3 CO = 9 mg/Nm3 CO = 11 mg/Nm3 CO = 11 mg/Nm3 CO = 11 mg/Nm3 CO = 7 mg/Nm3 CO = 11 mg/Nm3 CO = 8 mg/Nm3 0 5 10 15 20 25 30 35 40 45 50 0 2 4 6 8 10 12 14 PM ( m g/ N m 3) O2 (%) Case B2; 10 kW; 2000 rpm CO = 7 mg/Nm3 CO = 19 mg/Nm3 CO = 40 mg/Nm3 CO = 115 mg/Nm3 CO = 8 mg/Nm3 CO = 10 mg/Nm3 CO = 10 mg/Nm3 0 5 10 15 20 25 30 35 40 45 50 0 2 4 6 8 10 12 14 PM ( m g /N m 3 ) O2 (%) Case B1; 8kW; 1450 rpm CO = 50 mg/Nm3 CO = 14 mg/Nm3 CO = 10 mg/Nm3 CO = 10 mg/Nm3 CO = 10 mg/Nm3 CO = 45 mg/Nm3 CO = 15 mg/Nm3 CO = 13 mg/Nm3 0 5 10 15 20 25 30 35 40 45 50 0 2 4 6 8 10 12 14 PM ( m g /N m 3 ) O2 (%) Case B2; 10 kW; 2100 rpm
Figure 3: Average PM-O2-CO values for each test performed with stoves A1, A2, B1 and B2 at different burning powers and at
different extractor velocities. CO and PM values are referred at O2 13%
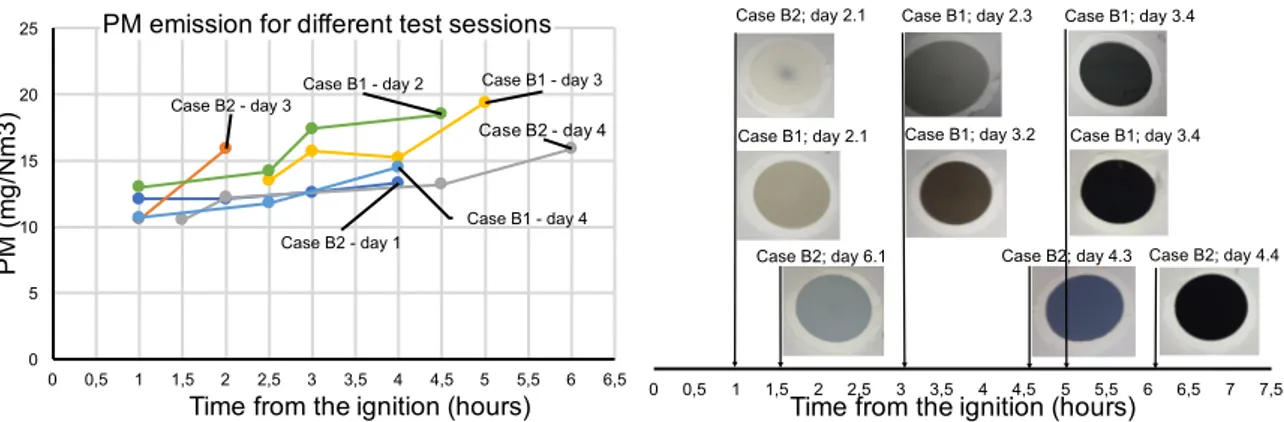
In Figure 4 on the left, we plot average PM measured during six test sessions made in different days, using stoves B1 and B2. In each day of the six ones, there is an apparent trend: PM emissions tend to increase from the first to the last test of the session. For the first test of the day, that is usually performed after one hour from ignition, measured PM falls between 10 and 15 mg/Nm3 while for the last test of the day, that is usually performed after six hours from ignition, PM falls between 15 and 20 mg/Nm3.
The evolution of the combustion conditions in the stoves of type B during a test session is suggested also by the change of colours of particulate collected on the filter. As shown in Figure 4 on the right, at the beginning of the combustion, PM colours vary between cream, pale brown and pale blue. After 2-3 hours approximately, PM colours change to grey or brown or blue. After 5-6 hours, PM colours become dark grey or black. This indicate a change in chemical composition of PM as combustion proceeds. Although the phenomenon is still under investigation, we try to explain it through the following model.
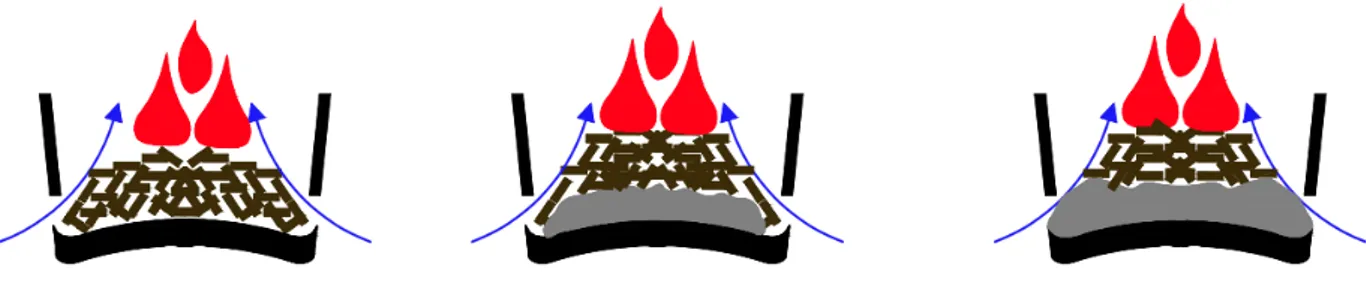
We divide the combustion process during a test session in three phases without considering the ignition and extinguishing phases:
• 1st phase: burning pot without ash;
• 2nd phase: burning pot with embers, pellets and ash;
Case B2 - day 1 Case B2 - day 3 Case B2 - day 4 Case B1 - day 3 Case B1 - day 4 Case B1 - day 2 0 5 10 15 20 25 0 0,5 1 1,5 2 2,5 3 3,5 4 4,5 5 5,5 6 6,5 PM ( m g /N m 3 )
Time from the ignition (hours) PM emission for different test sessions
0 0,5 1 1,5 2 2,5 3 3,5 4 4,5 5 5,5 6 6,5 7 7,5
Time from the ignition (hours)
Case B2; day 2.1 Case B1; day 2.1 Case B2; day 6.1 Case B1; day 2.3 Case B1; day 3.2 Case B2; day 4.3 Case B1; day 3.4 Case B1; day 3.4 Case B2; day 4.4
Figure 4: Average PM versus time from ignition for different test sessions on stove B1 and B2 (left). PM values are referred at O2 13%; colours of PM deposited on filter in different tests versus time from ignition (right)
During the 1st phase, in the burning pot there is a very low amount of ash, therefore the air, coming from the bottom-side of the burning pot, passes over embers and pellets. Pellets in the centre of the burning pot are heated in air-defect conditions and undergo a pyrolysis process. There is no entrainment of dust and particles because the negligible amount of ashes in the burning pot is not hit by primary air. The PM released during the combustion process is minimum. This phase is represented in Figure 5, on the left.
During the 2nd phase, ash starts to deposit in the centre of the burning pot. Ash, in this phase, does not influence combustion conditions, because primary air inlet is totally free. Combustion conditions are the same as in the 1st phase, but entrainment is now present because primary air flows over ash in the burning pot and entrainment increases as the ash level in the burning pot rises. This phase last a few hours and depends on the size of the burning pot and on the quantity of pellets burnt. PM entrained in the flue gas grows with the quantity of ash in the burning pot. This phenomenon is represented in Figure 5 in the centre.
During the 3rd phase, ash reaches the primary air inlet slit. Now primary air impinges directly on char, fresh pellets and ash. This type of combustion is quite similar to combustion of stoves A. The level of PM in the flue gas reaches a higher level depending on the quantity of ash hit by primary air. This last phase is shown in Figure 5 on the right.
3.3. Relation between instanstaneous PM and O2 values
In recent works (Petrocelli, 2013; Petrocelli, 2014), some of us introduced and showed usefulness for pratical purposes of plotting instantaneous CO values versus O2. Instantaneous data collected over one limited time interval
(from 30 minutes up to few hours) can be as useful in recostruction the CO versus O2 dependence as average data
collected in several days of testing. These plots allow to determine an O2 interval that minimize CO production (see,
for example, Figure 6 and Figure 7 on the right) and are quite useful during the setup of the operating parameters of a new stove.
We tried and verified whether a similar approach can be useful for PM minimization. Preliminary results seem to exhibit differences related to the CO emissions level.
Combustion with very low CO emissions
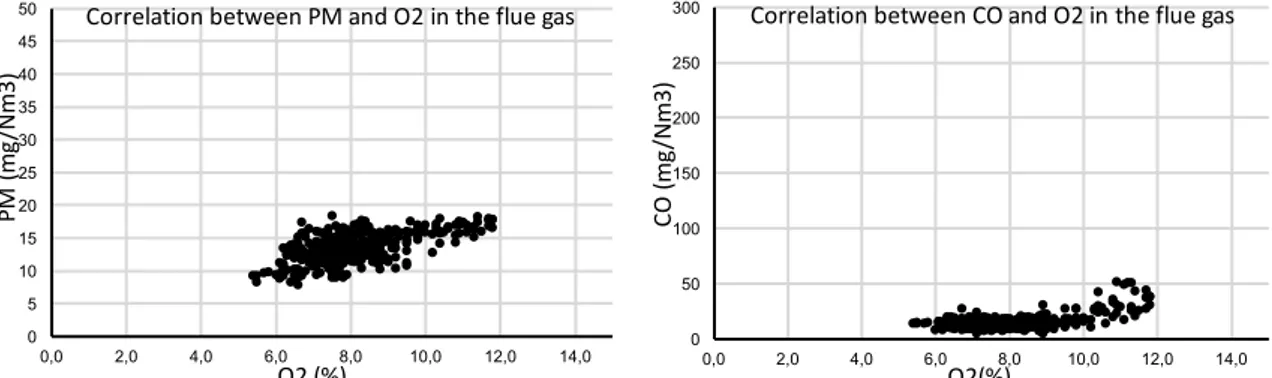
In the type B stoves, CO emissions are close to zero, PM emissions are reduced, but not as much as those of CO. Furthermore, the amount of instantaneous PM in the flue gas is almost independent of O2 content: a weak linear
increase with O2 can be noticed when PM concentration, normalized at 13% O2, is plotted versus O2 (see Figure 6).
The weak dependence between PM and O2 is obtained in all tests with type B stoves that are characterized by
quasi-zero CO levels. As shown in Figure 6, PM generation is reduced, but it never goes below a level quite higher than zero. This feature can be explained recalling that the combustion of pellets always releases a minimum amount of PM, made mostly by inorganic compounds and that depends by the fuel properties and composition rather than by the combustion conditions.
In Figure 6 on the right, the CO-O2 relation for the same test is plotted: the average concentration of CO in this test,
Figure 5: Sketch of combustion evolution in the new type of burning pot (stoves B1 and B2)
Combustion with higher CO emissions
A different PM versus O2 behaviour is observed when CO level grows because of a less ideal combustion conditions.
The PM released in the flue gas is much higher due to a significant presence of inorganic particles. From the analysis of data collected in several tests, it appears that PM is correlated with O2. PM versus O2 instantaneous curve is
similar to the CO versus O2 curve: both curves have a minimum for the same value of O2, approximately.
Plots drawn in Figure 7 have similar qualitative trends with an optimum concentration of O2 that minimize both the
release of PM and CO. For this test (stove A2, day 2.3), the optimum O2 concentration is between 9,5% and 10%.
The average CO concentration over the whole test is 120 mg/Nm3, while in the optimum O2 range is 98 mg/Nm3. The
average PM concentration over the whole test is 17,2 mg/Nm3, while in the optimum O2 range is 15,6 mg/Nm3.
In these tests (with stoves A1 and A2) O2 concentration that minimize CO production, minimize PM release also. As
already pointed out, there are two different types of PM in the flue gases: organic PM, which is caused by poor combustion and depends on O2 concentration in the flue gas; it can be removed for CO tending to zero; inorganic PM
which is constant during the combustion and which is likely dependent on characteristics of the wood pellets used as fuel and does not depend on combustion conditions.
4. CONCLUSIONS
This paper provides new elements in the understanding of PM generation during the combustion in wood pellet stoves.
Combustion depends heavily on design of the combustion chamber, in particular of the burning pot. In this study two different burning pots and four stoves were analysed: a traditional burning pot model with primary air passing through the bottom and an innovative model with primary air coming from a slit between the side wall and the bottom of the burning pot. Stoves operate at different burning powers and different excess air.
The experimental results exhibited quite different PM levels in the flue gas from stoves equipped with different burning pots. Stoves of type A (classic burning pot) usually release higher amounts of PM than stoves of type B (innovative burning pot).
For stoves B strong reduction of CO emissions were recorded, with levels close to zero. However, PM emission reduction was not as much. Hence, PM generation does not depend only on combustion quality, but also on combustible quality, in particular ash content. There are two different PM components released in the flue gases: organic PM, which depends on the quality of combustion and can be largely removed when CO amount is close to zero; inorganic PM, which likely depends on the intrinsic characteristics of the fuel. Improvement of the burning pot design allows to improve combustion and to minimize the release of the organic component. Instead, inorganic PM, not depending on poor combustion, cannot be reduced acting on combustion conditions.
Another experimental evidence collected during tests on stoves B is that PM emissions tend to increase with time passed from ignition. At the beginning, when burning conditions can be considered steady (about one hour after ignition) the quantity of PM is minimum, as time goes by, however, PM production grows significantly. We explain this behaviour as caused by the accumulation of ashes in the burning pot and by their interaction with the primary air streams. The interaction changes the combustion conditions and the emissions of stoves B become more similar to emissions of stoves A.
0 5 10 15 20 25 30 35 40 45 50 0,0 2,0 4,0 6,0 8,0 10,0 12,0 14,0 PM (m g/ N m 3) O2 (%) Correlation between PM and O2 in the flue gas 0 50 100 150 200 250 300 0,0 2,0 4,0 6,0 8,0 10,0 12,0 14,0 CO (m g/ N m 3) O2(%) Correlation between CO and O2 in the flue gas
Figure 6: PM-O2 correlation with very low CO level (left); CO-O2 correlation with very low CO level (right). CO and PM are
referred at O2 13% 0 5 10 15 20 25 30 35 40 45 50 0,0 2,0 4,0 6,0 8,0 10,0 12,0 14,0 PM (g /m 3) O2 (%) Correlation between PM and O2 in the flue gas 0 50 100 150 200 250 300 0,0 2,0 4,0 6,0 8,0 10,0 12,0 14,0 CO (m g/ N m 3) O2(%) Correlation between CO and O2 in the flue gas
Figure 7: PM-O2 correlations with high CO level (left); CO-O2 correlation with high CO level (right). CO and PM are
referred at O2 13%
The initial good performance of stoves B are likely due a semi-pyrolysis process, because the pellet in the centre of the burning pot heats up in air-absence conditions, while during the combustion in stoves A, the primary air flows through pellets, embers and ashes and cause a direct combustion process.
The time dependence of PM production is pointed out also by the change of colour of the dust deposited on the filters at different time from ignition. At the beginning, colours are light, while after three or four hours they tend to dark grey or black. It seems clear that this corresponds to PM composition changes during the combustion process of stoves B due to variable combustion conditions with operation time.
5. REFERENCES
AICO spa, 2016. Braciere autopulente per apparecchi da riscaldamento. Patent number: B1.E0034.12.EP.3. BRUNNER, Thomas, 2009. Primary measures for low-emission residential wood combustion – comparison of old with optimised modern systems. Proc. of the 17th European Biomass Conference.
BRUNNER Thomas, 2013. Investigations of aerosol formation pathways during MSW combustion based on high temperature impactor measurements. Fuel Processing Technology, 105, 154–160.
COSTA, Mario, 2014. Engineering bed models for solid fuel conversion process in grate-fired boilers. Energy. 77, 244–253.
EL MAY, Yassine, 2012. Measurement of Gaseous and Particulate Pollutants during Combustion of Date Palm Wastes for Energy Recovery. Aerosol and Air Quality Research. 12, 814–825.
EN 13284-1: 2001. Determination of low mass concentration of dust - Part 1: Manual gravimetric method. EN 13240+A2: 2004. Roomheaters fired by solid fuel. Requirements and test methods.
EN 14785: 2006. Residential space heating appliances fired by wood pellets. Requirements and test methods. EN ISO 17225: 2015. Biocombustibili solidi: specifiche e classificazione.
European Parliament (EU), 2009. Directive 2009/125/EC.
FERNANDES Ulisses, COSTA Mario, 2013. Formation of Fine Particulate Matter in a Domestic Pellet-Fired Boiler.
Energy & Fuels, 27, 1081–1092.
JANAJREH, Isam, 2013. Numerical and experimental investigation of downdraft gasification of wood chips. Energy
Conversion and Management. 65, 783 – 792.
KEELEY, Bignal, 2008. Release of polycyclic aromatic hydrocarbons, carbon monoxide and particulate matter from biomass combustion in a wood-fired boiler under varying boiler conditions. Atmospheric Environment, 42, 8863– 8871.
Ministero dello Sviluppo Economico (MiSE), Ministero dell’Ambiente e della Tutela del Territorio e del Mare, Ministero delle politiche agricole alimentari e forestali, 2016. Decreto ministeriale 16/02/2016.
PETROCELLI, Domenico, 2013. Indicazioni sperimentali per la progettazione di stufe a pellet ad alta efficienza. Ph.D. thesis. University of Brescia.
PETROCELLI, Domenico, LEZZI, Adriano Maria, 2014. CO and NO emissisons from pellet stoves: an experimental study. Journal of Physics: 501, 012–036.
PRÜSS-USTÜN, Annette, 2016. Preventing disease through healthy environments. Towards an estimate of the environmental burden of disease. Geneva: World Health Organization.
WIINIKKA, Henrik, 2005. High Temperature Aerosol Formation and Emission Minimisation during Combustion of Wood Pellets. Ph.D. thesis. Luleå University of Technology.
WIINIKKA Henrik, GEBART Rikard, 2005. The influence of air distribution rate on particle emissions in fixed bed combustion of biomass. Combustion Science and Technology. 177, 1747–1766.
WIINIKKA Henrik, 2006. High-temperature aerosol formation in wood pellets flames: Spatially resolved measurements. Combustion and Flame, 147, 278–293.
World Health Organization (WHO), 2016. Ambient Air Pollution: a global assessment of exposure and burden of disease. Geneva: World Health Organization.
ZELLAGUI, Sami, 2017. Parametric study on the particulate matter emissions during solid fuel combustion in a drop tube furnace. Fuel. 189, 358–368.