Department of Economics and Management
University of Brescia
Italy
WORKING PAPER
Via S. Faustino 74/b, 25122 Brescia – Italy
Tel 00390302988742 Fax 00390302988703
email: [email protected]
1
Labor Market Rigidity, Social Policies
and the Labor Share.
Empirical Evidence before
and after the Big Crisis.
Maria Laura Parisi
Angelo Penta
1
Labor Market Rigidity, Social Policies and the Labor Share.
Empirical Evidence before and after the Big Crisis.
Maria Laura Parisi(1) Angelo Penta(2)
(1) Department of Economics and Management, University of Brescia, Italy, [email protected]
(2) Department of Economics and Management, University of Brescia, Italy, [email protected]
Abstract
We estimate the impact of four important and general policies shaping the degree of labor market rigidity on the labor share: the intensity of employment protection, welfare expenditures, government expenditures on active labor market programs, and minimum wage policy. Moreover, we are interested in whether the size of trade unions affects the labor share. Labor income share has experienced a declining trend since mid-1970s, and the empirical evidence found little if no correlation of this decline to general labor market institutions. We found, however, that some institutions are correlated to the downward trend, depending on the welfare system adopted. Moreover, many countries saw an upsurge of their labor share after the burst of the financial crisis. We also discuss evidence of whether the crisis weakened or reinforced the effect of some policies in sustaining the labor share.
JEL classification: E02, E25, H53
Keywords: labor income share, employment protection legislation, active labor market programs, minimum wage, welfare
systems
1. Introduction
The last financial and economic crisis aggravated such macroeconomic distortions as unemployment, especially for the youngsters and of the long-term type, increasing social and income disparities. Every advanced economy has a set of established policies and institutions designed to reduce those disparities, sustaining households and workers’ income. Has the crisis reduced the effectiveness of such public policies and labor market institutions? If we look at the “simple” macroeconomic distribution of income between labor and profits, it is evident that workers have had a sharply decreasing slice since mid-1970s, in most advanced economies. However, after the burst of the financial crisis in 2007, labor income experienced a sudden upsurge and a following volatile dynamics, which differed across countries. We are interested in the role of institutions in explaining this phenomenon. An extensive research on the effectiveness of institutions (such as, e.g., Employment Protection
2
Legislation or wage bargaining process) on wage determination and employment exists. Part of these studies - that we review in the next section – focused on attributing the decreasing path of the labor income share to globalization, labor-saving technological progress, or competition, but found little or no effect of labor market institutions on income distribution.1
Income shares are the shares of national income that reward factors of production. Labor share is the portion accruing to labor. It is composed of returns to skilled and unskilled labor, or, in other words, to human capital and raw labor. Human capital consists of past investments in education, training and experience, and raw labor is the remuneration of a zero-skill labor (Prados de la Escosura and Rosés, 2003, Schneider, 2011). Thus, the value of the labor share is determined by the level of employment, labor compensation and the value added. The analysis of labor income share is important for three main reasons, according to Atkinson (2009): first, the study of functional income links macroeconomic and microeconomic dimensions; second, it helps understanding the issue of income inequality and wage distribution; third, it may help addressing concerns of social justice, employees’ perception of fair wages, in comparison to their employers profits.
In the past thirty years, the increase in labor compensation has been lower that the growth of output it contributed to form (Estrada and Valdeolivas, 2012). Figure 1 illustrates the trend in labor income share for some advanced economies in Europe, Japan and the US: it is evident that the decrease concerned European countries and Japan much more than the Anglo-Saxon countries.
Since the empirical literature found labor institutions weakly or ambiguously correlated to the decline in the labor share, we want to shed more light on this issue, specifying in more detail the correlation between labor income share and specific regulations and features, within different groups of countries. We will estimate the impact of four important and general policies shaping the degree of labor market flexibility: the intensity of employment protection, government expenditures on active labor market programs, minimum wage policy, and different welfare regimes. Moreover, we are interested in whether the presence of trade union influenced the labor share. We analyze whether the impact of each policy differed before and after the beginning of the big economic crisis, to understand whether the crisis weakened some of them – or not at all, and why.
3
In principle, employment protection legislation should have a negative direct impact on the labor share, reducing labor mobility, increasing hiring and firing costs, thus lowering labor demand. Unions bargaining power on wages should positively affect the labor share, by lowering turnovers and dispersion of pays. Active programs such as training, employment incentives, direct job creation, early retirement should all help increasing the labor share.2 Again, welfare expenditures, such as household income subsidies or pensions, and public health, may increase the labor share, when for example governments spend on day care for children up to 6 years old, helping mothers to get back to their jobs. Finally, minimum wages keep workers (in general, those employed in low-skilled occupations) income higher, but lower their labor demand.
Section 2 of this paper reviews the empirical literature on the determinants of the labor income share. Section 3 provides a description of the diverse labor market institutions, government social policies and educational systems characterizing the countries in our sample, which allows us to categorize them in seven groups. Section 4 describes our dataset. Section 5 defines our econometric framework and presents the results. Section 5.1 discusses other results, taking the crisis time into account. Finally, Section 6 concludes.
Figure 1. Labor Share of the main advanced economies in Europe, Japan and the US, in 1969-2012 (five-year averages).
Source: OECD database with elaboration of the authors. Base index average 2005-2012=100. 95 100 105 110 115 120 125 1970-741975-791980-84 1985-89 1990-94 1995-99 2000-04 2005-12
4
2. The determinants of the labor share in the empirical literature
Many empirical studies gave different explanations to this decline, but there is not a consensus on the direction of how economic phenomena affected the labor share. Globalization is regarded as one of the main drivers: many scholars suggested that trade openness negatively affected the labor share, especially since the 1980s. Harrison (2005) and Guscina (2006) focused on a broader period, going back to 1960 up to 2000. They found that an increase in trade openness caused a decrease in the labor share, although globalization improved the general conditions of workers. Jayadev (2007), Jaumotte and Tytell (2007) used more recent data and found very similar results: globalization affected negatively the labor share, because of the increased mobility of workers and because of the loss of bargaining power of unskilled workers.
Another negative driver of the labor share is technological progress. Both Jayadev (2007) and Jaumotte and Tytell (2007) explained that technological progress is biased towards labor-saving technology rather than a labor-augmenting one.
Guerriero and Sen (2012), on the other hand, found a positive correlation between the labor share and either international trade or technological progress, measured as the number of patent applications in each country. According to their results, exports of consumption goods and capital goods, and the consequent need for good managerial practices, led to a rise in both employment and wages, thus increasing the labor share. Moreover, technological progress was strongly positively correlated with trade in their regressions. Indeed, international trade openness reduced by half its effect on the labor share when considered together with patent applications. In order to further analyzing the impact of technological progress, they used two different specific variables: the value of expenditure in research and development, and the level of mechanization, measured as the share of machinery capital out of total capital stock. While the labor share benefited from R&D expenditure (since it generally fosters innovation), mechanization affected negatively the ratio, given that it substituted labor. This last result is consistent with other previous analyses: labor-saving progress decreases the labor share.
Lawless and Whelan (2011) tried to find some correlation between inflation and the labor share. However, they found no evidence of such relationship: they therefore supposed that technology increased the elasticity of substitution with respect to capital, thus causing the decline of the labor share.
5
Karabarbounis and Neiman (2014), besides demonstrating that the labor share indeed declined, found that technological progress lowered the ratio, consistently with most previous literature. Changes in technology, especially the information technology, affect negatively the labor share. Again, Bassanini and Manfredi (2012) found that ICT progress created opportunities for innovations. However, innovations appear to be mostly labor-saving, thus lowering the labor share. Nonetheless, this phenomenon explains only part of the decline: the authors found that privatization of state-owned enterprises is another factor affecting the decline.
Azmat, Manning and Van Reenen (2012), likewise, supposed that privatization should be one of the main drivers of the downturn since the 1980s. Even if privatization leads to a rise in wages, it causes an even greater fall in the level of employment, therefore pushing the labor share ratio down. On the other hand, the increase in product market competition offset this downward pressure, alleviating the labor share’s decline. The authors included also an indicator of labor market institutions, i.e. trade union density, among their explanatory variables. Nonetheless, the estimate of trade union density impact was not statistically significant.
Blanchard and Giavazzi (2003) already searched for the effects of labor market institutions on the labor share. They found that deregulation in the product market may trigger subsequent deregulation in the labor market. With lower rents, induced by the goods market deregulation, workers may have no incentives to fight for a share of these rents, making benefits not worth the cost of such a policy.
A decrease in bargaining power of workers brings to a contraction in wages in the short-run, while in the long-run wages tend to remain unchanged. Eventually, a government could issue a policy in order to deregulate the product market and increase the elasticity of the products demand. More competition creates a favourable effect in the short run, meanwhile in the long term this effect will vanish.
Finally, Guerriero and Sen (2012) cared about the impact of labor market regulation on the labor share as well. Governments impose regulation in order to reduce market failures. For example, legal adjustments may protect workers when their bargaining power is weak. Therefore, the authors expect a positive relationship between labor market regulations and the labor share. Some other scholars in the past (e.g. Nickell, 1999; Besley and Burgess, 2004) argued that this kind of impositions could have an ambiguous effect on employment levels.
6
3. Labor market policy, welfare and education across cou ntries
The strictness of employment protection depends usually on the implementation and content of the Employment Protection Legislation (EPL) in a country. EPL includes, among others, regulation on individual and collective dismissals and severance pay.3 As OECD (2004) argues, the effects of EPL on labor market performance are a controversial subject, both in theory and in applied research. In principle, employment protection may diminish firms’ ability to cope with a rapidly changing environment driven by globalization, technological change and the derived organizational innovation. On the other hand, the rationale behind EPL and its welfare consequences are important too. The European Commission (2003) and ILO both recommended governments to reform appropriately the employment legislation to balance the need of more flexibility in the labor market but with an eye on worker security. Although there has been convergence in reviewing the employment legislation across OECD countries, at least until mid-2000s, especially by introducing many different types of temporary work contracts, still quite a lot of variability exists across countries. In Denmark, for example, belonging to our “Scandinavian group”, employment services seem to be rather effective in “activating” benefit recipients while EPL is moderate in this country – the so-called “flexicurity” approach. In the Netherlands, dismissal law is governed by a “dual system” where an employer can dismiss a worker either by requesting prior permission from a public administrative body – the Centre for Work and Income (CWI) – or, since the 1970s, by requesting a Civil Court to dissolve an employment contract. Civil Courts usually dissolve the employment contract but require relatively high severance pay for the employee.
Countries like the US and New Zealand, in the Anglo-Saxon group, do not include severance pay in EPL, only workers under collective agreements may benefit from this provision. However, the share of workers covered by collective agreements is quite low. Germany, on the other hand, has 70% of its workers covered by collective agreements, but it does not have any severance pay in EPL, except for senior workers. In this country, special collective agreements may restrict dismissal of older workers with long tenure. In fact, this kind of additional employment protection is more widespread than contractual provisions for severance pay since it relates to about 46% of all employees covered by collective agreements (against 35% for severance pay provisions).
7
Regulation of temporary employment appears to be a key element behind cross-countries differences. France, Greece, and Spain, in Southern Europe, offer the strictest employment protection among OECD countries for temporary contracts, while not having particularly stringent provisions for regular contracts.
Overall, the US, the UK and Canada remain the least regulated countries, while Southern European countries have the highest protection, with some exception in France and Italy.
EPL may therefore influence the aggregate level of employment in a countercyclical way (see e.g. Young, 2003), which is one component of how labor income share is measured. We should expect to observe an average positive impact, if any, of labor protection on the labor share, even if it is enforced by collective agreements like in the US or Germany, unless wage adjustments are possible. By strengthening the position of protected workers (“insiders”) in wage bargaining, EPL may have negative impacts on employment, raising labor costs indirectly through its effect on bargaining power. For this reason, we control also for trade union density (U) in our analysis.4 Trade union density is a way of measuring potential union bargaining pressure.5 On the other hand, EPL is associated to lower flows into and out of unemployment, and longer unemployment spells. Only Scandinavian countries do show high rates of outflow from unemployment and moderate level of EPL (OECD, 2004). EPL thus creates incentives to longer job search, slower re-employment, or exiting the labor force. Active labor market policies moreover are capable of limiting the EPL-induced mechanisms, in particular reducing long-term unemployment and favoring hiring.
Active Labor Market Policies (ALMP) are government expenditures on public employment services, labor market training, subsidized employment such as direct job creation and incentives, job rotation and sharing, and supported employment and rehabilitation.6 Until 2005, for example, Australia, Canada, New Zealand, the US and Norway spent on average 0.5% of GDP on ALMP, while the EU countries (belonging to OECD) expenditure was on average 1% of GDP, with Denmark peaking at a high 5% (both on active and passive programs). However, countries have different targets of their ALMP: the former countries spent more on public employment services, training and programs for the disabled, while EU countries focused on employment incentives, direct job creation, and start-up incentives (Grubb and Puymoyen, 2008). The United States introduced the “experience-rating”, which links employers’ social security contributions to the layoff history of
8
the firm, to prevent firms from taking advantage of temporary layoffs in response to cyclical downturns in labor demand. This policy initiative seems to have reduced the cyclicality of employment. In general, total "active" spending is typically distributed across transfers to (unemployed/young/trainees) individuals, transfers to employers and transfer to service providers, in the form of wages (OECD, 2014). We should therefore expect a positive correlation of ALMP and the labor share.
Welfare expenditures (WE) refer to government spending on public health, pensions and other forms of social assistance, including education, protection of the environment and access to cultural resources. The Scandinavian countries are renowned to have adopted the “Nordic model”, where those services are extensively granted, the Continental countries developed the “European Social model” and the others adopted a “Third Way”, where fewer and residual services are provided to special categories of people only. Based on these models, we use our classification of countries.7
Minimum Wage (MW) is another form of salary protection given that it is usually binding for low-skilled occupations. Italy, for example, even if it has not formally implemented such a policy, has a similar system of minimum requirements in collective bargaining. Our classification of countries, based on the Welfare regimes, does not clearly identify those countries implementing the minimum wage policy. Therefore, we re-classify countries according to whether they have such regulations or not (Italy is in the no-minimum-wage group).8 Educational systems vary across countries even within homogeneous groups. In Scandinavian countries like Finland, government finances student education from 6 years old to university degree, entirely free, with one of the highest percentage of GDP devoted to education among the OECD countries. It is difficult to identify similar educational systems around the world, but it is possible to look at countries ranked by some components, especially in the education output. Taking the Education Index from the Human Development index (HDI, 2014), based on the mean years of schooling and expected years of schooling, the highest positions in 2013 were those of Australia, New Zealand, Norway, the Netherlands and the US. Germany followed just behind.
9
4. Data description
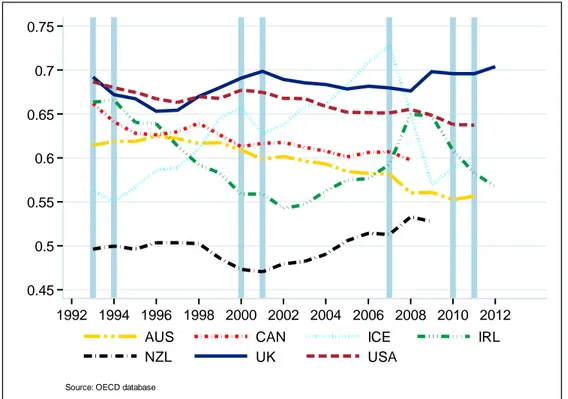
We selected a sample of 26 countries with observations between 1998 and 2012. We group these countries into five broad categories that differ for their policy choice in terms of labor institutions, welfare expenditures and educational systems, as explained in the previous section.9 Within each category, countries are homogeneous at least in the approach used to channel public funds into ALMP, social protection, and education. Figure 2 illustrates the trend of labor share for Anglo-Saxons countries. The US, Canada and Australia have experienced a continuous decrease in their average labor share. On the other hand, the UK has a quite stable and high labor share over time, with a jump after 2007. Ireland had a sharp decrease until 2002 (more than 10% in ten years), a sharp increase until 2008, thereafter decreasing again. New Zealand, which has the lowest level of the labor share in the group, saw its labor share constantly increase at least until 2008. Iceland’s labor share is moving very differently: it increased until 2007, then, after the crisis hit, the labor share dropped by about 15% in two years.
Figure 2. Labor share of Anglo-Saxon countries
0.45 0.55 0.65 0.75 0.5 0.6 0.7 1992 1994 1996 1998 2000 2002 2004 2006 2008 2010 2012 AUS CAN ICE IRL
NZL UK USA
10
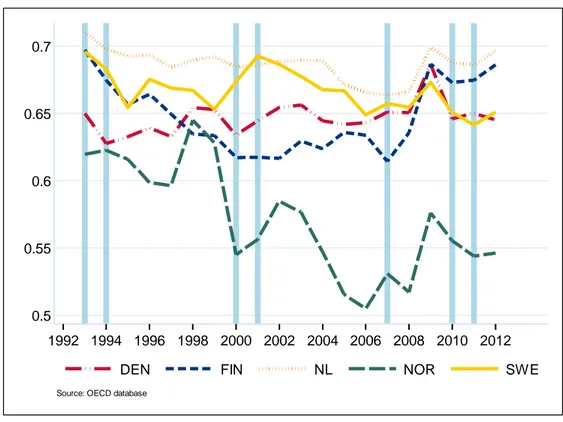
Figure 3 shows the labor share dynamics for the Scandinavian countries. Contrary to the others, Norway’s labor share has decreased sharply since 1998 to about 50% in 2006, but it recovered few percentage points after the burst of the crisis. Every country in this group experienced some increase in the labor share after 2007.
Figure 3. Labor share of Scandinavian countries
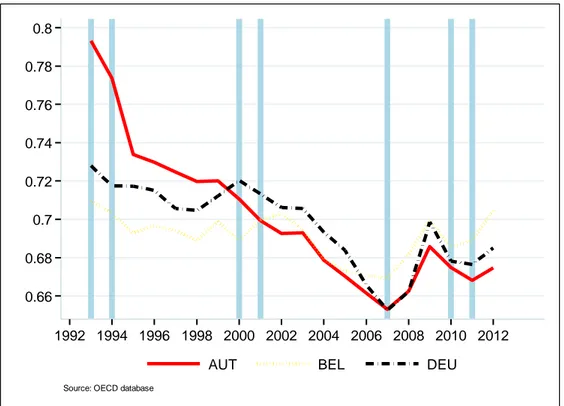
Interestingly, as shown in Figure 4, Continental countries converged to a low 65% in 2007, while starting from much higher positions (Austria’s labor share was equal to 80% in 1992). After the beginning of the economic crisis, the three labor shares started increasing again. Finally, in Figure 5, we draw the labor share trend of Southern European countries. While in the ten years going from 1996 to 2006, the shares were quite stable and close to each other, they spread out after 2007. Greece, Spain and Portugal have a declining trend, Italy and France an upward slope.
0.5 0.55 0.6 0.65 0.7 1992 1994 1996 1998 2000 2002 2004 2006 2008 2010 2012 DEN FIN NL NOR SWE
11
Figure 4. Labor share of Continental countries
Figure 5. Labor share of the Southern European countries
0.66 0.68 0.7 0.72 0.74 0.76 0.78 0.8 1992 1994 1996 1998 2000 2002 2004 2006 2008 2010 2012 AUT BEL DEU
Source: OECD database
0.6 0.62 0.64 0.66 0.68 0.7 0.72 0.74 0.76 1992 1994 1996 1998 2000 2002 2004 2006 2008 2010 2012 FRA GRE ITA POR ESP
12
We also divide the 26 countries in two groups, those implementing currently a minimum wage policy and those that do not (see footnote 8). Figure 7 shows the “average” labor share for minimum wage and non-minimum wage countries. Clearly, the latter have always had higher and more volatile labor income share over time. The minimum wage group’s labor share declined sharply until 2006, and increased again sharply until 2009. The Minimum wage policy seems to insert a wedge on the average labor share, because the two groups do not show signs of convergence even after the burst of the (second) crisis.
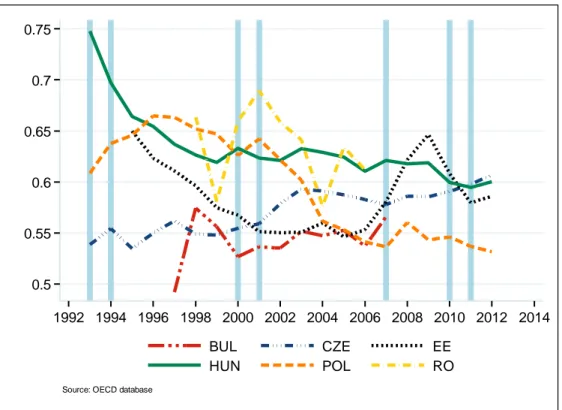
Figure 6. Labor share of the New EU Member States
0.5 0.55 0.6 0.65 0.7 0.75 1992 1994 1996 1998 2000 2002 2004 2006 2008 2010 2012 2014 BUL CZE EE HUN POL RO
13
Figure 7. Labor Share for countries adopting or not adopting the minimum wage.
We analyze in our regressions whether the impact of each policy differed before and after the beginning of the big economic crisis, to understand whether the crisis weakened some of these policies, and why. It is interesting to notice that the big crash has actually reversed the declining trend in labor income share almost everywhere, with few exceptions.
Further controls in the regressions are trade openness, technological progress, (physical) capital-output ratio, investment in human capital, total factor productivity and population.10 Errore. L'origine riferimento non è stata trovata. reports the descriptive statistics of our variables of interest for every group of countries (mean and standard deviations). The average labor share in the past fifteen years spans from lowest 58.8% of New EU Member countries to 68.8% of Continental countries. The EPL index is lowest in Anglo-Saxon countries (1.51) and highest in Southern European countries (3.01), where a higher value indicates more protection (against firing, high severance pay, etc.). ALMP (as a log-percentage of GDP) has its peak in Scandinavian countries (2.68), as expected. Union Density (U) is the percentage of employees enrolled in a union, over total
0.61 0.62 0.63 0.64 0.65 0.66 1998 2000 2002 2004 2006 2008 2010 2012 Minimum Wage No Minimum Wage
14
employment. U2 is the ratio between the sum of wages of union members over total wages paid to employees.11 Both variables indicate that almost 60% if employees
Table 1. Descriptive statistics.
1998-2012 Anglo-Saxons Scandinavian Continental Southern European New Member States All
Labor share 0.613 (0.062) 0.639 (0.049) 0.688 (0.018) 0.664 (0.020) 0.589 (0.038) 0.635 (0.054) EPL 1.561 (0.406) 2.481 (0.265) 2.824 (0.200) 3.013 (0.453) 2.508 (0.270) 2.389 (0.655) ALMP 1.082 (0.669) 2.69 (1.04) 2.58 (0.61) 2.15 (0.62) 0.78 (0.37) 1.81 (1.07) Union density 33.26 (23.16) 57.97 (20.46) 35.67 (14.17) 21.08 (9.08) 16.19 (5.58) 33.57 (22.37) Union density 2 32.88 (23.21) 57.87 (20.55) 35.67 (14.17) 21.12 (9.07) 16.1 (0.37) 33.44 (22.38) Welfare expenses 17.84 (2.36) 25.26 (3.32) 26.78 (1.53) 24.50 (3.84) 19.29 (3.02) 22.16 (4.63) Trade Openness 71.25 (42.22) 89.79 (22.60) 102.67 (33.13) 56.06 (7.18) 107.30 (32.35) 83.44 (37.19) Distance to TF 0.408 (0.155) 0.278 (0.168) 0.438 (0.091) 0.602 (0.124) 0.842 (0.032) 0.497 (0.228) Patent applications 14.29 (27.07) 20.00 (8.11) 33.33 (44.03) 20.00 (20.85) 16.67 (15.86) 20.12 (25.30) Investments 21.74 (4.42) 21.04 (2.61) 20.89 (2.25) 22.18 (3.78) 24.84 (5.04) 22.17 (4.12) Tertiary education 31.77 (6.66) 30.56 (3.68) 25.68 (7.94) 21.76 (7.63) 21.44 (7.90) 26.53 (8.11) Secondary education 39.76 (6.01) 47.50 (4.69) 53.12 (11.26) 32.83 (12.37) 66.89 (8.10) 46.66 (14.65) Population 16.398 (2.075) 15.786 (0.466) 16.754 (1.039) 17.142 (0.805) 15.959 (1.223) 16.390 (1.432) TFP 0.977 (0.180) 0.997 (0.149) 0.934 (0.068) 0.850 (0.100) 0.630 (0.067) 0.891 (0.184) ln-TFP -0.038 (0.169) -0.013 (0.136) -0.712 (0.073) -0.169 (0.118) -0.467 (0.101) -0.136 (0.206)
Mean and standard deviations (in parentheses). Employment Protection Legislation (EPL) is an index varying in [0,6] interval; the higher the index, the more protected the workers. Active labor market policy (ALMP) is the percentage of GPD devoted to the labor market improvement (in natural log) per unemployed person. Union density is the percentage of employees who are members of a union. Union density 2 is the percentage of wages of union members over total wages. Welfare expenses is the percentage of GDP devoted to welfare policies. Trade Openness is measured as the sum of Imports and Exports over GDP in percentage. Distance to Technological Frontier is a ratio calculated as the difference between Norway's per capita GDP and the country's per capita GDP over Norway's p.c. GDP. Patent applications is the percentage of patent applications over total applications of the group. Investments in physical capital as a percentage of GDP. Tertiary education measures the percentage of adult population with a university or college degree. Population is in natural log. TFP is Total Factor Productivity relative to US TFP.
are enrolled in a trade or labor union in Scandinavian countries, versus 21.1% in Southern Europe. Last, almost 27% of GDP in Continental countries is devoted to welfare expenditures. In terms of welfare spending, there appear to be two main groups of countries: those core European countries, including Southern, Continental and Scandinavian, which reserve at least a fourth of their GDP to pensions and public health, and peripheral European countries, which, similarly to Anglo-Saxons, devote much less to those items.
Trade openness is measured as the sum of imports and exports over GDP, distance to frontier is calculated as the difference between per capita GDP of Norway and country’s specific GDP (in percentage points).
Therefore, a low index means that a country is close to the frontier. We use this percentage as a measure of (neutral) technological progress. Patents applications are the percentage of applications within each group. This variable may be considered a proxy for (labor or capital-augmenting) technological progress. Total factor productivity captures instead potential capital-augmenting technological progress. We use these alternative measures of productivity in the regressions. We also include a measure of human capital as the percentage of employees with at least secondary education.
5. Econometric framework and results
We use a general multiplicative functional form for the Labor Share as the aggregate version of Bentolila and Saint-Paul (2003) and Young and Zuleta (2011) labor income relationship to the capital-output ratio,
(1) 𝐿𝑆𝑖𝑡= 𝑔(𝐴, 𝑘𝑖𝑡, 𝛼)𝜔(𝑍𝑖𝑡, 𝑋𝑖𝑡, 𝜀𝑖𝑡)
Where the sub-indices i and t refer to countries and years, respectively. The function g(A,kit) captures the relationship of the labor share derived strictly from the production function (technological progress or TFP and capital-output ratio, kit), plus a country specific error term, αi. The separate (exponential) function ω(Zit,Xit) captures the effects of the labor market institutions and policy variables, Zit ={EPL,ALMP,U,WE}, those variables that are expected to influence the dynamics of the labor share,
i.e. X
it= {globalization, competition,
17
countries or time. Both functions are expressed in multiplicative form as well, such that we express the LS (in logs) as in equation (2),
(2) 𝑙𝑠𝑖𝑡= 𝛽0+ 𝛽1Α𝑖𝑡+ 𝛽2ln 𝑘𝑖𝑡+ 𝜔1𝐸𝑃𝐿𝑖𝑡+ 𝜔2𝐴𝐿𝑀𝑃𝑖𝑡 + 𝜔3𝑈𝑖𝑡+ 𝜔4𝑊𝐸𝑖𝑡 + Γ′𝑋𝑖𝑡+ 𝛼𝑖+ 𝜀𝑖𝑡
Because the objective of this paper is to check for differences in the effects of labor market policies on the labor share in different groups of countries - and whether there was any difference before and after the crisis - we estimate equation (2) for different panels, as explained in previous section. We also interact the right-hand-side variables in equation (2) with a dummy equal 1 for years after 2006.
Finally, we estimate equation (2) dividing countries by their implementation of the Minimum Wage policy. In this way, we control for any interaction existing between the minimum wage and other policies affecting the labor market outcome, and income distribution.
One of the common concerns in time series analysis of the level of labor share is the potential presence of unit roots. The non-stationarity of the labor share would force a re-specification of equation (2) in first or longer differences. We run the augmented Dickey-Fuller test for panel unit root, and report the test and p-values at the bottom of Table 2. The null hypothesis of this test assumes that every panel in the sample presents a non-stationary labor share, versus the alternative that at least some of the panels have a non-stationary share. We produce the test both on the 1998-2012 span, and on the time intervals occurring before and after the crisis, verifying that a deterministic trend and drift may affect the results of the test. Given that the ADF test is not robust to structural breaks in the time series, we also run a robust Phillips-Perron test for panel unit root, on the same null hypothesis. The results of the test reject the null hypothesis, especially before 2006, when labor share in the panel could be safely considered “trend” stationary. The result is however ambiguous in the overall interval, due to the evident structural break of 2007. The PP unit root tests indicate that the non-stationarity feature of the labor share (net of a deterministic trend) came after the burst of the crisis. We therefore decided, as a benchmark analysis, to filter the labor share variable for each country with a Hodrick-Prescott filter, and use the trend component as another explanatory variable in the regression analysis.
18
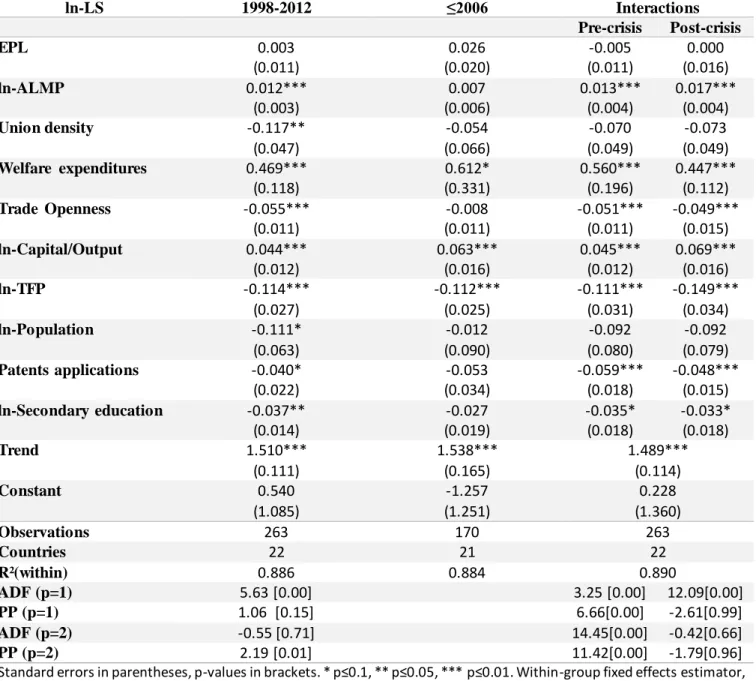
Table 2. Estimates of the coefficients in equation (2) for all countries.
ln-LS 1998-2012 ≤2006 Interactions Pre-crisis Post-crisis EPL 0.003 (0.011) 0.026 (0.020) -0.005 (0.011) 0.000 (0.016) ln-ALMP 0.012*** (0.003) 0.007 (0.006) 0.013*** (0.004) 0.017*** (0.004) Union density -0.117** (0.047) -0.054 (0.066) -0.070 (0.049) -0.073 (0.049) Welfare expenditures 0.469*** (0.118) 0.612* (0.331) 0.560*** (0.196) 0.447*** (0.112) Trade Openness -0.055*** (0.011) -0.008 (0.011) -0.051*** (0.011) -0.049*** (0.015) ln-Capital/Output 0.044*** (0.012) 0.063*** (0.016) 0.045*** (0.012) 0.069*** (0.016) ln-TFP -0.114*** (0.027) -0.112*** (0.025) -0.111*** (0.031) -0.149*** (0.034) ln-Population -0.111* (0.063) -0.012 (0.090) -0.092 (0.080) -0.092 (0.079) Patents applications -0.040* (0.022) -0.053 (0.034) -0.059*** (0.018) -0.048*** (0.015) ln-Secondary education -0.037** (0.014) -0.027 (0.019) -0.035* (0.018) -0.033* (0.018) Trend 1.510*** (0.111) 1.538*** (0.165) 1.489*** (0.114) Constant 0.540 (1.085) -1.257 (1.251) 0.228 (1.360) Observations 263 170 263 Countries 22 21 22 R²(within) 0.886 0.884 0.890 ADF (p=1) 5.63 [0.00] 3.25 [0.00] 12.09[0.00] PP (p=1) 1.06 [0.15] 6.66[0.00] -2.61[0.99] ADF (p=2) -0.55 [0.71] 14.45[0.00] -0.42[0.66] PP (p=2) 2.19 [0.01] 11.42[0.00] -1.79[0.96]
Standard errors in parentheses, p-values in brackets. * p≤0.1, ** p≤0.05, *** p≤0.01. Within-group fixed effects estimator, with robust variance. Trend is calculated using the Hodrick-Prescott filter applied to LS (with drift). ADF(p=1) is the Augmented Dickey-Fuller test for panel unit root using one lag of the ΔLS among the explicative vars. The null hypothesis assumes that in all panels the LS has a unit root. Rejection of this test implies that some panel shows (trend-) stationarity. PP is the Phillips-Perron panel unit root test. It is robust to structural breaks in the series. See note to Table 1 for definitions of the variables. The variables are either natural logs, as indicated, or ratios (not percentage). EPL is an index in [0,6].
19
Table 2 shows the results of the within-group estimator applied to equation (2) to the entire sample of countries. Column 2 of the table reports the coefficient estimates for all countries up to 2006. As the previous empirical literature emphasized, there was no effect of labor institutions on the labor share, even if Welfare has a slightly positive estimated coefficient (no other article used this measure, though, as far as we know). Column 1 reports estimates for the entire sample from 1998 to 2012. The EPL coefficient is not significantly different from zero, very in line with the rest of the previous literature. Nonetheless, Union density is negatively correlated to the labor share. This might be due to the prevailing effect of EPL and bargaining pressure on depressing labor demand. ALMP have a positive significant impact on the labor share, as we expected. Its estimated elasticity implies that a 10% increase in spending on labor market programs would accrue the labor income share by 0.12%. Welfare expenditures do show a positive and significant correlation with the labor share.
The rest of the variables present estimated results, which are standard in the literature. The Capital/Output ratio has a significant coefficient estimate equal to +0.044, corresponding to an elasticity of substitution between labor and capital lower than one, as found in Bentolila and Saint-Paul (2003) or in Young and Zuleta (2011). Globalization appears to affect negatively the labor share, as in Guerriero and Sen (2012). The coefficient of TFP is negative and strongly significant. This signals that technological progress is not capital-augmenting.12 Patents applications is another measure of technological progress. Their effect appears to be negative as well. These two results encourage considering technology as favoring labor productivity. Finally, the log-share of employees with secondary degree (or higher) is negatively correlated to the labor share. Together with the latter result, this negative correlation might signal that over time and across countries, technological change has been skilled-biased.
If we look at Table 3, the impact of the policy and institutions differ quite substantially across countries. EPL had a negative and significant impact on the LS in Continental countries, which, on the other hand, present a positive significant impact of the union density. EPL helped increasing labor income in New Member states, while union density did not appear to be statistically correlated to the LS. For the other groups, the impact of EPL was still zero, but Union Density had even a depressing effect on the LS.
20
Table 3. Estimates of equation (2) for different groups.
ln-LS Anglo-Saxons Scandinavian Continental Southern EU New EU members
EPL 0.047 (0.039) 0.033 (0.042) -0.022* (0.012) -0.013 (0.012) 0.101** (0.045) ln-ALMP 0.011 (0.011) 0.039*** (0.042) 0.038*** (0.010) 0.004 (0.009) 0.020*** (0.007) Union density -0.457** (0.219) -0.188 (0.135) 0.257** (0.107) -0.043 (0.168) -0.213 (0.137) Welfare expenses 0.497** (0.208) 0.731*** (0.215) 0.973*** (0.212) 0.254* (0.151) 0.315 (0.287) Trade Openness -0.033 (0.032) 0.028 (0.043) -0.004 (0.022) -0.026 (0.050) -0.024 (0.027) ln-Capital/Output 0.132*** (0.029) 0.080** (0.038) -0.081*** (0.030) 0.001 (0.013) 0.065 (0.045) ln-TFP -0.247*** (0.055) -0.284*** (0.058) 0.125* (0.064) 0.001 (0.041) -0.167* (0.094) ln-Population -0.100 (0.094) -0.410 (0.324) -0.836*** (0.147) -0.064 (0.192) -0.110 (0.452) Patents applications 0.247 (0.210) -0.053 (0.061) 0.534 (0.593) -0.008 (0.076) -0.031 (0.046) ln-Secondary education -0.039 (1.651) -0.059 (0.045) -0.110** (0.047) -0.042 (0.031) 0.087 (0.157) Trend 2.012*** (0.184) 0.596** (0.232) 1.429*** (0.160) 1.399*** (0.281) 1.324*** (0.181) Constant 0.137 (1.651) 5.668 (0.5.186) 12.393*** (2.344) -0.089 (3.417) -0.107 (7.665) Observations 59 69 41 50 44 Countries 6 5 3 4 4 R² 0.9253 0.8932 0.9709 0.9081 0.9578
Standard errors in parentheses. * p≤0.1, ** p≤0.05, *** p≤0.01. Within-group fixed effects estimator, with robust variance.
It appears that Active Labor Programs did not have a significant impact on the LS for Anglo-Saxons and Southern European countries, while it was still positive and strongly correlated to the LS in the other groups. Welfare expenses were positively and strongly correlated to the LS in all groups but New Members.
Summarizing, the Scandinavian countries keep their labor income share level through the implementation of Active Programs (training, education, incentives to unemployed to immediate job search) and Welfare (healthcare and pensions). Unions and EPL do not appear to count. Continental countries, instead, use ALMP,
21
Welfare and Unions to get even more impact on sustaining the LS. However, strictness of employment protection softens the positive impact of the other policies.
Southern European countries use only Welfare efficiently to sustain their labor income share. New EU Members show a different path. Employment Protection and Active Programs help sustaining the labor share. The other institutions do not count as much.
Finally, Anglo-Saxon countries’ Welfare do increase their labor share, but the presence of Unions have a negative impact, meaning that wage pressures indeed affect negatively labor demand over there.
5.1 The burst of the crisis.
We estimated equation (2) by interacting each explanatory variable by a time dummy equal 1 for year ≥ 2007. In this way, we want to check if the impact of the policy variables after the big financial and economic crisis had changed. Table 2 reports the results for the entire sample. EPL appear not to have any affect even if we split the sample, while Union Density loses its significance. Active Labor Market Programs become even more positively correlated to the LS, after the burst of the crisis. Welfare spending still affect positively the labor share, but slightly less after 2007.
Table 4 reports the results for each group of countries. Let us discuss one group at a time. The Anglo-Saxons policy and institutions behaved quite differently pre and post crisis. Union Density negative effect lost its significance after 2007. On the other hand, Welfare’s positive impact was due to its much higher effect after 2007 (it turned out even negative before the crisis). EPL and ALMP did not substantially change. In Scandinavian countries, ALMP almost doubled its positive effect on the LS after the crisis. Welfare appeared not to have a statistically significant effect on this table, but we attribute this result to the scarce variability of this policy over such short time intervals. Active Programs and Welfare were particularly important before the crisis in Continental Europe, and lost their statistical effect thereafter. However, even EPL and Unions did not appear to have statistically relevant impact when splitting the time interval.
22
Table 4. Estimates of equation (2) for groups of countries and structural break.
ln-LS Anglo-Saxons Scandinavian Continental Southern EU New EU members Pre crisis Post crisis Pre crisis Post crisis Pre crisis Post crisis Pre crisis Post crisis Pre crisis Post crisis EPL 0.027 (0.044) 0.452 (0.323) 0.049 (0.055) 0.194 (0.128) -0.010 (0.029) -0.024 (0.01) 0.002 (0.010) -0.014** (0.004) 0.237 (0.17) 0.045 (0.084) ln-ALMP 0.024 (0.021) -0.038 (0.041) 0.035* (0.014) 0.076*** (0.010) 0.022** (0.003) 0.064 (0.01) 0.012 (0.005) 0.025* (0.010) 0.021* (0.007) 0.044 (0.034) Union density -0.548* (0.224) -1.673 (1.514) 0.032 (0.235) -0.025 (0.297) 0.081 (0.219) 0.701 (0.28) -0.150 (0.073) -0.135 (0.127) -0.233 (0.238) -0.687 (0.302) Welfare expenses -0.577* (0.252) 1.060* (0.421) 0.688 (0.477) 0.985 (0.578) 1.236** (0.128) 0.020 (0.799) 0.438 (0.231) 0.383*** (0.049) 0.491 (1.078) 0.076 (0.511) Trade Openness -0.062* (0.025) -0.004 (0.283) 0.072 (0.076) -0.015 (0.069) 0.035 (0.089) -0.057 (0.066) 0.089 (0.045) -0.014 (0.037) -0.001 (0.022) 0.020 (0.106) ln-Capital Stock 0.113 (0.061) 0.250 (0.281) 0.137 (0.114) 0.161* (0.071) -0.067 (0.042) -0.078* (0.022) -0.034 (0.043) 0.026 (0.028) 0.124 (0.059) 0.099 (0.044) ln-TFP -0.168** (0.065) -0.322 (0.529) -0.333** (0.115) -0.299 (0.253) 0.152 (0.068) -0.103 (0.284) 0.081 (0.108) -0.209* (0.076) -0.213 (0.160) -0.233 (0.139) ln-Population -0.280 (0.209) -0.392* (0.166) 0.120 (0.528) 0.040 (0.515) -0.732 (0.274) -0.774 (0.295) -0.291** (0.083) -0.288** (0.085) -0.293 (0.843) -0.395 (0.837) Patents applications -0.149 (0.248) 2.966** (0.855) 0.135 (0.629) 0.017 (0.030) 0.520 (0.832) 0.702 (0.793) 0.023 (0.044) 0.003 (0.082) 0.020 (0.057) 0.412** (0.074) ln-Secondary education -0.057 (0.039) 0.292 (0.364) 0.025 (0.091) 0.247* (0.108) -0.124*** (0.005) 0.058 (0.067) -0.089 (0.057) -0.071* (0.027) 0.070 (0.494) 0.578 (0.273) Trend 2.325*** (0.135) 0.568 (0.541) 1.672* (0.435) 1.037* (0.429) 1.319** (0.251) Constant 3.271 (3.585) -3.219 (8.356) 10.546 (4.532) 4.038 (1.789) 2.588 (14.237) Observations: 59 69 41 50 44 Countries: 4 5 3 4 4 R²: 0.9456 0.9149 0.9839 0.9594 0.9641
Southern European countries’ employment protection seemed to depress the labor share after the crisis, in a relevant way (while Union density still did not matter). Moreover, ALMP did have a positive impact after 2007 in these countries. Last, Welfare positive effect seemed to come after 2007.
Finally, the last group of New European Union Members showed no change in the impact of EPL, Unions or Welfare before and after the burst of the crisis. Only Active Policies in the Labor Market were sustaining the labor income more in the pre-crisis period, and no more afterwards.
Once dividing countries into the group implementing the minimum wage policy (MW) versus the group that does not (NMW), we find the results in Table 5. EPL is slightly positively correlated with the labor share of non-
23
Table 5. Estimates of equation (2) for Minimum Wage (MW) group and Non Minimum Wage (NMW) countries.
ln-LS MW NMW MW NMW
Pre crisis Post crisis Pre crisis Post crisis EPL 0.001 (0.010) 0.055* (0.032) -0.002 (0.017) -0.009 (0.022) 0.052 (0.044) 0.098 (0.082) ln-ALMP 0.012*** (0.003) 0.030** (0.012) 0.012** (0.005) 0.018*** (0.005) -0.000 (0.010) 0.046* (0.019) Union density -0.108* (0.062) -0.275** (0.110) -0.067 (0.068) -0.063 (0.077) -0.375** (0.134) -0.363* (0.146) Welfare expenses 0.355*** (0.087) 0.642*** (0.209) 0.381** (0.166) 0.347*** (0.110) 1.382* (0.607) 0.619 (0.392) Trade Openness -0.042*** (0.011) -0.096** (0.043) -0.039*** (0.013) -0.033 (0.022) -0.060 (0.059) -0.152** (0.039) ln-Capital/Output 0.035*** (0.012) 0.051 (0.034) 0.043 (0.025) 0.048* (0.026) 0.010 (0.050) 0.100* (0.049) ln-TFP -0.090*** (0.028) -0.195*** (0.051) -0.072 (0.062) -0.108* (0.055) -0.150* (0.073) -0.214 (0.215) ln-Population -0.088 (0.044) -0.510* (0.291) -0.076 (0.068) -0.074 (0.067) -0.508 (0.308) -0.501 (0.337) Patents applications -0.014 (0.027) -0.071 (0.068) -0.029 (0.040) -0.012 (0.038) 0.009 (0.053) -0.063 (0.043) ln-Secondary education -0.024 (0.015) -0.088** (0.036) -0.013 (0.018) -0.021 (0.018) 0.049 (0.053) 0.046 (0.101) Trend 1.657*** (0.069) 1.016*** (0.188) 1.677*** (0.118) 0.980** (0.320) Constant 0.050 (0.741) 7.241 (4.659) -0.212 (1.172) 6.585 (4.892) Observations: 186 77 186 77 Countries 16 6 16 6 R²(within): 0.9008 0.8926 0.9049 0.9202
minimum wage countries, while not correlated to the other group. Union density, on the other hand, had negative impact on the LS for both groups, for the NMW in particularly heavy way both before and after the crisis. ALMP positively affects the labor share for both groups, and the coefficient is almost three times higher for NMW countries. In MW group, ALMP estimate is positive and significant both before and after the crisis, while it is positive and significant for NMW group only after 2007. In both cases, ALMP appears to become more important after 2007. WE effect was strongly positive for both groups, even twice as much for NMW than MW. However, WE resulted not significant for NMW after 2007.
24
Finally, notice that after the crisis the impact of all four policies and institutions became weaker in Continental countries, and stronger in Southern Europe. ALMP sustained labor income share in Scandinavian and in general in NMW countries. Welfare expenses instead sustained labor income in Anglo-Saxons and MW group.
5.2 Robustness Check
Table 6 shows the results for the IV/GMM estimation, applied to the whole sample of countries. We used an IV/GMM estimator because it takes into account endogeneity of some variables, in order to reduce potential reverse causation bias.
Column 1 and column 2 differ only for the variables instrumented: in column 1 we instrumented our policy variables LMAP, EPL, Union density, Welfare, Capital-Output ratio and total factor productivity, while in column 2, 3, 4 and 5 we instrumented only TFP and Capital-Output ratio. Column 3 reports the coefficient estimates for all countries up to 2006. Column 4 and 5 show the pre and post crisis estimation. The excluded instruments are the first differences of TFP, LMAP, logarithm of Welfare, Union Density, EPL, trade openness and logarithm of total investments.
According to the Sargan test results, the instrumental variables are uncorrelated to some set of residuals, and therefore they are acceptable instruments.
The results of the IV/GMM estimation are comparable to the results of the overall regression presented in Table 1. The signs of the coefficients are the same, and the significance is very similar, except for the post crisis period estimation. Welfare, LMAP and capital stock appear to have a positive impact on the labor share, while TFP, trade openness and education are negatively correlated with the wage share.
The only noteworthy difference stands in the Welfare’s post-crisis negative coefficient, which is in contrast with the previous estimation. This might be because Welfare and other policy variables are indeed endogenous. We cannot use this hypothesis in Column 2-5 because of lack of observations. We considered also the estimation for the five groups of countries; however, the lack of observations caused a drop in the significance of most estimates coefficients.
Table 6. IV/GMM Estimates of the coefficients for all countries. ln-LS 1998-2012 (1) 1998-2012 (2) ≤2006 Interactions Pre-crisis Post-crisis EPL -0.074 (0.053) -0.033 (0.021) 0.060** (0.029) -0.001 (0.020) -0.157*** (0.061) ln-ALMP 0.025* (0.014) 0.030*** (0.009) 0.005 (0.009) 0.003 (0.012) 0.084*** (0.030) Union density -0.384 (0.343) -0.115 (0.104) -0.210 (0.155) -0.069** (0.034) 0.195** (0.095) Welfare expenditures 0.732* (0.434) 0.193 (0.284) 1.008*** (0.287) -0.247 (0.223) -1.312*** (0.567) Trade Openness -0.069* (0.011) -0.064* (0.033) -0.008 (0.011) -0.067*** (0.018) 0.032 (0.030) ln-Capital/Output 0.251** (0.118) 0.189** (0.077) 0.240*** (0.053) 0.152*** (0.067) -0.143 (0.206) ln-TFP -0.673** (0.316) -0.693** (0.200) -0.293*** (0.095) -0.338*** (0.130) -0.501 (0.337) ln-Population -0.005 (0.230) -0.074 (0.178) 0.095 (0.132) -0.017** (0.009) 0.003 (0.026) Patents applications -0.025 (0.059) -0.023 (0.050) -0.036 (0.045) 0.015 (0.034) 0.187* (0.110) ln-Secondary education -0.122** (0.054) -0.112*** (0.037) -0.043 (0.034) 0.029 (0.019) -0.093** (0.038) Trend 0.917** (0.430) 0.890*** (0.261) 1.224*** (0.224) 0.659*** (0.197) 0.577 (0.634)
Sargan test p-value 0.4027 0.4071 0.6376 0.4609 0.2878
Instrumented variables lnC/O, lnTFP, lnALMP, EPL,Welfare, Union density
lnC/O, lnTFP lnC/O, lnTFP lnC/O, lnTFP Excluded instruments D.lnTFP, D.lnALMP, D.lnWelfare, D.Union density, D.EPL, D.Trade Openness, D.lnInvestments D.lnTFP, D.lnALMP, D.lnWelfare, D.Union density, D.EPL, D.Trade Openness, D.lnInvestments D.lnTFP, D.lnALMP, D.lnWelfare, D.Union density, D.EPL, D.Trade Openness, D.lnInvestments D.lnTFP, D.lnALMP, D.lnWelfare, D.Union density, D.EPL, D.Trade Openness, D.lnInvestments
Standard errors in parentheses, p-values in brackets. * p≤0.1, ** p≤0.05, *** p≤0.01. Trend is calculated using the Hodrick-Prescott filter applied to LS (with drift). Sargan test’s null hypothesis assumes overidentifying restrictions are valid. Rejection of this test implies that some instrument is not suitable for the model. See note to Table 1 for definitions of the variables. The variables are either natural logs, as indicated, or ratios (not percentage).
26
6. Conclusions
We estimated the impact of four government policies and labor market institutions on the level of the labor income share. We controlled for all those variables that potentially influenced the declining trend of the labor share in most advanced economies, i.e. trade openness, technological progress, market size and competition, human capital endowment in terms of skilled labor. The impact of the policy and institutions differ quite substantially across countries. Scandinavian countries keep their labor income share through the implementation of Active Labor Market Programs (training, education, incentives to unemployed to immediate job search) and Welfare (healthcare and pensions). Continental countries, instead, use ALMP, Welfare and Unions to sustain even more positively the LS. However, strictness of employment protection softens the positive impact of the other policies. Southern European countries use only Welfare efficiently to sustain their labor income share. New EU Members show a different path. Employment Protection and Active Programs help sustaining their labor share. Anglo-Saxon countries’ Welfare do increase their labor share, but the presence of Unions have a negative impact, meaning that wage pressures indeed affect negatively labor demand over there.
Notice that after the beginning of the crisis, the impact of all four policies and institutions became weaker in Continental countries, and stronger in Southern Europe. ALMP sustained labor income share in Scandinavian and in general in Non-Minimum Wage countries. Welfare expenses instead sustained labor income in Anglo-Saxons and Minimum Wage group.
We also applied an IV/GMM estimation method, to face potential reverse causation bias. Overall, signs and significance of the estimated coefficients are confirmed, even within this kind of analysis. However, since we do not have enough observations when we split the sample, it is more difficult to reinforce our benchmark results in
27
Acknowledgments
We presented this draft of the paper at “XI Jornadas de Economìa Laboral” held in Universitat Autònoma de Barcelona, Spain, on 1-3 July 2015, and the 56th annual meeting of the Italian Economic Society, Parthenope University of Naples, on 22-24 October 2015. We are grateful to the conferences participants for their useful comments. Nonetheless, we remain the only responsible for what expressed in this paper.
References
Atkinson, A.B., 2009, “Factor shares: the principal problem of political economy?” Oxford Review of Economic Policy, vol. 25(1), pp.3-16.
Azmat, G., Manning A. and J. Van Reenen, 2007, "Privatization, Entry Regulation and the Decline of Labor's Share of GDP: A Cross-Country Analysis of the Network Industries," CEP Discussion Papers dp0806, Centre for Economic Performance, LSE
Bassanini, A. and T. Manfredi, 2012, “Capital’s Grabbing Hand? A Cross-Country/Cross-Industry Analysis of the Decline of the Labour Share” OECD Social, Employment and Migration Working Papers 133, OECD Publishing.
Besley, T. and R. Burgess, 2004, "Can Labor Regulation Hinder Economic Performance? Evidence from India," The Quarterly Journal of Economics, vol. 119(1), pp. 91-134, February.
Bentolila, S. and G. Saint-Paul, 2003, “Explaining Movements in the Labor Share”, Contributions to Macroeconomics, vol. 3(1).
Blanchard, O. and F. Giavazzi, 2003, “Macroeconomic effects of regulation and deregulation in goods and labor market” The Quarterly Journal of Economics, vol. 118(3), pp. 879-907.
Ebbinghaus, B., 2012, “Comparing Welfare State Regimes: Are Typologies an Ideal or Realistic Strategy?” Draft Paper presented at European Social Policy Analysis Network, ESPAnet Conference, Edinburgh, UK, September 6‐8, 2012.
Esping-Andersen, G., 1990, Three Worlds of Welfare Capitalism, Princeton, NJ: Princeton University Press. Estrada, A. and E. Valdeolivas, 2012, “The Fall of the Labour Income Share in advanced economies”
Documentos ocasionales n.1209. Banco de España, Eurosistema.
European Commission, 2003, “2003 Adopted Employment Guidelines”, http://europa.eu.int/eur-lex/pri/en/oj/dat/2003/l_197/l_19720030805en00130021.pdf
Eurostat, 2006, “Labour market policy database. Methodology”, Luxembourg: Office for Official Publications of the European Communities, ISBN: 92-79-02273-3
Grubb, D. and A. Puymoyen, 2008, “Long time series for public expenditure on labour market programmes”, OECD Social, Employment and Migration Working Papers, No. 73, OECD Publishing.
28
Guerriero, M. and K. Sen, 2012, "What determines the share of Labour in National Income? A Cross-Country Analysis", IZA discussion paper n. 6643.
Guscina, A., 2006, “Effects of Globalization on Labor’s Share in National Income”. IMF Working Paper series n. 06/294, December.
Harrison, A.E., 2005, “Has Globalization eroded the labour’s share? Some Cross-Country evidence” Munich Personal RePEc Archive working paper n. 39649.
Human Development Report, 2014, Sustaining Human Progress: Reducing Vulnerabilities and Building Resilience, UNDP, ISBN: 978-92-1-126368-8
Jaumotte, F. and I. Tytell, 2007, “How has the Globalization of Labor affected the Labour Share in Advanced Countries?” IMF Working Paper series n. 07/298.
Jayadev, A., 2007, “Capital account openness and the labour share of income”, Cambridge Journal of Economics, vol. 31(3), pp. 423-443.
Karabarbounis, L. and B. Neiman, 2014, “The Global Decline of the Labor Share”, the Quarterly Journal of Economics, vol. 129(1), pp.61-103.
Lawless, M. and K. Whelan, 2011, "Understanding the dynamics of labor shares and inflation", Journal of Macroeconomics, vol. 33(2), pp.121-136.
Nickell, S., 1999, "Product markets and labour markets", Labour Economics, vol. 6(1), pp. 1-20. OECD, 2004, Employment Outlook, Chapter 2.
OECD, 2014, Employment Outlook.
Prados de la Escosura, L. and J. Rosés, 2003, “Wages and Labor income in history: A Survey” Universidad de Madrid working paper series n. 6. Getafe.
Schneider, D., 2011, “The Labor Share: A review of theory and evidence” Humboldt-Universität zu Berlin SFB 649, Discussion Paper 2011-069.
Traxler, F. and B. Kittel, 2000, “The Bargaining System and Performance. A comparison of 18 OECD Countries”, Comparative Political Studies, vol. 33(9), pp. 1154-1190.
Visser, J., 2006, “Union Membership Statistics in 24 Countries”, Monthly Labor Review, pp.38-49.
Young, A. T. and H. Zuleta, 2011, “Do Unions Increase Labor’s Shares? Evidence from US Industry-Level Data”,http://ssrn.com/abstract=1942314 or http://dx.doi.org/10.2139/ssrn.1942314
Notes to the text
1 One exception is Blanchard, Giavazzi (2003) as discussed in the review of the literature section.
2 We do not include “unemployment subsidies” in the analysis, as this is a “passive” labor market policy, sometimes strictly dependent on the ALMP. In Scandinavian countries, for example, unemployed people receive subsidies conditional to entering active labor programs, such as
training and job search since the first day of unemployment.
3 The measure of employment protection, developed by OECD back in 1999, is mainly based on legislative provisions, but it also incorporates some aspects of contractual provisions and judicial practices. Provisions regarding fixed-term contracts and temporary work agencies are also
considered. This component of the EPL index is intended to measure the restrictions on the use of temporary employment by fir ms, the type of
work for which these contracts are allowed and their duration. OECD built also a separate index for the latter component of EPL.
4 Coordination and centralization of the wage bargaining process are also important factors in country classification. There is an extensive literature about the possible “hump-shape” hypothesis relating the degree of wage centralization and market performance. There is no evidence of such relations in the data; however, given poor measurement approximations of the coordination systems across countries and time, e.g. the
existing measures not taking imperfect competition in product and labor markets into account. See for example Traxler and Kit tel (2000) for a
thorough discussion of this topic. Given lack of updated data on these measures, we are not using such variable in our analysis.
5 Bargaining coverage, instead, captures the ability of unions in defending minimum labor standards and employment protection ( Visser, 2006). This measure is therefore positively correlated to our EPL index and is not used in our analysis.
6 Starting in 2002, OECD adopted a new classification and definition of labor market programs, which changed the types of progr ams to include according to Eurostat (2006). For the OECD countries belonging to EU and for Norway, these expenditures were re-classified going back to 1998,
our first year of observation. See Grubb and Puymoyen (2008) for details.
7 Southern European countries adopted a “Mediterranean Model”, which employs more than 50% of welfare expenditure on pensions for the elderly.
8 The no-minimum-wage group includes Austria, Denmark, Finland, Iceland, Italy, Norway, and Sweden.
9 Anglo-Saxons are Australia, Canada, Iceland, Ireland, New Zealand, United Kingdom and USA; Southern Europeans include France, Greece, Italy, Portugal and Spain; Continentals include Austria, Belgium and Germany; Scandinavian countries are Denmark, Finland, Netherlands,
Norway and Sweden; New EU Members include Bulgaria, Czech- Republic, Estonia, Hungary, Poland and Romania. This classification is widely
used in the literature. Esping-Andersen (1990) proposed it first, and Ebbinghaus (2012) compared and enlarged different welfare state regimes in
OECD countries.
10 Information on these variables come from several OECD databases. Population approximates the size of markets in the empirical literature (see e.g. Guerriero, Sen, 2012).
11 The correlation between these two measures is 0.96 on average across countries. We then use U in the regression analyses.
12 As Bentolila, Saint-Paul (2003) emphasized, if total factor productivity is strictly capital augmenting, it should come out with the same sign as the capital/output ratio.