Investigating the origins of the Space-Number Association
PhD program in: Behavioral Neuroscience XXXII Cycle
Candidate: Advisor:
Michele Pellegrino Prof. Fabrizio Doricchi
1 Index
General Introduction
Initial investigations on the Mental Number Line………...4
The SNARC effect………...8
The Attentional-SNARC effect………...12
The Mental Number Line in patients with right brain damage………...17
Study 1: The Attentional-SNARC effect: a re-analysis of experimental evidences Introduction………22
Methods………..23
Results………....26
Discussion………..35
Study 2: Reconstructing the origins of the space-number association Introduction………..36
General method………38
Exp.1………42
Exp.2………47
Exp.3………....50
Comparing congruency effects among experiments………55
Assessing the influence of counting style direction in the whole sample of participants………56
Discussion……….57
Study 3: How to make “number lines” stable in the mind’s eye Introduction……….59
General method………...60
Exp.1………61
Exp.2………65
Exp.3………..…..70
Comparing congruency effects among experiments……….………….…….75
2
Study 4: How explicit must be the processing of contrasting numerical features to get the SNARC effect? Introduction……….79 General method…....………...80 Exp.1………82 Exp.2………85 Exp.3……….……….………..88
Comparing the SNARC effect among experiments……….………91
Discussion………92
General Discussion……….93
General Conclusions………...…97
3
General Introduction
Numbers are one of the most common elements in our day-to-day life. From checking the time on the clock to making more or less complex calculations, numbers are, together with letters, undoubtedly the most used symbols in our civilization. In particular, a number is defined as “a unit that forms part of the system of counting
and calculating” (Cambridge Dictionary, 2019). According to Butterworth (1999) we
are born to count, so it is not surprising that, in our brain, there is a specialized network designed to elaborate and encode number magnitudes. Moreover, phylogenetical and ontogenetical evidences demonstrated that, even before language development, infants are receptive to numerical information in their environment (Girelli et al., 2000). This innate ability has evolved in thousands of years, both in humans (Ifrah, 2000) and in other species (Dehaene et al., 1998).
The main aim of this thesis is to investigate one of the most intriguing and debated issues in the field of numerical cognition, which is the relation between the representation of numerical magnitudes and the representation of spatial information. In order to discuss thoroughly this field of research, in the first chapter I shall summarize the literature on this topic, while in the second and the third chapter I shall present a series of studies aimed at expanding our knowledge on the origins of the Space-Number Association (SNA).
4
Initial investigations on the Mental Number Line
The nature of the relation between number and space has always intrigued many philosophers and thinkers, but the firsts proper scientific studies dates back to the end of the 19th century when Sir Francis Galton, the famous anthropologist,
collected several introspective reports summarised in two Nature articles (Galton, 1880a and 1880b). In these studies, he described subjective reports of healthy adults, called number synesthetes, who, upon hearing or perceiving number-words, experienced vivid and spatially organised mental images of the ascending series of numbers, the so-called Mental Number Line (MNL; Restle et al., 1970). The form of the MNL was not constant among participants, for example in some cases the MNL was oriented in the horizontal direction while others reported vertically oriented MNL or MNL with alternating horizontal, vertical, diagonal, or curved segments. Despite these differences, all synesthetes reported the presence of landmarks, turns, breaks, “woolly lumps” or visual changes at points separating tens and hundreds on the MNL (Fig.1). In his second Nature paper (1880b), Galton made another important observation on the frame of spatial reference of the MNL. He noticed that, in some synesthetes, the MNL moved in synchrony with eye and head movements, thus suggesting its reliance on retinotopic and/or head centred coordinates, while, in others, it maintained an invariant position in mental space independently of the direction of eye and head movements. Galton called these visual schemes “Number
Forms” (NF; Galton, 1883). Jacques Bertillon confirmed these observations in three
different studies (Bertillon, 1880, 1881), in which the author reported that also healthy humans tend to organise spontaneously ordinal information like months of the year and days of the week in visual NF (see Eaglemann 2009, for an update on this issue).
5
Figure 1. Examples of NF as reported by synesthetes (Galton, 1880).
To re-investigate more systematically the pioneering observations reported by Galton, Seron and co-workers (1992) administered detailed questionnaires to a large
6
sample of 194 participants. This study showed that while the structure of NF varies among different participants (e.g. lines, grids, changes in colour and/or position of the first number), the form of NF was very consistent within each participant (e.g. each number occupied the same position and had the same shape). Moreover, participants reported that the mere perception of a number, be it heard, seen, or even imagined, could activate these NF automatically. This study highlights that representing numbers in NF is an usual and daily experience and that NF are not specifically limited to number sequences and might have instead developed for elements that, as in the case of numbers “constitute well-delineated sub-parts of the lexicon, are
sequentially organized and have been learned by rote in a conventional order during childhood” like the ordinal sequence of the months within the year and the days
within the week. Sagiv et al. (2006) confirmed these suggestions in an ensuing study. These authors tested selected samples of number/letter-colour and number/letter-taste synesthetes and non-synesthetes. This paper showed that NFs like the MNL are more prevalent in number/letter colour synesthetes and that the MNL tends to occur with visuo-spatial forms for other ordinal sequences (e.g. days, months, letters) “which
suggests that it is the ordinal nature of numbers rather than numerical quantity that gives rise to this particular mode of representation”.
Taken together, these results support the idea of the existence of an analogical representation of numerical information in which the magnitude or “quantity” of a given number is distributed on a Mental Number Line (Dehaene, 2003). This spatial component of the numerical cognition plays an important role, representing spatially the magnitude of numbers and their meaning. Although the presence of NF appears to be well established, the nature and the origin of this type of association between number and spatial information is still debated. These visual schemes are, in fact, subject to both neurobiological and cultural influences (Hubbard and Ramachandran, 2005). The presence of stable characteristics in the MNL seems to confirm a possible cultural influence on visual schemes. Several studies have suggested that the mental
7
representation of an ascending series of numbers runs from right in left-to-right reading cultures and vice versa in left-to-right-to-left reading ones (Dehaene et al., 1993; Shaki et al., 2009). This spatial representation is more pronounced when reading habits are the same for letters and numbers, like in western cultures, while it can be less pronounced in cultures where reading directions for words and numbers run opposite (Shaki et al., 2009). Moreover, the MNL does not strictly depend on visual experience, as this phenomenon occur both in sighted participants and in blind people who have acquired reading direction through the manual modality (for a review see Bottini et al., 2015).
8
The SNARC effect
Introspective reports of Number Forms stand as an important evidence in favour of the phenomenological interaction between number and space. Nonetheless the strongest empirical evidence for this interaction is, undoubtedly, the Spatial-Numerical Association of Response Codes effect (SNARC effect, Dehaene et al., 1993; for preliminary observations see also Dehaene et al., 1990). In these works, authors observed that in tasks requiring the choice between left and right motor responses to judge the parity (e.g. Parity Judgement, PJ: odd or even?) or the magnitude (e.g. Magnitude Comparison, MC: higher or lower than 5?) of Arabic numbers presented at central fixation, participants showed faster manual responses when left responses were associated to small numerical magnitudes and right responses to large numerical magnitudes rather than vice versa. Dehaene and colleagues (1993) described this effect as arising from the congruency or the incongruency between the position of motor responses and the position that numbers would inherently occupy on a MNL that is spatially organized in accordance to reading habits. In different control experiments these authors confirmed the presence of the SNARC effect with double-digits numbers and in left-handed participants (Dehaene et al., 1993), reinforcing the consistency of this effect. In the same work, the SNARC effect appeared to be linked to the position of the number relative to the numerical reference within the given interval and not, instead, to the absolute magnitude of the stimuli (e.g. the number 4 was responded faster with the left key within the interval 4-9 and faster with the right key within the interval 0-5). In addition, the SNARC effect was not influenced by the hand used for responses as the effect remained unchanged when participants switched hands and pressed the left key with the right hand and the right key with the left hand.
Ensuing studies showed that the SNARC effect was not influenced by the type of motor response (i.e. saccades or indicating the display; Fischer et al., 2004; Schwarz and Keus, 2004) or by the format of numerical stimuli (i.e. Arabic, verbal or
9
visual notation; Nuerk et al., 2005). It is worth noting that both the PJ and MC version of the SNARC task require the processing of relevant numerical information. When this numerical information is not task relevant (e.g. when participants had to judge the colour of a number-word), the task fails to elicit a significant SNARC effect. In other words, a non-numerical task does not activate the numerical representation and the association with a spatial representation is impossible (Fias, 2001; Fias et al., 2001). One key evidence in the study of the SNARC effect is that it is heavily influenced by cultures reading habits. In the first pioneering study, Dehaene and colleague (1993) administered the PJ task to Iranian participants, who read and write from right to left, and found that, in this case, the direction of the SNARC effect was reversed (i.e. differently from participants from western left-to-right reading cultures, Iranian participants responded faster with the left-to-right key when small number appeared and faster with the left key when large number were displayed). This dependency from cultural habits has also been confirmed in several other studies carried out on different populations like Arabian, Arabian-English (Zebian, 2005) and Japanese participants (Ito and Hatta, 2004).
Different functional interpretations of the SNARC effect situated the genesis of this effect at different points along the processing continuum that ranges from the mere perception of numerical magnitude to the selection of motor responses associated with task-relevant number stimuli (Cohen Kadosh et al., 2008; Wood et al., 2008; van Dijck et al., 2015; Fattorini et al., 2016). Dehaene and colleagues (1993) proposed the first and original interpretation of the SNARC effect. This interpretation puts forward the idea that the spatial position of a number along the MNL would be inherent to the semantic representation of the same number. In other words, “numbers automatically elicit task-, modality- and effector-independent
spatial representations, even when these spatial representations are not strictly relevant to the task” (Hubbard et al., 2005). According to this interpretation the
10
responses can be congruent or incongruent with the position that numbers would inherently occupy in the mental space (independently of the fact that spatial codes are used or not for the selection of motor responses).
A second interpretation of the SNARC effect emphasises the role played by the culturally based association between conceptual pairings like “left/right” and “small/large” (Proctor and Cho, 2006; Santens and Gevers, 2008; Gevers et al., 2010). In particular, Proctor and Cho (2006) proposed that due to this acquired association, linking the concept “smaller than 5” to a “left” manual response and the concept “larger than 5” to a “right” response is easier, and thus faster than creating opposite associations. This interpretation has been also supported by a study from Gevers and colleagues (2010). In this study the authors showed that the SNARC effect is connected to the verbal-spatial labels given to response keys rather than to the actual key position (e.g. when the key on the left side is labelled “right” and the key on the right is labelled “left”, the effect remains anchored to the label and not to the key side).
Another line of research emphasised the role played by response selection processes in the genesis of the SNARC effect. This third interpretation sees the mental left-to-right organization of number magnitudes as induced by the contrasting “left vs. right” spatial codes that must be used in the selection of motor responses associated with number magnitudes (Keus and Schwarz, 2005; Ishihara et al., 2006; Müller & Schwarz, 2007; Fattorini et al., 2015). More recently, two studies (Herrera et al. 2008; van Dijck et al. 2009) showed an involvement of the working memory in the genesis of this effect. In particular, the SNARC effect disappeared when spatial or phonological information were retained in the working memory during the task. Starting from these results van Dijck and colleagues (van Dijck and Fias 2011; van Dijck et al. 2014) thus proposed that spatial working memory might play a relevant role in the SNARC effect. These authors consider this effect as the outcome of a temporary and flexible association between the representation of number magnitude
11
and the representation of spatial information occurring at the level of the working memory. In particular, van Dijck e Fias (2011) reported that, when participants had to memorize a short random sequence of five numbers from 1 to 10 before performing a PJ task, the spatial position occupied by the numerical magnitude inside the sequence managed to influence the appearance of the SNARC effect, independently of the number magnitude presented (e.g. the target number placed at the beginning of the sequence speeded up responses to the left side of space and, vice versa, numbers placed at the end of the sequence speeded up responses to the right side of space).
In summary, despite different interpretations of the functional origin of the SNARC effect, this effect remains undoubtedly one of the strongest evidences in favour of an interaction between the representation of numerical magnitude and the representation of spatial information (van Dijck et al., 2012; Fischer and Shaki, 2014, Fattorini et al., 2016).
12
The Attentional-SNARC effect
In 2003, Fischer and colleagues reported a series of experimental observations that seemingly provided support to the hypothesis of an inherent link between spatial and numerical information. In two experiments, performed on a sample of 15 and 10 participants respectively, these authors observed that, in a task requiring central uni-manual responses to targets presented in the left or in the right side of space, participants were faster to respond when left-side targets were preceded by small Arabic numbers (i.e. 1 or 2) and, in a similar way, when right-side targets were preceded by large Arabic numbers (i.e. 8 or 9). Since participants were informed that numerical magnitude were irrelevant to target detection and did not predicted target location, this result seems to suggest that the mere perception of numbers automatically shift spatial attention congruently with the hypothetical position occupied by numbers on the MNL (e.g. small numbers could elicit leftward attentional shifts and large numbers shift participant’s attention toward the right side of space). This effect has been called the Attentional-SNARC effect (Fig. 2).
13
During the last 16 years since the initial observation of Fischer and colleagues (2003), different investigations provided conflicting results and interesting insights on the experimental conditions that might induce the appearance of the Attentional-SNARC task (for two reviews highlighting different point of views see Fattorini et al., 2016 and Toomarian and Hubbard 2018).
The first authors that tried to replicate this effect were Ristic and co-workers (2006) and Galfano and colleagues (2006). These studies respectively highlighted that the Attentional-SNARC effect could be reversed by asking participants to imagine a reversed MNL (e.g. MNL running from right-to-left rather than from left-to-right) or by asking them to shift voluntarily their attention to the left in response to large numerical magnitude and to the right when small numbers appeared. Both studies suggest that the Attentional-SNARC effect is far from being automatic and could be influenced by strategic top-down factor. In another study by Dodd and co-workers (2008) a significant effect was found only in one (500 ms) of the two (500 ms; 750 ms) cue-target intervals in which the Attentional-SNARC effect was originally observed (Fischer et al., 2003).
Several studies failed to replicate this effect (Salillas et al., 2008; Bonato et al., 2009; Jarick et al., 2009; Hubbard et al., 2009; Ranzini et al., 2009; Goffaux et al., 2012; van Dijck et al. 2014; Zanolie and Pecher, 2014; Fattorini et al., 2015; Schuller et al., 2015; Pinto et al., 2018), but some of these works seems to be especially important in evaluating the reliability of the Attentional-SNARC effect. In particular, van Dijck and colleagues (2014) faithfully used the original paradigm and, starting from the effect size of the original study (Fischer et al., 2003), estimated “a priori” the precise number of participants (31) needed to obtain an optimal statistical power (β = 0.90). Forty-three participants were examined and no Attentional-SNARC effect was found. In a similar way, Zanolie and Pecher (2014), using the original paradigm, highlighted that the Attentional-SNARC effect was not present, while a significant effect was present when participants had, after target detection, to judge if the
14
displayed numerical stimulus was higher or lower than 5. Unfortunately, this result was not replicated in a second series of re-test experiment in the same work. Finally, authors noted that no Attentional-SNARC effect was observed when participants had to discriminate if the stimulus was an even or odd number (Zanolie and Pecher, 2014). The issue of the reliability and replicability of the Attentional-SNARC effect was also investigated by Fattorini and colleagues in 2015 (Fattorini et al., 2015). In a sample of 60 participants, these authors investigated whether inter-individual variations in the strength of this effect were correlated with corresponding variations in the strength of the classical SNARC effect in PJ and MC tasks. Results showed no Attentional-SNARC effect while a significant and reliable SNARC effect was found in the same participants, most importantly, no correlation between Attentional-SNARC effect and the Attentional-SNARC effects was found.
The Attentional-SNARC effect has also been examined in a series of
“Event-Related Potentials” (ERP) studies (Salillas et al., 2008; Ranzini et al., 2009; Schuller
et al., 2015; Pinto et al., 2018). In particular, Ranzini and colleagues (2009) used a modified version of the original task, in which central arrow cues pointing left or right were intermixed with central numerical stimuli. This means that differently from Fischer and co-workers (2003), contrasting left/right spatial codes were alternated in the task set and might have contaminated the numerical coding of Arabic numbers. At electrophysiological level, cue and target related activity to numerical trials revealed a SNA, but this activity was weaker than the activity elicited by spatial arrows. These results are difficult to interpret since were obtained using a paradigm different from the original (Fischer et al., 2003) and because at the behavioural level no significant Attentional-SNARC effect was observed. In similar way, in the study by Salillas and co-workers (2008) participants had to perform a modified version of the original paradigm, in which the target remained on screen for longer (i.e. 700 ms) and responses were asked after a delay (1000 ms after target vs. as soon as possible in the original paradigm). The authors compared ERPs between
15
targets appearing at congruent or incongruent positions in relation to the magnitude of the central numerical stimuli and reported a significant SNA at the level of the P1 and P3 waves. According to authors, the modulation of the P1 component highlights an involvement of numerical magnitude processing in shifts of spatial attention, while the modulation of P3 component indicates the retainment, in the working memory, of the spatial representation elicited by the numerical stimulus. Unfortunately, also in this case, the interpretation of these results is uncertain because no matching Attentional-SNARC effect was documented (Salillas et al., 2008). Schuller and co-workers in 2015 evaluated, instead, number-related attentional shifts when participants performed a feature discrimination task on targets (e.g. after the usual central numerical stimulus, the lateral target appeared and participants had to discriminate its colour by pressing the corresponding response key with their index or middle finger). Electrophysiological results showed in the cue period, a significant modulation of the parietal-occipital N1 and P2p components related to numerical magnitudes (i.e. enhanced amplitude for small compared to large numbers) and a significant presence of typical preparatory attentional components (i.e. EDAN and ADAN). In the target-period, the P1 component was modulated in relation to the congruency between target spatial position and numerical magnitude in the parietal-occipital region. Similarly to the study of Ranzini and colleagues (2009), electrophysiological results reported by Schuller and co-workers (2015) were not matched with a corresponding significant Attentional-SNARC effect.
A similar problem to the aforementioned studies recurs in the fMRI study of Goffaux and colleagues (2012). In this study, authors did not find a significant Attentional-SNARC effect and there were no lateralized activations in parietal areas typically involved in leftward and rightward shifts of spatial attention, while lateralised activations were observed in occipital areas in response to small and large magnitude numbers.
16
Finally, in a recent study, Pinto and co-workers (2018) showed that when left/right codes are used to guide the mental positioning of numerical magnitudes to the sides of a central numerical reference (i.e. 5), the detection of visual targets is facilitated when they are presented at spatial positions corresponding to the side occupied by the number in the mental space is facilitated. At the behavioural level no Attentional-SNARC effect was found when, as in the original report by Fischer et al. (2002), numerical cues were passively perceived or when they were classified as a function of their magnitude (e.g. lower or higher than 5). At the electrophysiological level, the active mental positioning of numbers elicited an enhancement of a facilitatory brain activity in the hemisphere contralateral to the mental number position (i.e. Lateral Directing Attention Positivity, LDAP), and an enhancement of the early C1 component in response to lateral targets that were congruent with the magnitude of the numerical stimulus.
In summary, inquiries on the Attentional-SNARC effect do not provide reliable evidences on the presence and reliability of this effect and do not allow to reach unequivocal conclusions on the nature of this type of association between numerical magnitude and space representation. In this regard, results of an ongoing registered replication report from 17 different laboratories from all over the world (Colling et al., in press), will soon provide further important evidences on the Attentional-SNARC effect.
17
The Mental Number Line in patients with right brain damage
Observations in right brain damaged patients (RBD) with attentional neglect for the left side of space (Bisiach and Luzzatti, 1978) strongly influenced the debate on the relation between the representation of numerical information and the representation of spatial information. Patients with neglect are particularly interesting because, usually after a right parietal or frontal lesion, they show a deficit in orienting their attention toward the left side space (i.e. contralateral to the lesion side, Heilman et al., 1984). This deficit, although frequently associated to hemianopsia (Kooistra et al., 1989; Vallar et al., 1991), hemiplegia (Rode et al., 1992, 1998; Vallar et al., 2003) or hemianesthesia (Vallar et al., 1991, 1993; Smania et al., 1995; Bottini et al., 2005), is not dependent on primary motor or sensory related problems (Bisiach et al., 1986; Vallar et al., 1986), and it occurs even on an imaginative level (Guariglia et al., 1993). This peculiar pattern of impairments made possible investigating the relationship between spatial and numerical processing in the human brain.
In 2002, Zorzi and co-workers reported that, when patients with neglect are verbally asked to mentally set the midpoint of 3- 9-unit number intervals without using formal calculation, these patients show a pathological bias toward number higher than the true midpoint (e.g. for the interval “1-7” they say “7” instead of “5”). According to these authors, these findings demonstrate that the series of ascending numbers is “inherently” organized from left-to-right, so that neglect patients tend to omit smaller magnitudes in numerical intervals. In contrast with this conclusion, ensuing investigations found that this type of pathological numerical bias is dissociated both from neglect (Rossetti et al., 2004; Doricchi et al., 2005; 2009; Loetscher and Brugger, 2009; Loetscher et al., 2010; van Dijck et al., 2011; Aiello et al., 2012; Pia et al., 2012) and neglect severity (Doricchi et al., 2009; van Dijck et al., 2012; Aiello et al., 2013).
Starting from the well-established observations that neglect in imagery space can be dissociated from neglect in visual space (Guariglia et al., 1993), Aiello and
co-18
workers (2012) investigated whether the mental numerical bias suffered by RBD patients was linked to imagery rather than visual neglect. These authors compared the performance of patients in the conventional mental bisection of number intervals with a measure of imagery neglect (i.e. the O’Clock test). In this latter task, patients are required to mentally recollect the position of hours and minutes on a clock-face or to mentally compare the amplitude between clock-hands’ angles indicating different times within the right half (e.g. 2:20 versus 4:25) and the left half (e.g. 6:45 versus 7:40) of the clock-face. Aiello and co-workers (2012) found that the bias toward numbers higher than the true midpoint (i.e. supposedly a bias toward numbers positioned in the right side of number intervals) was correlated with a numerically equivalent though spatially opposed bias during the bisection of time intervals, where patients displayed a bias toward larger numerical magnitudes on the left side of the clock-face. These results suggest that, independently of spatial neglect (i.e. Attentional Hypothesis, Fig. 3) RBD patients suffer a non-spatial deficit in the abstract representation of the smallest numerical magnitudes, regardless of their left or right spatial positioning in mental space (i.e. Representational Hypothesis, Fig.3) (Aiello et al., 2012).
19
Figure 3. Two hypotheses in comparison (Aiello et al., 2012).
This conclusion was confirmed by an ensuing study (Aiello et al., 2013) which highlighted that during the mental bisection of number intervals, RBD patients show a pathological bias only with intervals belonging to the first decade, which is with intervals including the smallest numerical integers.
Based on these findings that suggest no inherent link between the pathological spatial-attentional and numerical biases suffered by RBD, Aiello and colleagues (2012) highlighted that an important source of evidence for interpreting the SNA, comes from studies that tested the performance of RBD patients in the SNARC task. In contrast to studies that examined patients’ performances in the mental bisection of number interval, studies using the SNARC task homogenously highlighted that patients with neglect show slower reaction times (RTs) for number magnitudes that are immediately lower than the numerical reference (e.g. 4 relative to 5) as compared with numbers that are immediately higher than the same reference (e.g. 6 relative to 5; Vuilleumier et al., 2004; van Dijck et al., 2012; Zorzi et al., 2012). Aiello and colleagues (2012) pointed out that a crucial difference between the mental bisection of number intervals and the SNARC task is that in the former no use of left/right
20
spatial response codes is required, while the latter requires an explicit and direct association between these codes and number magnitude or parity. This led Aiello and colleagues (2012) to hypothesize that the left-to-right arrangement of numbers is not inherent to numerical magnitudes and that it is rather elicited by the use of left/right response or conceptual codes in the task at hand.
It is important to note that a fMRI study (Harvey et al., 2013) also support the dissociation between the representation of space and the representation of numerosity. Harvey and co-workers (2013) showed that the topographically organised representation of small numerical magnitudes, found in the right superior parietal cortex, is functionally and anatomically dissociated from neural populations that are responsible for shifts of spatial attention (Fig.4). This finding further supports the idea that the association between number and space representation is contextually linked to task requests rather than be hard-wired in the brain.
21
Figure 4. Topographic representation of numerosity. (A) The variance explained by the model (R2)
highlighted a region in the right parietal cortex where neural populations demonstrated numerosity tuning in all stimulus conditions. The black square is enlarged in (B). (B) Numerosity preferences for data averaged from all stimulus conditions, showing preferred numerosity increasing from the medial to lateral ends (white lines) of the region of interest (ROI) (black and white lines). (C) Numerosity preference progression from medial to lateral along the ROI for all conditions. All recording sites were organised by their distances from the two white lines (Harvey et al., 2013).
In summary, despite many hypotheses have been proposed about the origin of the SNA, there are still several open questions concerning the stability and nature of this association. The present thesis will seek to provide evidences on the different experimental conditions, and, thus mechanisms, that might subtend the SNA. In particular, the main theoretical hypothesis of the present work derives from the conclusions drawn by Aiello et al. (2012). These authors have argued that the left-to-right mental spatialization of numerical magnitudes is neither automatic nor inherent to the semantic representation of numbers and that it is rather elicited by the use of left/right response or conceptual codes in the task at hand. In order to support this hypothesis, in Study 1 I shall highlight how, in the absence of a task-relevant association between conceptual or response codes and numerical magnitude, no SNAs is elicited in an Attentional-SNARC task (Fischer et al., 2003). In Study 2 I shall demonstrate that spatial and numerical-magnitude “concepts” must be used concomitantly to elicit a significant SNA. In Study 3 the nature of this interaction will be investigated more thoroughly, to show how the reliability and stability of the SNA is modulated by the explicit or implicit combination of spatial and numerical-magnitude codes. Finally, in Study 4, the findings of Study 2 and 3 will be expanded to the study of conventional SNARC effects.
22
Study 1: The Attentional-SNARC effect: a re-analysis of experimental
evidences
Introduction
To this day, the Attentional-SNARC effect still remain a potentially important, yet conflicting, piece of evidence for the inherency of SNAs. The aim of this study is to re-evaluate the consistency and reliability of the Attentional-SNARC effect through a re-analysis of data gathered from different investigations performed in the Experimental Neuropsychology and Cognitive Neuroscience laboratory (Sapienza University in Rome), performed with similar procedure and stimuli in a total sample of 174 participants (Fattorini et al., 2015; Fattorini et al., 2016, Pinto et al., 2018). In addition, in a subsample of 79 participants it will be investigated whether the Attentional-SNARC effect is influenced by inter-individual variations in finger counting style, imagery vividness and verbal/visual learning style.
The possible influence of finger counting style, (i.e. the preference of start counting with the left or the right hand) was first suggested by Fischer and Knops (2014) to explain the discrepancy between the significant Attentional-SNARC effect found in the original study by Fischer et al. (2003) in Canadian participants and the negative results reported by Zanolie and Pecher (2014) in Dutch participants. Based on observations by Lindemann and co-workers (2011), Fischer and Knops (2014) advanced the hypothesis that these findings are due to the fact that in Canada finger counting is more left-associated compared to Holland. In the same study, they reported that the counting preference of Italian participants was more equally distributed between left and right starters (i.e. around 50% in both cases). For this reason, should be interesting to test the role of finger counting style on the strength and direction of the Attentional-SNARC effect in Italian participants.
Moreover, since the first studies on space-number interactions (Galton, 1880a, 1880b; Bertillon, 1880, 1881) seems to be evident that, constructing a vivid mental
23
image plays an important role in generating a spatially organised MNL. However, the relationship between inter-individual variations in the vividness of visual imagery and the automaticity of the SNA, which should be highlighted in the Attentional-SNARC task, has never been formally tested. Therefore, another aim of this study is to investigate, using the Vividness of Visual Imagery Questionnaire (VVIQ, Marks, 1973) and the Verbal and Visual Learning Styles Questionnaire (VVQ, Kirby et al., 1988), whether the vividness of visual imagery and/or the prevalence of visual over verbal learning strategies modulates the strength of the Attentional-SNARC effect.
Method
Participants
One hundred and seventy-four right-handed healthy students (105 females, 69 males; mean age = 22.6 years, SD = 2.1 years) from the University “La Sapienza” in Rome were tested with the Attentional-SNARC task. These participants come from the whole samples of participants considered in Fattorini et al. (2015), Fattorini et al. (2016), Pinto et al. (2018) and from 26 participants to an ongoing fMRI study. All participants had normal or corrected to normal vision and were naive to the experimental hypothesis. Within one week from the completion of experimental sessions, all participants were contacted again and asked to complete finger counting style, imagery vividness and visual-verbal learning style questionnaires. Seventy-nine participants accepted to complete these questionnaires.
Apparatus
All experiments were performed in a sound attenuated room with dim illumination. Stimuli were presented on a 15-inch-color VGA monitor. An IBM-compatible PC running MATLAB software controlled the presentation of stimuli and
24
the recording of responses. Participants had their head positioned on a chin rest at a viewing distance of 57.7 cm from the screen.
Assessment of counting direction style, imagery vividness and learning styles.
All questionnaires were administered individually. Counting direction style was assessed using the same method of Lindemann and colleagues (2011). Participants were asked to count from 1 to 10 using both hands and then report in which order they used fingers to count. The Vividness of Visual Imagery Questionnaire (VVIQ, Marks, 1973), provided measures of imagery vividness. Participants were asked to visualize four different mental images and then report how well they managed to visualize four different parts of these images using a Likert scale ranging from 1 (no image) to 5 (perfect and clear image). Total score range was 1-20. Individual learning preference was assessed through the Verbal and Visual Learning Styles Questionnaire (VVQ, Kirby et al., 1988). Participants had to judge 20 statements (10 for the Verbal scale and 10 for the Visual scale) using a Likert scale ranging from 1 (total disagreement) to 5 (total agreement). Each participant obtained one score on the Verbal preference scale and one score on the Visual preference scale. Score range for both Verbal and Visual learning style was 1-50.
The Attentional-SNARC effect
All participants were required to give unimanual speeded responses to attentional targets that were randomly flashed to the left or to the right of a central fixation cross. Lateral targets were preceded by a small- (1, 2) or a large-magnitude (8, 9) Arabic digit-cue that was presented at fixation. Digit cues did not predict target side and each digit-cue was followed by a target in the left side of space in 50% of trials and by a target on the right side in the remaining trials. No active cognitive processing of the digit-cue was required to participants (Fischer et al., 2003).
25
Each trial started with the 500 ms presentation of a central fixation cross (0.4° × 0.4°) together with two lateral boxes (1° × 1°). One box was centred 5° to the left and the other 5° to the right of central fixation. At the end of this period, one out of four digit-cues (i.e., 1, 2, 8, or 9; size: 0.8° × 0.6°) was presented for 300 ms at central fixation. Cue presentation was followed by a 500 ms or 750 ms cue-target interval (CTI). At the end of the CTI a white asterisk-target (0.5° × 0.5°) was randomly presented inside one of the two lateral boxes for 100 ms.
Participants signalled as soon as possible target detection by pressing with the right index finger the central bar of a computer keyboard. In the re-analysis of data reported in the present study, we only considered RTs observed with 500 ms and 750 ms CTI, because in the original study by Fischer and co-workers these CTIs were those at which the Attentional-SNARC effect was maximal.
Statistical analyses
The Attentional-SNARC effect was initially assessed in the entire sample of 174 participants, using two methods. First, by entering individual mean RTs in a Digit-Cue (Small Numbers, Large Numbers) × Target-Side (Left, Right) × CTI (500, 750 ms) ANOVA. Second, using regression analyses (Lorch and Myers, 1990). In this case, individual differential RTs (dRTs) were calculated by subtracting the average RTs recorded in trials with left-side targets from average RTs recorded in trials with right-side targets. Then, individual linear regression slopes were estimated using digit magnitude as the predictor variable and dRTs as the criterion variable (Fattorini et al., 2015). Using this method, a negative slope that differs significantly from zero highlights a significant Attentional-SNARC effect (Fias et al., 1996; Ito and Hatta, 2004). Bayesian hypothesis testing was performed using JASP (JASP Team 2018) (version 0.10.2.0). Bayesian analyses (one sample t-test) were run using individual linear regression slopes tested against 0. Since the interest in testing how
26
much the null-hypothesis was favoured against the alternative one, only BF01 values provided by JASP were reported. The directional prediction for this type of analysis was that the individual linear regression slopes would have been significantly lower than 0.
For each questionnaire, the whole group of participants that completed the questionnaires was split in two subsamples. For finger counting style, participants were split into subsamples of those having left-to-right and those having right-to-left preference. For imagery vividness, individual scores were calculated and then, based on the median score of the whole sample, participants were classified into subgroups with “high imagery vividness” (i.e. participant with scores higher than the group median score) and “low imagery vividness” (i.e. participants with scores lower than the group median score). Visual and verbal learning scores were analysed separately. For each learning style, based on the median score of the whole group, participants were classified as having “high” or “low” scores. In this way, participants were subdivided in subgroups with high or low visual learning style and subgroups with high or low verbal learning style.
For each questionnaire, the Attentional-SNARC effects observed in each of the two subsamples were compared through a series of Group × Digit-Cue (Smaller, Larger) × Target-Side (Left, Right) × CTI (500, 750 ms) ANOVAs and by contrasting the average slope values of each subgroup through two-tailed t-tests. Finally, correlations between the strength of the Attentional-SNARC effect and scores in the VVQ and VVIQ were analysed.
Results
The Attentional-SNARC effect
In the whole sample 174 of participants, the Digit-Cue (Small Numbers, Large Numbers) × Target-Side (Left, Right) × CTI (500, 750 ms) ANOVA highlighted no
27
significant Attentional-SNARC effect [Digit-Cue × Target-Side interaction: F (1, 173) = 1.41, p = .24, ηp2 < .01]. CTI had no influence on Attentional-SNARC effect
[Digit-Cue × Target-Side × CTI interaction: F (1, 171) = 0.38, p = .54, ηp2 < .01]
(Fig. 5A and5B). In addition, a significant difference was found with the CTI [F (1, 173) = 7.87, p < .01, ηp2 = .05]. In particular participants obtained faster RTs in the
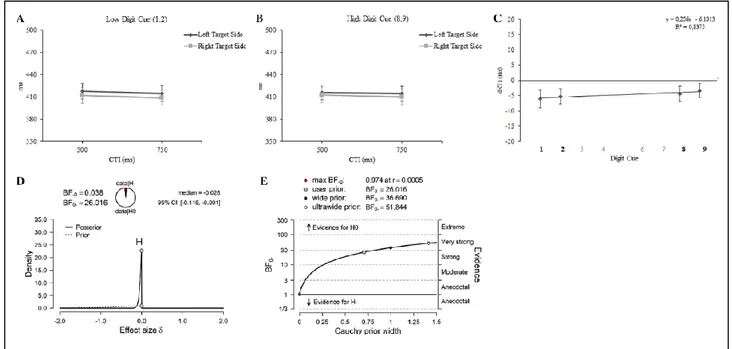
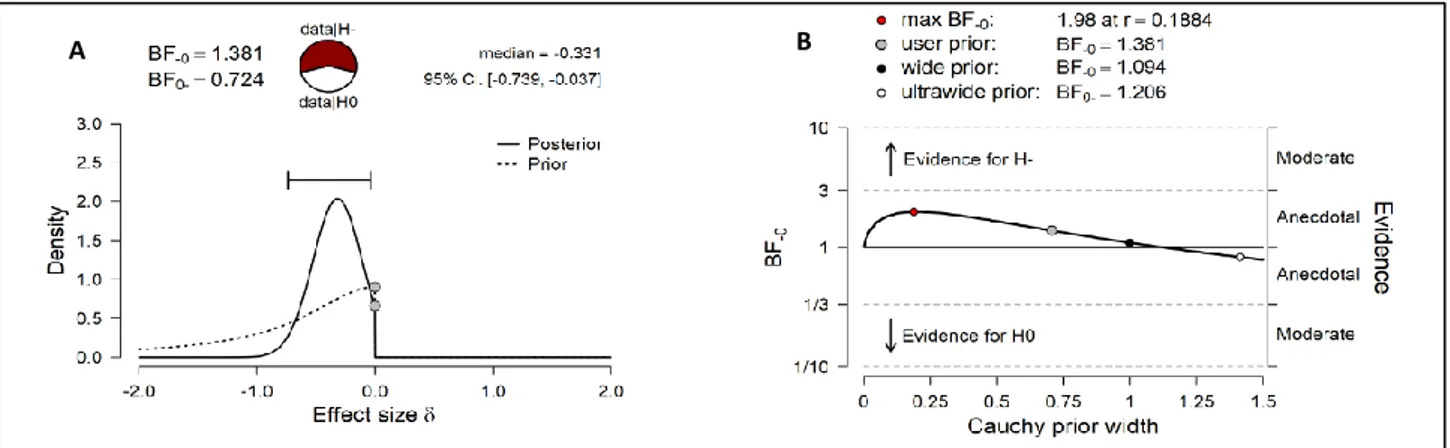
750 conditions (412 ms) compared to 500 (415 ms). No other main or interaction effects were statistically significant (all p > .40). One-sample t-test showed that in the entire sample of 174 participants, the dRTs regression slope was not significantly different from zero [t (173) = 1.30, p = .21; average = .26, SD = 2.59; Fig. 5C]. The Bayesian one-sample t-test showed a BF01 of 26.02, indicating that the null hypothesis is 26.02 more favoured than the alternative one, thus confirming the absence of the Attentional-SNARC effect. An illustration of the effects of assigning a range of different prior distributions (i.e., a Bayes factor robustness check) is presented in Fig. 5D and 5E. The absence of the Attentional-SNARC effect was also observed in the sample of 79 participants that accepted to complete the questionnaires [Digit-Cue × Target-Side interaction: F (1, 77) = 3.42, p = .07, ηp2 = .04; Regression
slope: t (78) = 1.24, p =.22; average = .37, SD = 2.67]. No other main or interaction effects were statistically significant (all p > .12). The Bayesian one-sample t-test showed a BF01 of 17.08, suggesting that the null hypothesis is 17.08 more favoured than the alternative one.
28
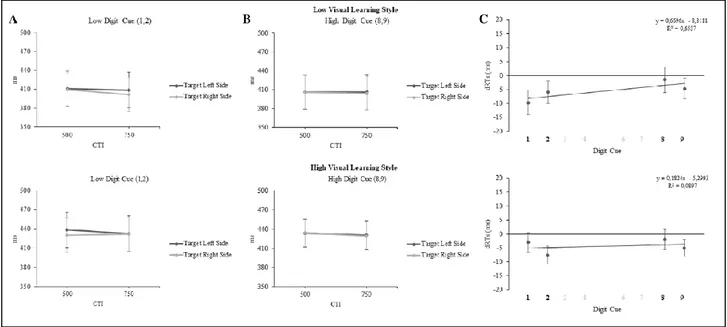
Figure 5. All participants. Average RTs (with SE) to targets presented in the left and right sides of space
plotted as a function of the magnitude of central digit-cues (i.e. (A) Low or (B) High) and Cue–Target Interval. (C) Slope describing the difference between RTs to targets in the right side of space minus targets in the left side of space (dRTs in ms), plotted as a function of the magnitude of central digit-cues. (D) The prior and posterior distribution plot for a directional analysis of linear regression slopes. (E) Bayesian analysis of linear regression slopes: a robustness check illustrating the effects of assigning wide and ultrawide Cauchy prior widths on Bayes factor values.
Finger Counting Style
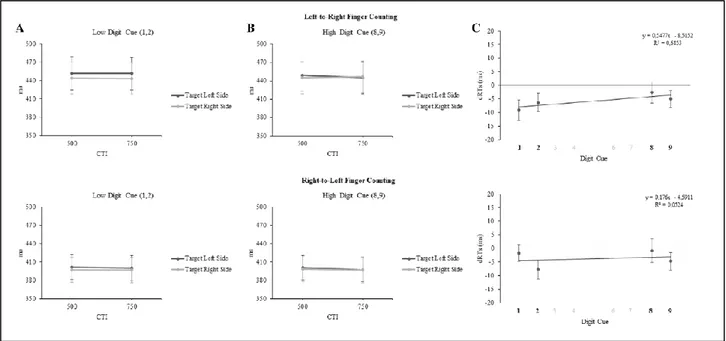
Forty-two participants showed left-to-right preference and thirty-seven showed right-to-left preference. Both the Group × Digit-Cue × Target-Side interaction [F (1, 77) = 1.64, p = .20, ηp2 = .02] and the Group × Digit-Cue × Target-Side × CTI
interaction [F (1, 77) = 0.34, p = .85, ηp2 < .01] were not significant (Fig. 6A and 6B).
These results show no Attentional-SNARC effect in both groups and no influence of finger counting style on this effect. No other main effect or interaction was statistically significant (all p > .22). These conclusions were also confirmed by regression [Group Left-to-Right: t (41) = 1.20, p = .23; average = .54, SD = 2.93; Group Right-to-Left: t (36) = .45, p = .65; average = .18, SD = 2.35; comparison
29
between two groups: t (77) = .61, p = .54; Fig. 6C] and Bayesian analyses [Group Left-to-Right: BF01 of 12.30; Group Right-to- Left: BF01 of 7.75].
Figure 6. Finger counting style. Average RTs (with SE) to targets presented in the left and right sides of
space plotted as a function of the magnitude of central digit-cues (i.e. (A) Low or (B) High) and Cue–Target Interval. (C) Slope describing the difference between RTs to targets in the right side of space minus targets in the left side of space (dRTs in ms), plotted as a function of the magnitude of central digit-cues. In the upper panel, are reported the results of participants with left-to-right finger counting style (N = 42), while in the lower panel are reported the results of participants with right-to-left finger counting style (N = 37).
Vividness of Visual Imagery Questionnaire (VVIQ)
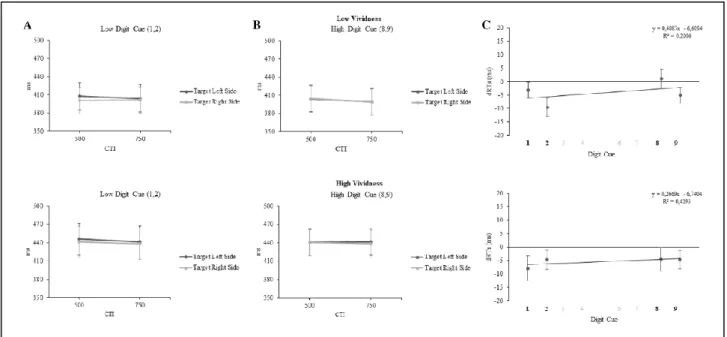
Forty-one participants showed low imagery vividness (Mean score = 3.5) and thirty-eight high imagery vividness (Mean score = 4.4) with respect to the median score of 4. Both the Group × Digit-Cue × Target-Side interaction [F (1, 77) = .59, p = .44, ηp2 = .02] and the Group × Digit-Cue × Target-Side × CTI interaction [F (1, 77)
= .01, p = .99, ηp2 < .01] were not significant (Fig. 7A and 7B). These results show no
Attentional-SNARC effect in both groups and no influence of imagery vividness on this effect. No other main effect or interaction was statistically significant (all p >
30
.11). These conclusions were also confirmed by regression (Group Low Vividness: t (40) = .56, p = .57; average = .27, SD = 3.03; Group High Vividness: t (37) = 1.34, p = .19; average = .49, SD = 2.25; comparison between two groups: t (77) = .36, p = .71; Fig. 7C] and Bayesian analyses [Group Low Vividness: BF01 of 12.39; Group High Vividness: BF01 of 8.69].
Figure 7. Vividness of Visual Imagery Questionnaire. Average RTs (with SE) to targets presented in the left
and right sides of space plotted as a function of the magnitude of central digit-cues (i.e. (A) Low or (B) High) and Cue–Target Interval. (C) Slope describing the difference between RTs to targets in the right side of space minus targets in the left side of space (dRTs in ms), plotted as a function of the magnitude of central digit-cues. In the upper panel, are reported the results of participants with low imagery vividness (N = 41), while in the lower panel, are reported the results of participants with high imagery vividness (N = 38).
Verbal and visual learning style Questionnaire (VVQ)
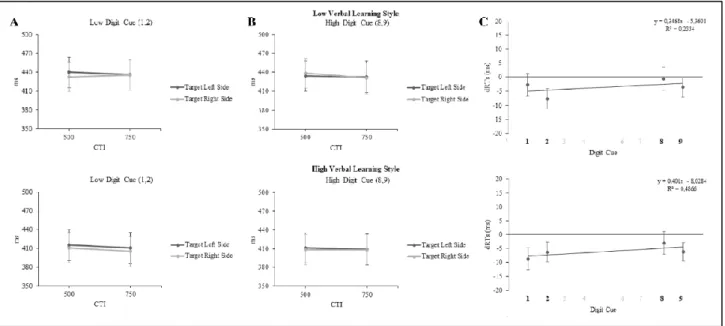
Forty participants showed low scores in verbal learning style (Mean score = 26.7) and thirty-nine high scores (Mean score = 31.8; median group score = 30). Both the Group × Digit-Cue × Target- Side interaction [F (1, 77) = .35, p = .56, ηp2 = .004]
and the Group × Digit-Cue × Target-Side × CTI interaction [F (1, 77) = 3.29, p = .07, ηp2 = .04] were not significant (Fig. 8A and 8B). These results show no
Attentional-31
SNARC effect in both groups and no influence of the verbal learning style on this effect. No other main or interaction was statistically significant (all p > .10). These conclusions were also confirmed by regression (Group Low: t (39) = .97, p = .34; average = .35, SD = 2.27; Group High: t (38) = .81, p = .82; average = .40, SD = 3.06; comparison between two groups: t (77) = -.038, p = .97; Fig. 8C] and Bayesian analyses [Group Low: BF01 of 10.72; Group High: BF01 of 9.76]. In line with these results, the analysis performed using questionnaire score as a continuous predictor variable showed no significant Verbal-Score × Digit-Cue × Target- Side interaction [F (1, 77) = .08, p = .78, ηp2 < .01].
Thirty-one participants showed low scores in visual learning style (Mean score = 25.8) and forty-eight participants high scores (Mean score = 31.8; median group score = 30). Both the Group × Digit-Cue × Target-Side interaction [F (2, 76) = .52, p = .60, ηp2 = .01] and the Group × Digit-Cue × Target-Side × CTI interaction [F (1,
77) = .04, p = .83, ηp2 < .01] were not significant (Fig. 9A and 9B). These results
show no Attentional-SNARC effect in both groups and no influence of the visual learning style on this effect. No other main or interaction was statistically significant (all p > .11). These conclusions were also confirmed by regression [Group Low: t (30) = 1.36, p = .18; average = .97, SD = 2.74; Group High: t (47) = .48, p = .63; average = .18, SD = 2.63; comparison between two groups: t (77) = .79, p = .43; Fig. 9C] and Bayesian analyses [Group Low: BF01 of 11.30; Group High: BF01 of 8.90].
32
Figure 8. Verbal learning style. Average RTs (with SE) to targets presented in the left and right sides of
space plotted as a function of the magnitude of central digit-cues (i.e. (A) Low or (B) High) and Cue–Target Interval. (C) Slope describing the difference between RTs to targets in the right side of space minus targets in the left side of space (dRTs in ms), plotted as a function of the magnitude of central digit-cues. In the upper panel, are reported the results of participants with low verbal learning style scores (N = 40), while in the lower panel, are reported the results of participants with high verbal learning style scores (N = 39).
33
Figure 9. Visual learning style. Average RTs (with SE) to targets presented in the left and right sides of
space plotted as a function of the magnitude of central digit-cues (i.e. (A) Low or (B) High) and Cue–Target Interval. (C) Slope describing the difference between RTs to targets in the right side of space minus targets in the left side of space (dRTs in ms), plotted as a function of the magnitude of central digit-cues. In the upper panel, are reported the results of participants with low visual learning style scores (N = 31), while in the lower panel, are reported the results of participants with high visual learning style scores (N = 48).
Correlations analyses
In these analyses, Pearson-r correlations between individual slopes defining the strength of the Attentional-SNARC effect and individual data results in the VVIQ and in the VVQ were evaluated (Table 1). Correct application of these analyses requires the assumption of multivariate normality (Barbaranelli, 2007; Raykov and Marcoulides, 2012). The Mahalanobis Distance was smaller than the critical value (all p > .001, critical value recommended by Tabachnick et al. 2007) showing that in this set of data no uni- or multivariate outliers were present. In addition, variables distribution was comparable to a multivariate normal (Mardia's multivariate kurtosis index = 13.1; p = 24; Mardia, 1970, 1974). No correlation was found between the Attentional-SNARC effect and the VVIQ or the VVQ (all p >.43; Table 1). In
34
addition, no significant correlation was found among the scores of the different questionnaires (all p > .14, see Table 1).
Table 1. Correlations among the Attentional-SNARC effect, the Vividness of Visual Imagery (VVIQ), and
the Verbal and Visual learning styles (VVQ) (Pearson’s r coefficient) in the subsample of participants (N = 79) with lower and upper limits of 95% Confidence Intervals inside parentheses (p value below).
35
Discussion
These results confirm those of several other studies in which no significant Attentional-SNARC effect was found. In addition, finger counting style, imagery vividness and the verbal/visual learning style did not have any influence on the presence and consistency of this effect. The automatic and implicit connection between the representation of space and the representation of number magnitude appears to be non-existent in behavioural conditions where, like in the Attentional-SNARC task, the use of spatial response codes is not required. Taken together, these results are in agreement with previous findings in RBD patients (Doricchi et al., 2005; Doricchi et al., 2009; Aiello et al., 2012; Aiello et al., 2013) and in healthy participants (Rotondaro et al., 2015; Fattorini et al., 2015; Pinto et al., 2018) and in line with the aforementioned neuroimaging investigation (Harvey et al. 2013), that showed the lack of overlap between the neural representation of numerosity and that of space in the human parietal cortex.
Given the absence of an inherent and automatic association between space and numbers, an intriguing interrogative remains without a definitive answer: what is the origin of reliable SNAs as the one highlighted, for example, by the SNARC effect?
36
Study 2: Reconstructing the origins of the space-number association
Introduction
Another attempt to answer the previous question comes from a recent study by Fischer and Shaki (2017). These authors demonstrated that when left/right spatial codes are used in conjunctions with magnitude codes in instructions that regulate the release of unimanual Go responses to central small/large numerical and arrow-targets, a significant SNA is found. In particular, RTs are faster when, in task instructions, spatial codes are congruent with the position that numerical targets would occupy on a horizontally oriented MNL. These results showed that the same conceptual associations of spatial and magnitude codes that determine RTs advantages in response selection during the SNARC task can also produce these advantages during a unimanual Go/No-Go stimulus classification task that requires no contrasting spatial codes for response selection. Nonetheless this result comes from a task that still requires the joint use of spatial and magnitude codes. Therefore, to clarify the origins of the SNA, a fundamental question must be addressed: do contrasting spatial codes used in isolation inherently evoke the conceptual left-to-right representation of number magnitudes (i.e. Space-to-Number congruency effect) and, vice versa, do contrasting number-magnitude codes used in isolation inherently evoke the conceptual activation of contrasting left/right spatial codes (i.e. Number-to-Space congruency effect)?
To answer these questions, three experiments were performed using a Go/No-Go task in which in different trials small or large Arabic numbers were alternated at central fixation with left or right-pointing directional-arrows (Fig. 10).
37
Figure 10. Examples of two consecutive trials, one with a numerical-target and one with an arrow-target
(arrow pointing to the left in this case).
In Experiment 1 in different experimental conditions, participants were asked to: a) provide unimanual Go speeded detection responses only to small or to large numbers while responding, with the same response key, to all arrows independently of their direction; b) provide unimanual Go speeded detection responses only to left- or to right-pointing arrows while responding, with the same response key, to all numbers independently of their magnitude. If the isolated use of spatial codes elicits an automatic spatial representation of number magnitudes and/or the isolated use number-magnitude codes automatically triggers the activation of spatial codes, Space-to-Number and Number-to-Space congruency effects should be observed in both experimental conditions.
In Experiment 2, in order to expand the work of Shaki and Fischer (2018), participants had to perform a Go/No-Go colour discrimination task in which arrow-stimuli pointing to the left or to the right were both depicted with equal probability in one of the two target colours (i.e. blue or yellow) so that no specific association was present between an arrow-colour and an arrow-direction. This latter experimental manipulation aimed to verify whether a spatial code implicitly conveyed by
arrow-38
targets during each block could be sufficient to induce SNAs even when the aforementioned spatial code is not relevant to the task.
Finally, in Experiment 3, in order to replicate Fischer and Shaki (2017) the presence of significant Space-to-Number and Number-to-Space congruency effects were tested when spatial and magnitude-numerical codes were used jointly in the mental task set.
General method
Participants
Based on average effect sizes obtained by Shaki and Fischer (2018, Experiment 2), the number of participants that would have been needed to obtain a power of 0.89 with alpha set to 0.05 (two-sided) was estimated. A total sample size of 24 would be needed in each experiment (average Cohen's d=0.68). After signing an informed consent, a total of 72 students participated in the study (age 19–30 years).
Apparatus
All experiments were performed in a sound attenuated room with dim illumination. Stimuli were presented on a 15-inch-color VGA monitor. An IBM-compatible PC running MATLAB software controlled the presentation of stimuli and the recording of responses. Participants had their head positioned on a chin rest at a viewing distance of 57.7 cm from the screen. All participants had normal or corrected to normal vision and were naive to the experimental hypothesis of the experiment. Different samples of participants were included in the three experiments of the present study.
39
Assessment of handedness and counting direction style
All participants were right-handed and at the end of experimental sessions had to perform two tasks that tested their counting direction preference. In a first task (Fischer and Shaki, 2017), four identical black cardboard circles with a diameter of 4 cm were presented equally spaced in a linear array on a blank A4 piece of paper that was positioned in landscape format with its centre aligned to the head-body midsagittal plane of participants.
Each participant was asked to “count these circles aloud and touch each circle while counting.” No demonstration was given and the participant’s order of counting was recorded in a single trial by the experimenter as being directed either from left to right or vice versa. In a second task (Lindemann et al., 2011) each participant was asked to hold hands in front of her/his body/head and count aloud from one to ten, using fingers to count. Similarly, to the former task, the examiner scored whether the count proceeded from the left to the right hand or vice versa.
In all experiments, a series of analyses to investigate the possible influence of counting direction style on Space-to-Number and Number-to-Space congruency effects was performed. To this aim in each experiment, RTs performances were compared between two subgroups of participants who had left-to- right vs. right-to-left counting direction style.
Statistical analyses
Space-to-Number congruency effects were assessed by entering individual mean RTs in Congruency (Congruent: Left Arrow/Small Number & Right Arrow/Large Number, Incongruent: Right Arrow/ Small Number & Left Arrow/Large Number) × Number Magnitude (Small, Large) within-participants ANOVAs (Experiment 1 and Experiment 3). Number-to-Space congruency effects were investigated through
40
Congruency (Congruent: Small Number/Left Arrow & Large Number/ Right Arrow, Incongruent: Small Number/Right Arrow & Large Number/ Left Arrow) × Arrow direction (Left, Right) × Arrow colour (Yellow, Blue) within-participants ANOVAs.
Space-to-Number congruency effects were also investigated through the same type of regression analyses used in Study 1 (Lorch and Myers, 1990). Individual dRTs were calculated by subtracting RTs produced in response to Small and Large magnitude numerical targets when participants attended to Left pointing arrows from equivalent RTs produced when participants attended to Right pointing arrows. The magnitude of numerical targets was then used as predictor variable and dRTs as criterion variable. With this method, a significant negative slope highlights the presence of a significant Space-to-Number congruency effect (Fias, 1996; Ito and Hatta, 2004).
The reliability of Space-to-Number congruency effects that resulted significant in the ANOVAs was assessed using the split-half method. Average RTs for the odd and even half of the task and the two corresponding dRTs slopes describing the Space-to-Number congruency effect in each half of the task were calculated. Corrected Spearman-Brown correlations between the two sets of slopes were taken as an index of reliability. The reliability of Number-to-Space congruency effects that resulted significant in the ANOVAs was assessed by first calculating individual RTs advantages produced in the Congruent condition in the odd and in the even half of the task, i.e. RTs in the Incongruent Condition minus RTs in the Congruent Condition. Corrected Spearman- Brown correlations between the RTs advantages from the even and odd half of the task were used as index of reliability.
Space-to-Number congruency was investigated through regression analyses (Lorch and Myers, 1990), while Number-to-Space congruency was evaluated by computing RTs advantages produced in the Congruent condition (i.e. RTs in the Incongruent Condition minus RTs in the Congruent Condition).
41
Bayesian hypothesis testing was performed using JASP (JASP Team 2018) (version 0.10.2.0). Bayesian analyses (one sample t-test) were run testing individual linear regression slopes, in the case of Space-to-Number congruency, or congruency effects, in the case of Number-to-Space congruency, against 0. Since the interest in testing how much the alternative hypothesis was favoured against the null one, only BF10 values provided by JASP were reported. For the Space-to-Number congruency, the directional prediction for this type of analysis was that the individual linear regression slopes would have been significantly lower than 0. For the Number-to-Space congruency, the directional prediction was that the congruency effects would have been significantly higher than 0.
42 Experiment 1
Method
Participants
Twenty-four healthy right-handed student (16 females, 8 males; mean age=22.8 years, SD=2.9 years) from the University “La Sapienza” in Rome participated in the experiment. All participants showed left-to-right scanning in the inspection of linear arrays of four cardboard circles (Fischer and Shaki, 2017). On finger counting test (Lindemann et al., 2011), 11 participants showed left-to-right and 13 showed right-to-left preference.
Procedure
Each trial started with the 500 ms presentation of a central fixation cross (1.5° × 1.5°). At the end of this delay an Arabic number (1, 2, 8 or 9; size = 1.5° × 1°; font = Arial) or an arrow coloured in blue or yellow and pointing to left or to the right (size = 1.5° × 0.8°), replaced the central fixation cross. There was no specific association between arrow colour and direction, so that over the total number of trials both yellow and blue arrows pointed an equivalent number of times to the left or to the right. Target stimuli remained available for response for 2000 ms. The inter-trial interval was 500 ms. This timing of trial events is equivalent to that used in Shaki and Fischer (2018).
To investigate whether spatial codes used in isolation implicitly generate the left-to-right representation of number magnitudes or, vice versa, whether number-magnitude codes used in isolation implicitly trigger the conceptual activation of left/right spatial codes, each participant used the following four rules, that corresponded to four different experimental conditions, to provide Go/No-Go responses to numerical- or arrow-targets: a) press the spacebar if an arrow points to the left and whenever a number appears; b) press the spacebar if an arrow points to
43
the right and whenever a number appears; c) press the spacebar if the number is smaller than 5 and whenever an arrow appears; d) press the spacebar if the number is larger than 5 and whenever an arrow appears.
The four experimental conditions were administered during a single experimental session. The order of experimental conditions was counterbalanced among participants. The task was divided into 4 blocks of trials, each corresponding to a different experimental condition. Each block consisted of 256 trials, 128 with numerical-targets (i.e. 32 trials per Arabic number) and 128 with arrow-targets (32 trials per each of the four colour-direction combination). A short break was allowed between blocks. At beginning of the experimental session, participants performed a training session composed of 16 trials.
Results
Go trials in which no response was provided (misses) or in which RTs were above 1000 ms or below 100 ms were not included in the analyses. This procedure was applied to all the analyses summarized in the present study, 4.9% of trials were discarded from the analyses.
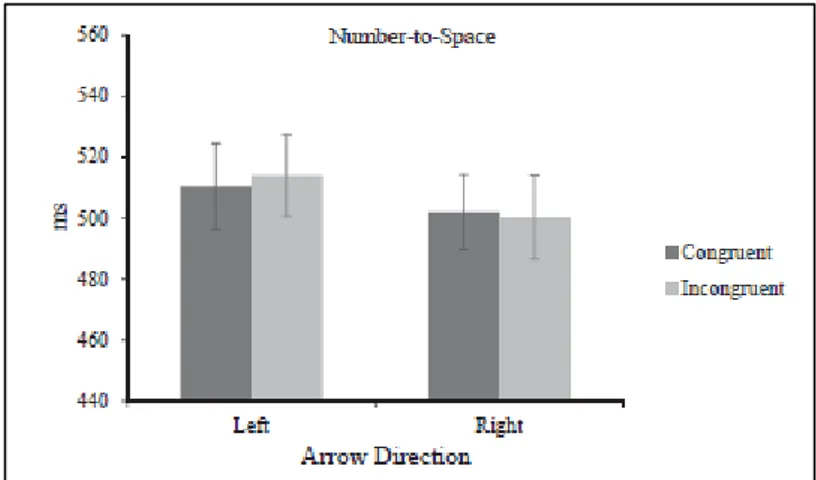
RTs to numerical targets, obtained in the Experimental Condition “a” and “b” that tested Space-to-Number congruency, were entered in a Congruency × Target Magnitude ANOVA. Neither the Congruency effect [F (1, 23) = 2.83, p = .11, ηp2 =
.12] or the Congruency × Target Magnitude interaction were significant [F (1, 23) = 1.91, p = .18, ηp2 = .08; Fig. 11A]. This result was confirmed by regression analysis [t
(23) = −1.67, p = .11; average = −1.16; SD = 3.28; Fig. 11B]. The Bayesian one-sample t-test further confirmed this result, showing a BF10 of 1.38, indicating that the alternative hypothesis is almost as favoured as the null one, with a very weak robustness check. An illustration of the effects of assigning a range of different prior distributions (i.e., a Bayes factor robustness check) is presented in Fig. 12A and 12B.