and Vomiting: Results from the PEER Study
Alexander Molassiotis, RN, PhD, Paul H. Lee, PhD, Thomas A. Burke, PhD, Mario Dicato, MD, FRCP, Pere Gascon, MD, PhD, Fausto Roila, MD, Matti Aapro, MD PII: S0885-3924(16)00057-9
DOI: 10.1016/j.jpainsymman.2015.12.317 Reference: JPS 9066
To appear in: Journal of Pain and Symptom Management Received Date: 6 December 2015
Revised Date: 21 December 2015 Accepted Date: 24 December 2015
Please cite this article as: Molassiotis A, Lee PH, Burke TA, Dicato M, Gascon P, Roila F, Aapro M, Anticipatory Nausea, Risk Factors and Its Impact on Chemotherapy-Related Nausea and Vomiting: Results from the PEER Study, Journal of Pain and Symptom Management (2016), doi: 10.1016/ j.jpainsymman.2015.12.317.
This is a PDF file of an unedited manuscript that has been accepted for publication. As a service to our customers we are providing this early version of the manuscript. The manuscript will undergo copyediting, typesetting, and review of the resulting proof before it is published in its final form. Please note that during the production process errors may be discovered which could affect the content, and all legal disclaimers that apply to the journal pertain.
M
AN
US
CR
IP
T
AC
CE
PT
ED
Original Article 15-00807R1Anticipatory Nausea, Risk Factors and Its Impact on Chemotherapy-Related Nausea and Vomiting: Results from the PEER Study
Alexander Molassiotis, RN, PhD, Paul H. Lee, PhD, Thomas A. Burke, PhD, Mario Dicato, MD, FRCP, Pere Gascon, MD, PhD, Fausto Roila, MD, and Matti Aapro, MD
School of Nursing (A.M., P.H.L.), The Hong Kong Polytechnic University, Hung Hom, Hong
Kong; Global Health Outcomes (T.A.B.), Merck Research Labs, Kenilworth, New Jersey, USA; Hematology-Oncology (M.D.), Luxembourg Medical Center, Luxembourg City, Luxembourg;
August Pi i Sunyer Biomedical Research Institute (P.G.), University of Barcelona, Barcelona, Spain; Santa Maria Hospital (F.R.), Terni, Italy; and Breast Center (M.A.), IMO Clinique de
Genolier, Genolier, Switzerland
Address correspondence to: Alexander Molassiotis, RN, PhD
School of Nursing, The Hong Kong Polytechnic University Hung Hom, Hong Kong
E-mail: [email protected]
M
AN
US
CR
IP
T
AC
CE
PT
ED
AbstractContext. Anticipatory (pre-chemotherapy) nausea (AN) is a classic conditioned symptom
not responding well to current antiemetics. Minimal work has been done to assess its risk factors
and impact on chemotherapy-related nausea and vomiting (CINV).
Objectives. To evaluate risk factors for AN and assess its impact on CINV development.
Methods. We analyzed data (n=991) from a prospective observational multisite study in
eight European countries over three cycles of chemotherapy. Patient/treatment characteristics
were collected before chemotherapy. History of nausea/vomiting (yes/no), patient expectation of CINV (0-100mm visual analogue scale, [VAS]), and pre-chemotherapy anxiety (0-100mm VAS)
also were collected before chemotherapy. A patient-completed diary during each chemotherapy cycle obtained information on AN in the 24 hours before chemotherapy administration, and
nausea and vomiting (episodes of vomiting and severity of nausea) daily for five days after
administration of chemotherapy (0-100mm VAS).
Results. AN was reported by 8.3-13.8% of patients, increasing in frequency and intensity
over each cycle. Every 1mm increase in AN on the VAS was significantly associated with 2-13% of increase in the likelihood of CINV (all P < 0.05). Key predictors of AN in cycle 1 included
metastatic disease and pre-chemotherapy anxiety. However, predictors of AN in subsequent cycles included pre-chemotherapy anxiety, and AN and CINV experience in the previous cycle,
M
AN
US
CR
IP
T
AC
CE
PT
ED
the latter being the strongest predictor (odds ratio 3.30 to 4.09 for CINV outcomes over the cycles).
Conclusion. AN is a challenging symptom and its prevention needs to consider better CINV
prevention in the previous cycles as well as managing pre-chemotherapy anxiety.
Key Words: anticipatory nausea, pre-chemotherapy nausea, chemotherapy-related nausea and
vomiting, cancer, antiemetics
Running title: Predictors of Anticipatory Nausea
M
AN
US
CR
IP
T
AC
CE
PT
ED
IntroductionAnticipatory nausea and vomiting (ANV) are psychologically-linked variations of
chemotherapy-induced nausea and vomiting (CINV). The mechanism behind its development is
a Pavlovian classical conditioning. Reviews suggest that ANV may occur in 20-30% of patients depending on the chemotherapy cycle patients are receiving [1,2], although more recent studies
in Asian populations show a lower prevalence of 4.8-10.3% [3,4]. ANV is typically unresponsive to antiemetic medication [2]. The best approach to preventing ANV may be the optimal
management of CINV in previous cycles of chemotherapy [1] and, if needed, current guidelines propose the use of psychological therapies or benzodiazepines as treatment options [1]. Most
researched psychological therapies include progressive muscle relaxation therapy with guided imagery, systematic desensitization and hypnosis [1]. A number of factors place patients at
higher risk of ANV, including younger age, experiencing CINV in previous cycle, expectation of
CINV, motion sickness, and female gender [1,2]. ANV is a risk factor for CINV, and this has been observed in several studies in the past, including a European multi-country study of 991
patients [5,6]; an Australian study of 200 patients [7] and an Asian Pacific study of 598 patients [3]. It is also clear that ANV contributes to significant declines in quality of life outcomes, even
after adjusting for age, sex, performance status and psychological distress [4].
M
AN
US
CR
IP
T
AC
CE
PT
ED
nausea and anticipatory vomiting as a single symptom, even though nausea seems to be a more difficult symptom to manage and is more common than vomiting in the era of newer antiemetics.
Results are not always consistent and the impact of anticipatory nausea on CINV has not been
fully appreciated in the literature.
Recently we have published data related to predictors of CINV from a large multisite
multi-country prospective observational study over three cycles of chemotherapy (n=991) [6] showing that anticipatory (pre-chemotherapy) nausea (AN) was a predictor of complete CINV response in
the acute, delayed and overall phases alongside the use of antiemetics inconsistent with
international guidelines, younger age, and incomplete CINV response in an earlier cycle. In this
paper, we explored further the predictors and impact of AN in the development of CINV with the same data.
Methods
Design and Sample
This was a large prospective observational evaluation of AN over three cycles of
chemotherapy across eight European countries, as part of a larger study [5] and the methodology has been previously detailed [6]. In summary, adult patients receiving highly- and
moderately-emetogenic chemotherapy with no vomiting in the prior 24hrs, not using steroids and with no brain metastasis were recruited.
M
AN
US
CR
IP
T
AC
CE
PT
ED
Assessment MeasuresNausea and significant nausea were defined as ≥5 mm and ≥25mm, respectively, on a 0-100
visual analogue scale. Overall CINV was defined as having either nausea or emesis. Data were
collected through a case report form by the clinicians for the sociodemographic and clinical characteristics, and by patients regarding pre-chemotherapy AN experience, and nausea and
vomiting (episodes of vomiting and severity of nausea on a 0-100mm VAS). Other data obtained included history of nausea/vomiting (yes/no), patient expectation of CINV (0-100mm VAS), and
pre-chemotherapy anxiety (0-100mm VAS). Ethical approvals were obtained from each participating hospital and patients signed a consent form before participation to the study.
Patients were provided with a daily diary and recording their nausea, vomiting and anxiety experience over six days (the 24hrs prior to chemotherapy and the five days during and
post-chemotherapy). Diaries were returned by patients through a pre-paid self-addressed envelope or
at their next chemotherapy visit. Definitions for nausea and vomiting were provided in the diary. Sample size, according to the power calculations of the primary outcome in the larger study was
calculated to be 1200. However, for a regression analysis of predictors, Harris [8] proposes a minimum of 30 cases per predictor variable, suggesting that the sample for the current
exploratory analysis was adequate.
M
AN
US
CR
IP
T
AC
CE
PT
ED
Descriptive statistics including mean and standard deviation for the visual analogue scale, as well as the frequency and prevalence of pre-chemotherapy nausea and emesis were used to
summarize the data. We examined the effects of age, sex, emetogenicity of chemotherapy,
metastatic disease, history of nausea, alcohol intake, anxiety over last 24 hours, perception about nausea, and the overall CINV and pre-chemotherapy (anticipatory) nausea VAS at the previous
cycle on subsequent cycle chemotherapy nausea using logistic regression. The effects of pre-chemotherapy nausea in VAS on acute nausea, delayed nausea, and acute emesis were
investigated using logistic regression. Both crude effects and effects adjusted for the above list of variables were evaluated. Analyses were repeated for each cycle. All analyses were conducted in
SPSS version 22, and P-value of <0.05 indicated significant results.
Results
Sample Characteristics
While 1128 patients were recruited, 991 provided evaluable data at the end of cycle 1, 888 for cycle 2 and 769 for cycle 3. The most common reason for exclusion was that patients did not
complete the six-day diary during their chemotherapy cycle. The sample had a mean age of 56.7 (SD=11.4) years; females comprised 72.9% of the sample and breast cancer was the most
common diagnosis (53%). Highly-emetogenic chemotherapy was the regimen given to 189 patients, female AC (anthracycline-cyclophosphamide) chemotherapy was given to 463 patients
M
AN
US
CR
IP
T
AC
CE
PT
ED
and moderately-emetogenic chemotherapy was given to 339 patients. Full details of the patient characteristics are presented elsewhere [6].
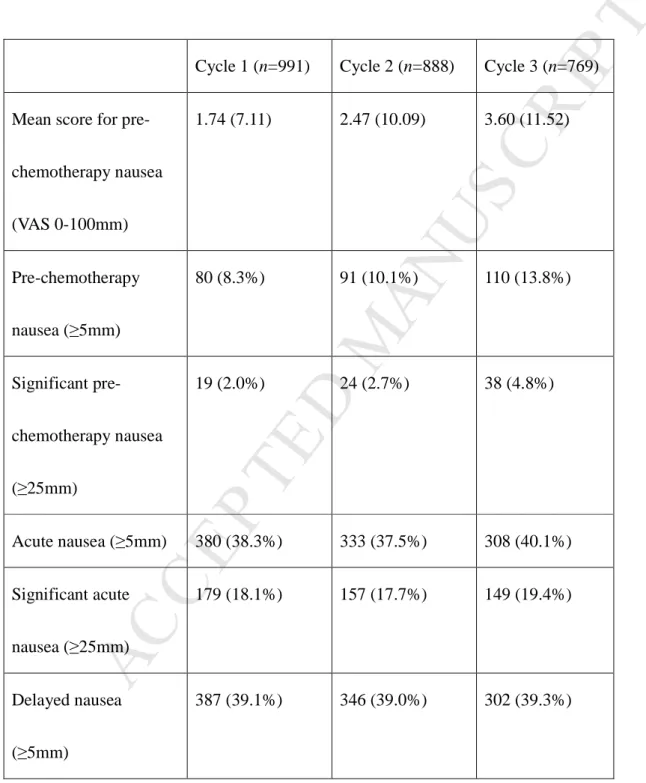
Prevalence of Anticipatory Nausea
Table 1 shows that pre-chemotherapy (anticipatory) nausea (AN≥5mm) was evident in 8.3-13.8% of patients over the three cycles. Significant anticipatory nausea (AN≥25mm) was
reported by 2.0-4.8% of the patients. Intensity was mild in most of the cases. Both prevalence and intensity increased over each subsequent chemotherapy cycle (Table 1), and significant AN
more than doubled by cycle 3 and intensity of AN also doubled by cycle 3. CINV, however (particularly nausea, both acute and delayed) was much higher than AN with fairly similar
prevalence across the three chemotherapy cycles.
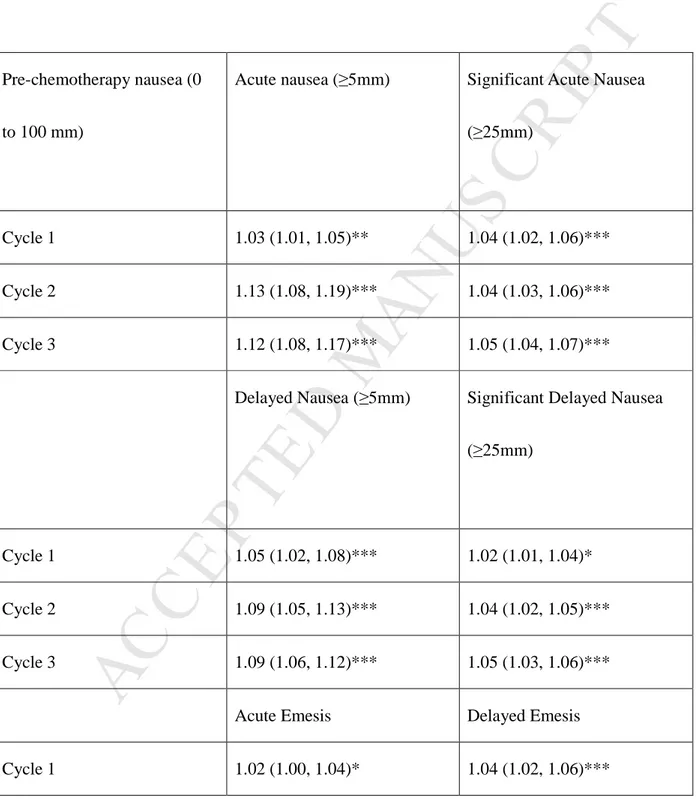
Impact of AN on CINV
In a logistic regression of the crude impact of AN on acute and delayed nausea and
vomiting, AN was significantly linked with the development of CINV, showing higher impact in nausea as opposed to vomiting, and in the second and third cycles as opposed to the first cycle.
As can be seen in Table 2, for every 1mm (in the 0-100 VAS) increase in AN there was a 3%, 12% and 13% increase in acute nausea in the first, second and third cycle respectively. The same
pattern was observed in all other CINV outcomes, with impact being more on nausea variables rather than vomiting variables.
M
AN
US
CR
IP
T
AC
CE
PT
ED
Risk Factors for AN
A number of patient and treatment characteristics were included in a multivariate logistic
regression to assess potential risk factors for AN. In the first cycle, only metastatic disease and
higher level anxiety before the chemotherapy were AN predictors. However, in the second and third cycles, the effect of metastatic disease disappeared and gave place to CINV in the previous
cycle as the strongest predictor alongside AN in the previous cycle and higher anxiety pre-chemotherapy (Table 3). For example, those with CINV experience in the previous cycle had 3.7
times (cycle 2) and 3.3 times (cycle 3) more chances to develop AN in the subsequent cycle than those that had no CINV experience. These chances were even higher when ‘significant AN’ was
concerned. Pre-chemotherapy anxiety was modestly correlated with AN in cycle 1 (r=0.15, P<0.001), but correlations increased in cycle 2 (r=0.37,P<0.001) and cycle 3 (r=0.38, P<0.001),
further supporting the notion that AN and anticipatory anxiety significantly increased over
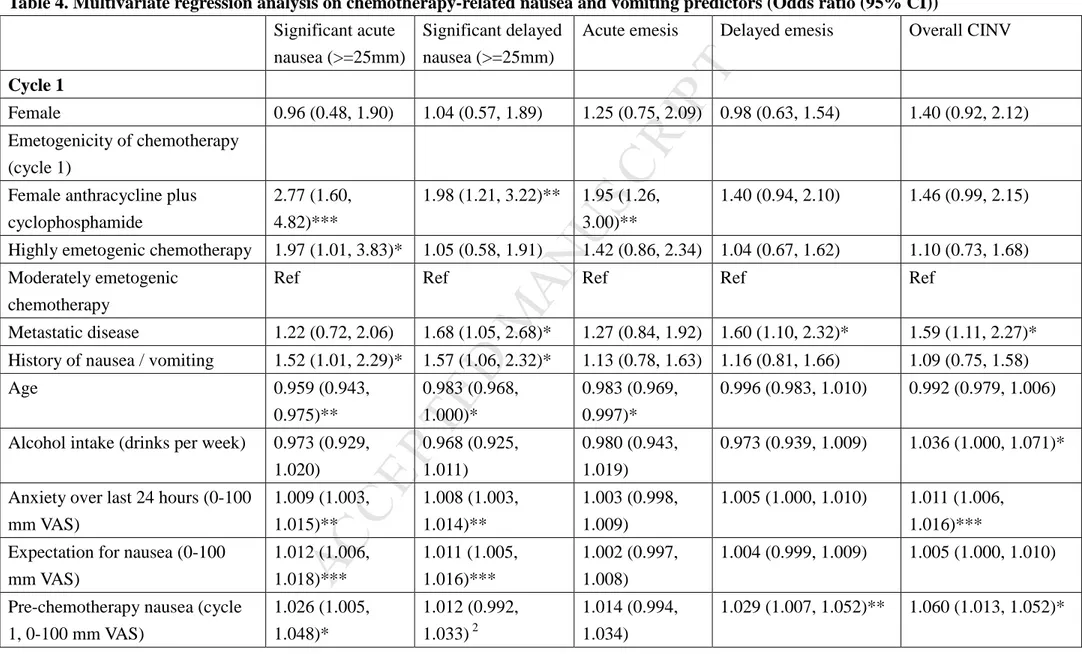
subsequent cycles of chemotherapy. Risk Factors for CINV
Exploring the potential predictors of CINV, Table 4 shows that AN had a significant impact in acute nausea, delayed nausea and acute and delayed vomiting. This consistent predictor was
part of a larger set of variables (risk factors) for CINV. Such risk factors for CINV included use of female AC chemotherapy, history of nausea/vomiting, younger age, anxiety before
M
AN
US
CR
IP
T
AC
CE
PT
ED
chemotherapy, expectation of CINV and presence of AN, with some minor variation from cycle to cycle and from phase of symptom to phase of symptom (Table 4). However, the strongest
predictor of CINV in a cycle was CINV experience in the previous cycle.
Discussion
This is the largest study to date assessing AN in patients receiving chemotherapy, using a
prospective design in a multisite study. Key findings indicate that AN is prevalent in about 8-14% of patients, with higher prevalence in later cycles of chemotherapy. The intensity of AN was
mild. A consistent predictor of AN was pre-chemotherapy anxiety, with CINV in the previous cycle being the key additional factor in subsequent cycles of chemotherapy.
The prevalence of AN in this study is lower than that reported in past studies and reviews on the topic (20-30%) [1] and even lower when “significant AN” only is assessed, but all these
studies (or the studies reviewed in the past) are at least 10-20 years old. The only recent study in
Australasian countries [3] shows a prevalence of 4.8-8.3%, which is closer to our findings. The difference in the two studies is in the definitions used. We have used a 100mm VAS and defined
AN as that of ≥5mm and significant AN that of ≥25mm, whereas the latter study used “clinically significant” AN as >3 on a 0-10 scale. Hence, the definitions of clinically significant nausea in
the two studies are slightly different. This overall decrease in ANV symptoms may be attributed to the use of more effective antiemetics in the past decade (i.e. decreasing significantly the CINV
M
AN
US
CR
IP
T
AC
CE
PT
ED
experience being strongly linked with ANV symptoms) as well as more patient education and support. In the era of more potent antiemetics, better symptom education and more familiarity of
the public with chemotherapy, rates of AN are lower than in the past decades.
The impact of AN on CINV outcomes is significant, as the chances of a patient developing
CINV significantly increases for every slight increase in the experience of AN, as shown in Table
2. This is a new finding, and suggests that preventing AN may have a positive outcome in the experience of CINV. In cycle 1, anxiety (alongside metastatic disease which may also be linked
with more anxiety) is the key predictor of AN. This, coupled with the fact that AN increases over each cycle of chemotherapy, clearly supports the notion of AN being a classical conditioned
effect. The picture of AN predictors is more complicated beyond the first cycle of chemotherapy, where new (and strong) predictors include, additionally to pre-chemotherapy anxiety,
experiencing CINV in the previous cycle. Nevertheless, other commonly reported risk factors for
CINV seem to play no role in the development in AN. As AN is a very difficult symptom to prevent, efforts should be diverted to manage CINV well. Indeed experts in the field suggest that
the best approach to managing AN is to manage well CINV in the previous cycle [1]. Regrettably many clinicians do not use guideline recommended preventative antiemetics and expose patients
to a much higher risk of experiencing CINV [5]. Furthermore, as AN is strongly linked with pre-chemotherapy anxiety, psychological (behavioral) therapies or use of benzodiazepines are
M
AN
US
CR
IP
T
AC
CE
PT
ED
recommended from international clinical guidelines [1].
AN is also a key predictor of CINV in a complex interrelationship of uncontrolled CINV
leading to more AN in subsequent cycles and AN increasing the risk of CINV in the next cycle.
As seen in Table 4, AN contributes to higher level of CINV risk in subsequent cycles. Hence, this is a variable that needs to be considered in risk assessment for CINV and antiemetics adjusted
accordingly. Nevertheless, uncontrolled CINV in the previous cycle is the key factor for CINV in the subsequent cycle, increasing the likelihood of CINV by 6.5 times in cycle 2 and 14 times in
cycle 3. Currently CINV prevention is based on level of emetogenicity of the chemotherapy used, ignoring individual variation in the development of CINV. Considering the many factors
that can contribute to the development of CINV, a risk-guided antiemetic prophylaxis, where patients with higher risk are treated with the next higher level of antiemetic prophylaxis may be a
more effective approach to preventing CINV. Indeed we have a recent such example albeit not
including patients with AN, which showed in a large randomized trial that risk assessment-based regimens, i.e., adding dexamethasone and olanzapine in the subsequent cycle to the previous
antiemetic regimen if patients continued to experience nausea/vomiting, were more effective than using physician-based choice of antiemetics [9]. Such an approach could consider ways to
manage AN as part of a CINV antiemetic protocol, where the addition of benzodiazepines or behavioral treatment could be added to the antiemetic regimen if patients experience anticipatory
M
AN
US
CR
IP
T
AC
CE
PT
ED
symptoms. It is unclear currently if clinicians consistently assess anticipatory symptoms and how they prevent them, hence standardizing this practice could have beneficial outcomes for patients.
Despite our study being fully powered, when many analyses are performed, some results
may be significant by chance, and this should be considered when the results of this study are interpreted. Nevertheless, the management of AN is challenging and based on minimal and low
quality evidence. As this study shows that it is a prevalent and complex symptom, future research should be directed in testing effective interventions for managing this symptom. We should also
explore more concretely the link between anxiety and nausea, particularly when these symptoms develop before any chemotherapy is administered. As anxiety is a key predictor of AN,
psychological therapies to minimize anxiety should be offered, supporting current clinical guidelines for the prevention of AN [1]. The impact of AN on patients’ quality of life is another
area of future research, although the differentiation of AN’s and CINV’s impact on quality of life
will be problematic.
Disclsoures and Acknowledgments
The observational study was funded by Merck Sharpe & Dohme Corp., but the analysis was done and the manuscript written independently without company support. Conflicts of Interest:
AM: research funding and consultancies: Merck & Co. Ltd. PHL: no conflict of interest declared
M
AN
US
CR
IP
T
AC
CE
PT
ED
TAB: employee of Merck & Co. Ltd. MD: consultancy: Merck & Co. Ltd.
PG: Merck & Co. Ltd.
FR: consultancies: Merck & Co. Ltd.
MA: consultancies and grant support: Helsinn & Eisai; consultancies: Tesaro; Taiho;
Mundipharma; Merck & Co. Ltd.
The authors thank all the PEER (Pan European Emesis Registry) study chief investigators
for their contribution to the data collection. A full list of names can be found in doi:10.1016/j.jpainsymman.2013.06.012.
M
AN
US
CR
IP
T
AC
CE
PT
ED
References1. Roscoe JA, Morrow GR, Aapro MS, Molassiotis A, Olver I. Anticipatory nausea and
vomiting. Support Care Cancer 2011; 19:1533-1538.
2. Kamen C, Tejani MA, Chandwani K, et al. Anticipatory nausea and vomiting due to
chemotherapy. Eur J Pharmacol 2014; 722:172-179.
3. Chan A, Kim HK, Hsieh RK, et al. Incidence and predictors of anticipatory nausea and vomiting in Asia Pacific clinical practice--a longitudinal analysis. Support Care Cancer
2015; 23:283-291.
4. Akechi T, Okuyama T, Endo C, et al. Anticipatory nausea among ambulatory cancer
patients undergoing chemotherapy: prevalence, associated factors, and impact on quality of life. Cancer Sci 2010; 101:2596-2600.
5. Aapro M, Molassiotis A, Dicato M, et al.; PEER investigators. The effect of
guideline-consistent antiemetic therapy on chemotherapy-induced nausea and vomiting (CINV): the Pan European Emesis Registry (PEER). Ann Oncol 2012; 23:1986-1992.
6. Molassiotis A, Aapro M, Dicato M, et al. Evaluation of risk factors predicting chemotherapy-related nausea and vomiting: results from a European prospective
observational study. J Pain Symptom Manage 2014, 47: 839-848.
M
AN
US
CR
IP
T
AC
CE
PT
ED
nausea and vomiting in Australian cancer patients: a prospective, longitudinal, observational study. Support Care Cancer 2011, 19: 1549-1563.
8. Harris RJ. A primer of multivariate statistics, 2nd ed. New York: Academic Press, 1985.
9. Clemons M, Bouganim N, Smith S, et al. Risk model–guided antiemetic prophylaxis vs.
physician’s choice in patients receiving chemotherapy for early-stage breast cancer: a
M
AN
US
CR
IP
T
AC
CE
PT
ED
Table 1. Descriptive Summary of Anticipatory Nausea and Chemotherapy-Related Nausea
and Vomiting
Cycle 1 (n=991) Cycle 2 (n=888) Cycle 3 (n=769)
Mean score for pre-chemotherapy nausea (VAS 0-100mm) 1.74 (7.11) 2.47 (10.09) 3.60 (11.52) Pre-chemotherapy nausea (≥5mm) 80 (8.3%) 91 (10.1%) 110 (13.8%) Significant pre-chemotherapy nausea (≥25mm) 19 (2.0%) 24 (2.7%) 38 (4.8%) Acute nausea (≥5mm) 380 (38.3%) 333 (37.5%) 308 (40.1%) Significant acute nausea (≥25mm) 179 (18.1%) 157 (17.7%) 149 (19.4%) Delayed nausea (≥5mm) 387 (39.1%) 346 (39.0%) 302 (39.3%)
M
AN
US
CR
IP
T
AC
CE
PT
ED
Significant delayed nausea (≥25mm) 193 (19.5%) 162 (18.2%) 148 (19.2%) Acute emesis 243 (24.5%) 173 (19.5%) 144 (18.7%) Delayed emesis 292 (29.5%) 210 (23.6%) 166 (21.6%)M
AN
US
CR
IP
T
AC
CE
PT
ED
Table 2. Crude Logistic Regression Models of the Impact of Anticipatory Nausea on Acute
and Delayed Nausea, and Acute and Delayed Emesis (Odds Ratio [95% CI])
Pre-chemotherapy nausea (0
to 100 mm)
Acute nausea (≥5mm) Significant Acute Nausea
(≥25mm)
Cycle 1 1.03 (1.01, 1.05)** 1.04 (1.02, 1.06)***
Cycle 2 1.13 (1.08, 1.19)*** 1.04 (1.03, 1.06)***
Cycle 3 1.12 (1.08, 1.17)*** 1.05 (1.04, 1.07)***
Delayed Nausea (≥5mm) Significant Delayed Nausea
(≥25mm)
Cycle 1 1.05 (1.02, 1.08)*** 1.02 (1.01, 1.04)*
Cycle 2 1.09 (1.05, 1.13)*** 1.04 (1.02, 1.05)***
Cycle 3 1.09 (1.06, 1.12)*** 1.05 (1.03, 1.06)***
Acute Emesis Delayed Emesis
M
AN
US
CR
IP
T
AC
CE
PT
ED
Cycle 2 1.03 (1.01, 1.04)*** 1.02 (1.01, 1.04)** Cycle 3 1.03 (1.02, 1.04)*** 1.03 (1.01, 1.04)*** *P<0.05 **P<0.01 ***P<0.001M
AN
US
CR
IP
T
AC
CE
PT
ED
Table 3. Multivariate Regression on Anticipatory Nausea (Odds Ratio [95% CI])
Pre-chemo Nausea (≥5mm) Significant Pre-chemo Nausea (≥25mm) Cycle 1 Female 1.91 (0.90, 4.05) 0.84 (0.18, 4.03)
Emetogenicity of chemotherapy (cycle 1)
Female anthracycline plus cyclophosphamide 0.87 (0.47, 1.63) 1.19 (0.33, 4.29)
Highly emetogenic chemotherapy 0.87 (0.42, 1.82) 0.43 (0.08, 2.31)
Moderately emetogenic chemotherapy Ref Ref
Metastatic disease 2.79 (1.55, 5.01)** 5.44 (1.67, 17.71)**
History of nausea / vomiting 1.69 (0.99, 2.90) 2.83 (0.97, 8.21)
Age 0.997 (0.975,
1.020)
1.028 (0.977, 1.082)
Alcohol intake (drinks per week) 0.989 (0.932,
1.050)
0.792 (0.598, 1.050)
Anxiety over last 24 hours (0-100 mm VAS) 1.010 (1.002,
1.017)*
M
AN
US
CR
IP
T
AC
CE
PT
ED
Expectation for nausea (0-100 mm VAS) 1.005 (0.997,
1.013)
1.010 (0.994, 1.026)
Cycle 2
Female 0.63 (0.30, 1.31) 0.93 (0.25, 3.47)
Emetogenicity of chemotherapy (cycle 2)
Female anthracycline plus cyclophosphamide 0.86 (0.43, 1.73) 0.54 (0.17, 1.77)
Highly emetogenic chemotherapy 1.23 (0.59, 2.54) 0.84 (0.21, 3.38)
Moderately emetogenic chemotherapy Ref Ref
Metastatic disease 1.02 (0.54, 1.92) 1.02 (0.34, 3.06)
History of nausea / vomiting 0.79 (0.41, 1.53) 1.57 (0.53, 4.61)
Age 0.996 (0.973,
1.020)
0.993 (0.951, 1.037)
Alcohol intake (drinks per week) 0.970 (0.909,
1.035)
0.839 (0.674, 1.044)
Anxiety over last 24 hours (0-100 mm VAS) 1.031 (1.022,
1.041)***
1.026 (1.014,
1.039)***
M
AN
US
CR
IP
T
AC
CE
PT
ED
1.003)Overall CINV (cycle 1) 3.72 (1.80,
7.65)***
4.09 (0.89, 18.86)
Pre-chemotherapy nausea (cycle 1, 0-100 mm VAS) 1.028 (1.001, 1.056)* 1.031 (0.999, 1.064) Cycle 3 Female 0.66 (0.31, 1.40) 1.36 (0.42, 4.44)
Emetogenicity of chemotherapy (cycle 3)
Female anthracycline plus cyclophosphamide 1.42 (0.70, 2.87) 1.39 (0.46, 4.15)
Highly emetogenic chemotherapy 1.34 (0.62, 2.88) 2.83 (0.90, 8.96)
Moderately emetogenic chemotherapy Ref Ref
Metastatic disease 0.91 (0.48, 1.74) 1.00 (0.36, 2.75)
History of nausea / vomiting 0.62 (0.33, 1.16) 0.66 (0.26, 1.67)
Age 1.020 (0.996,
1.044)
1.005 (0.969, 1.043)
Alcohol intake (drinks per week) 0.985 (0.929,
1.046)
M
AN
US
CR
IP
T
AC
CE
PT
ED
Anxiety over last 24 hours (0-100 mm VAS) 1.025 (1.016,
1.035)***
1.028 (1.016, 1.041)***
Expectation for nausea (0-100 mm VAS) 1.001 (0.993,
1.008)
0.999 (0.988, 1.011)
Overall CINV (cycle 2) 3.30 (1.71,
6.38)***
3.89 (1.10, 13.83)*
Pre-chemotherapy nausea (cycle 2, 0-100 mm
VAS) 1.049 (1.023, 1.077)*** 1.027 (1.008, 1.047)** *P<0.05. **P<0.01. ***P<0.001.
M
AN
US
CR
IP
T
AC
CE
PT
ED
Table 4. Multivariate regression analysis on chemotherapy-related nausea and vomiting predictors (Odds ratio (95% CI))
Significant acute nausea (>=25mm)
Significant delayed nausea (>=25mm)
Acute emesis Delayed emesis Overall CINV
Cycle 1
Female 0.96 (0.48, 1.90) 1.04 (0.57, 1.89) 1.25 (0.75, 2.09) 0.98 (0.63, 1.54) 1.40 (0.92, 2.12)
Emetogenicity of chemotherapy (cycle 1)
Female anthracycline plus cyclophosphamide 2.77 (1.60, 4.82)*** 1.98 (1.21, 3.22)** 1.95 (1.26, 3.00)** 1.40 (0.94, 2.10) 1.46 (0.99, 2.15)
Highly emetogenic chemotherapy 1.97 (1.01, 3.83)* 1.05 (0.58, 1.91) 1.42 (0.86, 2.34) 1.04 (0.67, 1.62) 1.10 (0.73, 1.68) Moderately emetogenic
chemotherapy
Ref Ref Ref Ref Ref
Metastatic disease 1.22 (0.72, 2.06) 1.68 (1.05, 2.68)* 1.27 (0.84, 1.92) 1.60 (1.10, 2.32)* 1.59 (1.11, 2.27)* History of nausea / vomiting 1.52 (1.01, 2.29)* 1.57 (1.06, 2.32)* 1.13 (0.78, 1.63) 1.16 (0.81, 1.66) 1.09 (0.75, 1.58)
Age 0.959 (0.943, 0.975)** 0.983 (0.968, 1.000)* 0.983 (0.969, 0.997)* 0.996 (0.983, 1.010) 0.992 (0.979, 1.006)
Alcohol intake (drinks per week) 0.973 (0.929, 1.020) 0.968 (0.925, 1.011) 0.980 (0.943, 1.019) 0.973 (0.939, 1.009) 1.036 (1.000, 1.071)*
Anxiety over last 24 hours (0-100 mm VAS) 1.009 (1.003, 1.015)** 1.008 (1.003, 1.014)** 1.003 (0.998, 1.009) 1.005 (1.000, 1.010) 1.011 (1.006, 1.016)*** Expectation for nausea (0-100
mm VAS) 1.012 (1.006, 1.018)*** 1.011 (1.005, 1.016)*** 1.002 (0.997, 1.008) 1.004 (0.999, 1.009) 1.005 (1.000, 1.010)
Pre-chemotherapy nausea (cycle 1, 0-100 mm VAS) 1.026 (1.005, 1.048)* 1.012 (0.992, 1.033) 2 1.014 (0.994, 1.034) 1.029 (1.007, 1.052)** 1.060 (1.013, 1.052)*
M
AN
US
CR
IP
T
AC
CE
PT
ED
Cycle 2 Female 1.13 (0.54, 2.35) 0.86 (0.42, 1.77) 1.91 (0.95, 3.84) 1.43 (0.82, 2.48) 0.85 (0.51, 1.41) Emetogenicity of chemotherapy (cycle 2)Female anthracycline plus cyclophosphamide
2.07 (1.17, 3.68)* 2.53 (1.43, 4.49)** 2.14 (1.26, 3.63)**
1.31 (0.84, 2.04) 1.60 (1.01, 2.51)*
Highly emetogenic chemotherapy 1.98 (0.97, 4.05)1 1.14 (0.55, 2.37) 1.58 (0.80, 3.09) 0.85 (0.47, 1.51) 1.19 (0.71, 1.99) Moderately emetogenic
chemotherapy
Ref Ref Ref Ref Ref
Metastatic disease 0.71 (0.39, 1.30) 0.89 (0.50, 1.57) 1.51 (0.89, 2.55) 1.06 (0.68, 1.67) 0.94 (0.61, 1.45) History of nausea / vomiting 1.33 (0.84, 2.11) 1.06 (0.67, 1.67) 1.33 (0.87, 2.05) 0.94 (0.63, 1.42) 1.95 (1.24, 3.07)**
Age 0.969 (0.950, 0.986)** 0.971 (0.954, 0.990)** 0.966 (0.948, 0.982)*** 0.987 (0.971, 1.003) 0.973 (0.957, 0.989)** Alcohol intake (drinks per week) 0.969 (0.919,
1.019) 0.947 (0.897, 1.000) 0.999 (0.953, 1.046) 0.955 (0.913, 1.000) 0.981 (0.943, 1.021)
Anxiety over last 24 hours (0-100 mm VAS) 1.024 (1.016, 1.033)*** 1.026 (1.018, 1.036)*** 1.012 (1.005, 1.020)** 1.010 (1.003, 1.017)** 1.021 (1.010, 1.031*)** Expectation for nausea (0-100
mm VAS) 1.005 (0.998, 1.011) 1.003 (0.996, 1.009) 2 1.003 (0.996, 1.009) 1.002 (0.997, 1.008) 1.001 (0.995, 1.007)
Pre-chemotherapy nausea (cycle 1, 0-100 mm VAS) 1.035 (1.007, 1.062)* 1.023 (0.997, 1.049) 2 1.019 (0.995, 1.044) 1.023 (0.999, 1.048) 1.048 (0.996, 1.103)
Pre-chemotherapy nausea (cycle 2, 0-100 mm VAS) 1.035 (1.013, 1.055)** 1.024 (1.005, 1.044)* 1.021 (1.004, 1.039)** 1.011 (0.995, 1.027) 1.157 (1.047, 1.279)**
M
AN
US
CR
IP
T
AC
CE
PT
ED
Cycle 3 Female 0.81 (0.38, 1.76) 1.42 (0.70, 2.87) 1.37 (0.65, 2.89) 1.06 (0.58, 1.93) 1.14 (0.62, 2.08) Emetogenicity of chemotherapy (cycle 3)Female anthracycline plus cyclophosphamide
1.73 (0.96, 3.12) 1 1.36 (0.78, 2.35) 2.62 (1.46, 4.69)**
0.91 (0.56, 1.50) 0.91 (0.54, 1.54)
Highly emetogenic chemotherapy 0.97 (0.42, 2.24) 1.11 (0.53, 2.32) 1.16 (0.53, 2.53) 0.76 (0.39, 1.48) 1.49 (0.76, 2.90) Moderately emetogenic
chemotherapy
Ref Ref Ref Ref Ref
Metastatic disease 0.67 (0.35, 1.29) 1.16 (0.65, 2.06) 1.46 (0.82, 2.60) 1.11 (0.67, 1.83) 0.98 (0.59, 1.63) History of nausea / vomiting 1.85 (1.15, 2.97)* 1.17 (0.73, 1.87) 1.68 (1.07,
2.63)* 1.13 (0.73, 1.76) 0.85 (0.52, 1.41) Age 0.967 (0.947, 0.986)** 0.969 (0.950, 0.988)** 0.993 (0.973, 1.012) 0.982 (0.965, 1.000)* 0.994 (0.975, 1.013)
Alcohol intake (drinks per week) 0.982 (0.931, 1.036) 1.010 (0.962, 1.060) 1.029 (0.981, 1.079) 1.001 (0.956, 1.048) 1.065 (1.015, 1.119)**
Anxiety over last 24 hours (0-100 mm VAS) 1.022 (1.014, 1.031)*** 1.019 (1.011, 1.028)*** 1.015 (1.007, 1.024)*** 1.009 (1.001, 1.017)* 1.013 (1.001, 1.024)*
Expectation for nausea (0-100 mm VAS) 1.002 (0.995, 1.009) 1.002 (0.996, 1.009) 1.004 (0.997, 1.010) 1.007 (1.001, 1.013)* 1.009 (1.003, 1.016)** Pre-chemotherapy nausea (cycle
1, 0-100 mm VAS) 1.025 (0.994, 1.058) 1.002 (0.969, 1.038) 2 1.000 (0.970, 1.029) 1.012 (0.983, 1.042) 1.989 (0.955, 1.024)
Pre-chemotherapy nausea (cycle 2, 0-100 mm VAS) 1.049 (1.020, 1.079)** 1.029 (1.007, 1.052)** 1.017 (0.999, 1.035) 1.007 (0.990, 1.024) 1.037 (0.981, 1.095)
M
AN
US
CR
IP
T
AC
CE
PT
ED
Pre-chemotherapy nausea (cycle 3, 0-100 mm VAS) 1.041 (1.022, 1.059)*** 1.030 (1.015, 1.047)*** 1.015 (1.000, 1.030)* 1.020 (1.005, 1.036)** 1.095 (1.029, 1.164)**
Overall CINV (cycle 3) / / / / 14.17 (9.28,
21.63)***
1
Significant for acute nausea (>=5mm) only.
2
Significant for delayed nausea (>=5mm) only. *P<0.05
**P<0.01 ***P<0.001