Università degli Studi di Catania
Dipartimento di Scienze Biomediche e Biotecnologiche “Biometech”
Dottorato di Ricerca Internazionale in Neurosceinze - XXXI Ciclo
Technological innovations in multimodal
management of glioblastoma:
from nano-drugs to imaging guided surgery
and supra-maximal resection.
Candidate: Dr. Francesco Certo Tutor: Prof. Giovanni Puglisi
Index
1. Introduction
1.1 Image-guided surgery for management of Glioblastoma 1.2 Impact of extent of tumor resection on survival
1.3 After surgery: adjuvant therapy with Temozolomide and role of nanotechnologies
2. Aims
3. Retrospective clinical study on intraoperative imaging
3.1 Methods 3.2 Results
4. Prospective clinical study on intraoperative imaging-guidance
4.1 Methods 4.2 Results
5. In vitro experiments on temozolomide
a. Methods
i. Preparation of TMZ-loaded nanoparticles ii. Cell lines
iii. Preparation of TMZ-loaded mAb-PLGA NPs iv. PLGA NPs physicochemical characterization
v. TMZ encapsulation efficiency and release from PLGA NPs
vi. Cellular imaging studies
vii. Quantification of in vitro cellular uptake of mAb-PLGA NPs viii. Transferrin competitive binding assay
b. Results
i. PLGA NPs physicochemical properties
ii. TMZ encapsulation efficiency and release from PLGA NPs iii. Cell viability test
iv. In vitro cellular uptake of mAb-PLGA NPs
6. In vivo experiments on temozolomide
a. Methods
i. Model of glioma-bearing rats ii. In vivo brain distribution of NPs iii. In vivo anti-glioma activity b. Results
i. TMZ brain concentration
ii. Evaluation of anti-glioma activity iii. Evaluation of anti-glioma activity
7. Discussion
a. Strategies to improve surgical and clinical outcome
b. Strategies to increase the effectiveness of adjuvant therapy: nanotechnologies to cross BBB
c. Theranostic
d. Personalized medicine
e. Preclinical phase and clinical trials
8. Limitation and perspectives 9. Conclusions
1.
Introduction
Primary brain tumors are a major cause of morbidity and mortality in the United States (1). Approximately one-third of tumors are malignant and the remaining are benign or borderline malignant. High-grade glioma, in particular glioblastoma, management is a great challenge for both neurosurgeons and patients. More than 45% of CNS primary malignant tumours are glioblastoma and their 5 year-survival is only 5% on average. Although biomolecular differences between glioblastoma IDH-WT and IDH-mutant might account for different outcomes, treatment strategies, including surgical EOR, chemiotherapy and radiotherapy, are currently considered important factors associated with PFS and OS (2-5).
1.1
Image-guided surgery for management of Glioblastoma
In order to increase tumor extent of resection and reduce complications, several intraoperative technologies, like neuronavigation, neuromonitoring, fluorescence-guidance, intraoperative Magnetic Resonance (i-MR), intraoperative Computed Tomography (i-CT) and intraoperative Ultrasound (i-US) have been variably investigated and applied to brain tumor surgery with promising results. However, most of them are usually used independently and clinical practice revealed several limitations and pitfalls related to each one of them (6-14).
Neuronavigation is routinely used during brain tumors resection. However, the brain
shift-phenomenon, caused by surgical retraction, blood and cerebrospinal fluid (CSF) loss as well as by tumor removal itself, is responsible for progressive loss of navigation accuracy and may limit its use, particularly in cases of large or deeply sited lesions. As a result, the use of preoperative imaging-based neuronavigation becomes less reliable during surgery and intraoperative, real time image-guided surgery is gaining momentum to compensate for brain shift, increase tumor resection accuracy and improve post-operative outcome with regard to OS and QOL.
Effectiveness of 5 aminolevulinic acid (5-ALA) fluorescence-guided surgery in increasing HGGs EOR has been proven (15). 5-ALA fluorescence-guided surgery, albeit useful to achieve maximal or supramaximal resection, may be associated with increased risk of eloquent areas injury,
subcortical electrical stimulation can aid to pursue a balanced compromise between function preservation and surgical radicality. Neuromonitoring has been proposed also in brain metastases surgery with controversial results (6).
With regard to intraoperative imaging, for more than a decade i-MR was considered the most accurate tool to assess EOR in glioma surgery. High quality images allowing brain parenchyma and residual contrast-enhancing, or abnormal, tissue visualization, without exposure to ionizing
radiation, is i-MR main advantage. Unfortunately, both i-MR machines and the entire MR-compatible operating theatre are expensive and yet limited to a small number of neurosurgical
centers worldwide (8,9).
The use of i-CT has been reported in cases of tumors spreading to the brain surface, in
transsphenoidal surgery and, more recently, during surgery for intra-axial tumors, like low-grade glioma (10-12). Although i-CT-related radiation dose is usually low, it may still limit the use of this technology; moreover, minimal residual tumor can be undetectable on CT scan. Conversely, benefits of i-CT include correction for brain shift during neuronavigation (similarly to i-MR),
localization of contrast-enhancing tumor and associated necrotic areas inadvertently left behind after microsurgical resection as well as early identification of complications, particularly intraoperative hemorrhage. Yet, it is also important to highlight the wider financial and logistic accessibility of i-CT for many centers as well as the intraoperative time gain, particularly when a portable i-CT scanner is used (10).
Considering advantages and limitations of each of the above tools, efforts are currently made to identify their most useful and effective combination in brain tumor surgery, in order to achieve both
maximal and safe tumor EOR and improved patients’ OS and QOL.
1.2
Impact of extent of tumor resection on survival
Sanai et al. demonstrated thattumour EOR ≥95% is a positive prognostic factor (16). Currently, researchers are also focusing on options allowing more accurate visualization of the tumour mass, to let surgeons achieve a EOR nearing 100%. Moreover, in the past few years supramarginal tumour resection for LGG, DLGG and metastases, as a strategy providing improved PFS e OS, has been reported (17).
How to achieve improved outcome results in HGGs is the quest of modern research, considering that usually glioblastoma recurrence takes place within two centimeters around the initial tumor margins.
Currently, standard preoperative MRI protocols allow tumour volume measurement and its edges delineation: they give volumetric and anatomical information about the intracranial mass and guide tumour excision through the use of neuronavigation. Tumor edges are defined on T1-contrast enhanced sequences, assuming that contrast enhancement is due to BBB disruption driven by tumour infiltration. Currently, standard tumor excision is based on such altered-BBB edges
delineation, preserving the surrounding eloquent areas with electrophysiological mapping. However , in addition to T1-weighted sequences, an important role is played by T2w-FLAIR images, which help in determining tumor structural margins, due to CSF suppression and improved sulcal anatomy visualization. Yet, FLAIR images usually show tumors larger than T1-weighted sequences, and
they also depict peritumoral areas where it’s supposed that remaining tumour cells are located. But
specificity of FLAIR sequences in delineating tumour extension is reduced by their limitations in distinguishing lesion edges (with real tumour infiltration) from perilesional oedema (18). In
addition, similarly to other preoperative imaging techniques, MRI accuracy is also plagued by brain shift (19).
Following Stummer’s et al. studies (15) the use of 5-ALA fluorescence has become another useful and commonly used intraoperative tool, in association with neuronavigation, during brain tumor
surgery. Since the spread of 5-ALA fluorescence use, many surgeons observed the presence of
fluorescent areas beyond tumor edges seen on gadolinium-enhanced, T1-weighted MRI. Despite the high PPV (positive predictive value) of 5-ALA in recognising tumour tissue, different technical features and problems may lower its NPV (negative predictive value). In particular, the higher the distance from the main tumour bulk, the lower the tumor cell density and hence fluorescence intensity. Moreover, during surgery presence of blood in the surgical field, depth of tumour
infiltration and hidden areas not reachable by microscope light can obstruct surgeon’s view and
ability to detect tumor tissue (10,15).
T2-weighted FLAIR sequences and 5-ALA fluorescence both improve tumour visualization, beyond the T1-weighted, contrast-enhanced, area. Both FLAIR images and 5-ALA fluorescence are likely to also include in the tumour volume those peritumoral (i.e. tumor peripheral) areas where small tumor cell nests hide; and these nests are known to be associated with the high frequency of tumor recurrences and the consequent low survival expectancy.
1.3
After surgery: adjuvant therapy with Temozolomide and role of
nanotechnologies
The treatment protocol for these tumors includes, in addition to the surgical treatment, the combination of adjuvant chemo- and radiotherapy. The drug typically used in the standard chemotherapeutic protocol is temozolomide, an imidazole derivative that is taken orally for five days a month for six months. Recent evidences of literature, however, suggest a possible greater efficacy of the drug, for prolonged doses over 6 months provided by the standard protocol (20). Pharmacokinetic and pharmacodynamic studies on temozolomide have found that this molecule has a very short plasma half-life (about 1.8 hours), so that an adequate concentration in glial cells can only be reached following the systemic administration of high doses. In addition, parenteral administration of this drug is normally avoided, as the preparation for intravenous administration ( lyophilized powder) has been reported as a possible cause of allergic reactions and haemolysis. Recently, laboratory experiments have been reported aiming to realize nanopharmaceuticals compounds by including the temozolomide molecule in liposomal carriers in order to increase the half-life of the drug and its ability to effectively cross the blood-brain barrier. The first pre-clinical experiments with liposomal vectors have reported encouraging results, however, the literature analysis shows a marked lack of data on the possibility of using temozolomide in combination with other engineered vectors (21). Furthermore, no studies have yet emerged to investigate the
possibility of administering temozolomide via different routes of administration. The blood-brain barrier (BBB) and the blood-CSF barrier (BCB) represent natural barriers that limit the spread and concentration of drugs within the central nervous system (CNS). The main physiological function of these barriers is to preserve the nervous structures from possible insults of pathogens of various kinds, constituting a filter for exchanges between the blood side and the CNS (22). Systemic
administration of drugs targeting the CNS must therefore take this limitation into account. BEE and BEL restrict the transport of CNS active drugs through two main methods: for hydrophilic drugs that cannot permeate the cell wall, the so-called "paracellular" transport through the tight junctions of BEE is highly limited by the same dimensions of molecules, whereby only the smallest
molecules can transit through the BEE; for lipophilic drugs that are able to cross the cell membrane, the "transcellular" crossing of the BEE is limited by the active action of proteins such as the P-glycoprotein (pgp) or the proteins of the family of the multridrug resistance-related proteins (MRRp ) that are located on the surface of the cell membrane. The transcellular way for the penetration of drugs within the CNS is therefore limited only to molecules that can interact with specific
membrane transporters that facilitate its transit. The possibility of exploiting alternative routes of administration for drugs that are difficult to penetrate BEE has led to the development of intra-thecal administration systems (22). However, these methods, besides being invasive and presenting risks associated with the administration procedure, make the CNS vulnerable to the penetration of
pathogens or harmful agents.
Starting from these premises, it has emerged in recent years, the need to identify safe and reproducible routes of administration for those drugs that are difficult to cross the blood-brain barrier. During the last decade, several research fields have been carried out in the
neuropharmacological field, in order to identify possible carriers for a series of drugs used in various pathological conditions of the CNS. These researches aimed to identify engineered vectors prepared with the help of nanotechnology methods able to facilitate the penetration of the CNS both of molecules already used for the treatment of neurodegenerative or neoplastic disorders and of drugs whose efficacy it is instead limited by the presence of BBB and / or BCB.
The studies conducted on the engineered vectors have associated the pre-clinical and clinical research lines on alternative routes to the traditional ones for CNS active drugs. In this sense, the intranasal administration of drugs able to exploit the nose-brain pathway seems to be a safe and effective method, which is showing promising results according to what emerges from the first scientific experiences in this regard (22,23).
From the studies reported in the literature on the route of intranasal administration of neurotropic drugs, it is clear that there are undeniable advantages linked to the nose-to-brain pathway (23).
Firstly, the bioavailability of the drugs administered through this path is increased by the lack of the effect of the "first pass". Secondly, the nose-brain pathway seems to bypass the transit of the
molecules through the blood-brain barrier, exploiting the pathway provided by the nerve endings of the cranial nerves (in particular the olfactory and trigeminal) and thus creating direct access to the brain. SNC. Finally, the rapid absorption of the drug through the nasal mucosa seems to guarantee an immediate efficacy of the drug in the face of a very minimally invasive and safe administration modality
2.
Aims
The objective of this thesis is the definition of a neuro-oncological protocol, to be reserved for patients with glioblastoma, which can establish a therapeutic path that starts with a safe and
effective surgery and continues with a pharmacological treatment that may lead to the limitations of current antitumor therapy schemes.
Two main research lines have been conducted, with these purposes: the first one, essentially clinical , has been analysed in two consecutive studies, first retrospectively, then prospectively, the results of the application of an intraoperative imaging protocol that foresees the use of Advanced
neuronavigation, intraoperative fluorescence and intraoperative CT. The second line of research was instead based on the attempt to obtain a pharmacological preparation which provided for the combination of temozolomide with nano-vectors, able to increase its antiblastic efficacy and to increase its chances of delivery at the intracranial level.
3.
Retrospective clinical study on intraoperative imaging
3.1
Methods
A total of 25 consecutive patients (Group A), including 15 men, with a mean age of 58 years (range, 30-80 years), were operated on between July 2010 and July 2014 at the Department of
Neurosurgery, Policlinico University Hospital, Catania, Italy, because of a suspected diagnosis of HGG. In all cases, image-guided surgery was also performed using portable i-CT. Preoperatively, MRI was performed according to institu- tional preoperative imaging protocol, including
volumetric gadolinium- enhanced T1, T2, fluid-attenuated inversion recovery sequences, spectroscopic analysis, diffusion-weighted images, and perfusion- weighted images; in all but 6 cases, a contrast-enhanced CT scan was also obtained. Two patients presented with recurrent neoplasms, and 4 patients had multifocal neoplasms.
Group A patients were compared with a historical consecutive series of 25 patients (Group B) (13 males), with a mean age of 61 years (range, 8-82 years), with glioblastomas; the latter group
underwent surgery before the introduction of portable CT at our institution assisted with 5-ALA and neuronavigation only. The same preoperative imaging studies as in Group A were performed in Group B. All patients in both groups were operated on by the same 3 surgeons. We included in the current study 2 consecutive series of patients treated at the same institution. The absence of bias related to differences of demographic data in both groups was statistically verified. 5-ALA
fluorescence guidance and neuronavigation were used in all patients in both groups. We performed an intended biopsy only in 1 patient in Group A. Afterward, in Group A patients, a postcontrast i
-CT scan was obtained to assess intraoperatively the EOTR; in the only case of a biopsy, intraoperative CT control was useful to verify the exact site of sampling and to rule out early hemorrhagic complications. However, this patient was excluded from the current analysis. Pre- and postoperative Karnofsky performance status (KPS) score was assessed in both patient groups as well as overall survival (OS) and progression-free survival (PFS) data. Pre- and postoperative KPS score was measured 1 day before surgery and on the day of discharge (usually postoperative day 5). In Group A patients, we used an 8-slice small-bore portable CT scanner (CereTom; NeuroLogica, Danvers, Massachusetts); a StealthStation S7 (Medtronic, Minneapolis, Minnesota) neuronavigation
system was used for surgery in both groups.
3.2
Results
In Group A, histopathology revealed 21 cases (84%) of glioblastoma, 2 cases of anaplastic
astrocytoma, and 2 of anaplastic oligodendroglioma, respectively. Conversely, all Group B tumors were diagnosed as glioblastomas.
In 8 of 25 Group A patients (32%), i-CT revealed intra- operatively unrecognized residual tumor; in 4 of these patients (16%) harboring a multifocal neoplasm, it helped to further resect the just seen neoplastic foci detached from the main tumor nodule and not detected by 5-ALA. In such cases, additional navigation-assisted resection was performed after importing the updated i-CT images into the navigation system (Table 1). Further exploration of those areas highlighted by the i-CT scan confirmed the presence of highly fluorescent tumor tissue. Correlation between residual tumor documented by i-CT and 5-ALA was evaluated using neuronavigation. Indeed, i-CT images were not affected by brain shift, and the enhancing tissue could be detected using the navigation probe. In all cases requiring further resection, we detected tumor fluorescent tissue covered by necrotic non- fluorescent tumor or normal nonfluorescent white matter. Moreover, neuronavigation documented in all cases a positive correlation between highly fluorescent tissue and i-CT contrast- enhancing
In 6 of 8 cases, we were able to see peripheral vague fluorescence around the edges of residual tumor (confirmed by neuronavigation). In such cases, the resection was extended to include those infiltrating areas. Revision surgery for residual tumor was never required. Only 1 patient in Group A experienced a postoperative hemorrhage that required a second surgery. Major complications
were not observed
in either group. One patient in Group B experienced a transient worsening of preoperative neurological conditions; however, these completely recovered before discharge.
EOTR Analysis
In Group A patients (excluding the case of intended biopsy), the preoperative mean volume was 30. 90 cm3; residual disease was found on 7 early postoperative MRI examinations, with a mean volume of 1.16 cm3.
In Group B, the preoperative mean volume was 36.90 cm3; residual tumor was found in 6 patients, with mean volume of 0.628 cm3.
With regard to Group A, patients with residual disease showed a mean 97.3% EOTR; in Group B, the mean resection rate was 98%.
The Student t test did not show any statistically significant difference in EOTR, measured by volumetric MRI, in the 2 groups (P = .5). Table 2 summarizes the results of the EOTR analysis (
Table 2).
The Student t test did not document statistically significant differences in age and sex distribution of both groups (P = .06 and .08, respectively). The KPS score changed from a preoperative mean of 67 to 69 after surgery in Group A and from a mean of 74 to 77 in Group B, respectively. Comparison of postoperative KPS score in both groups, verified by the application of the Student t test, did not show statistically significant differences (P = .07).
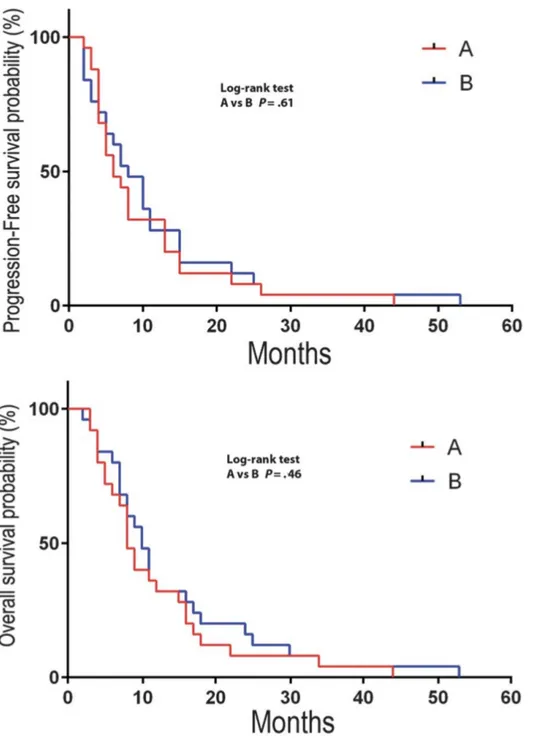
Groups A and B did not show differences in OS and PFS: P = .61 and .46, respectively, by the log-rank test (Figure 1).
Figure 1: Overall survival and progression-free survival according to the Kaplan-Meier method in group A and B patients showing no statistically significant difference.
4.
Prospective clinical study on intraoperative
imaging-guidance
50 patients (27 males), with a mean age of 63.8 years (range 49-82), suffering from radiologically suspected HGG (i.e. with evocative MR-spectroscopy) were prospectively enrolled and followed-up from June 2015. Patients with recurrent tumors, previous tumor biopsy or partial resections were not considered for inclusion. Paediatric patients as well as those with multifocal disease on MRI were also excluded. In all patients included, a complete resection of enhancing tumor was deemed feasible preoperatively. Radiological diagnosis was confirmed by histology in all cases; in cases with pathological findings not compatible with glioblastoma patients were subsequently excluded. Our standard MR protocol included volumetric T1-weighted, without and with gadolinium
enhancement, and volumetric FLAIR sequences as well as T2-,, DWI- and, MR-spectroscopy images. In 38 of 48 patients MR-DTI sequences were also acquired and 3D tractography was obtained to study pre- and intra-operatively anatomical relationship between tumors and white matter eloquent fibers. All exams were performed using the same MR machine (Philips 1.5T MRI systems) by three different neuroradiologists with proven experience in brain tumors. Volumetric evaluation of pre-operative MR was performed both on gadolinium-enhanced T1-weighted 3D sequences and FLAIR 3D sequences. Volumetric reconstruction and measurement was carried out using a manual segmentation method. StealthViz® (Medtronic Inc. - USA) software was used for
segmentation, 3D rendering and reconstruction as well as for volumetric measurements. On gadolinium-enhanced T1-weighted images, all slices showing pathological contrast enhancement were segmented and reconstructed. On FLAIR images segmentation was based on the differences in signal intensity found in the peritumoral areas. As known (24), the brain area surrounding the contrast-enhancing tumor has a higher signal intensity compared to the more distant white matter, showing a FLAIR signal similar to oedema observed in non-infiltrating tumors (i.e. meningioma, metastases). The edges of different peritumoral areas, with different signal intensity, were
determined by placing some regions of interest (ROIs) in the hyperintense brain surrounding the
lesion. This method allowed to estabilish a threshold to distinguish areas of “true” tumor infiltration
from areas of oedema/brain reaction. Based on such threshold, manual segmentation of the tumor, including peri-tumoral infiltrative areas, was performed on 3D FLAIR images. Consequently, for each patient a double volumetric evaluation was performed on pre-operative MR. Both 3D T1 and 3D FLAIR sequences, after segmentation and rendering, were made available for neuronavigation. All patients included underwent 5-ALA fluorescence guided resection. 1,5 grams of 5-ALA hydrochloride (5-ALA HCL, Gliolan, Medac GmbH - Germany) were administered 3 hours before anaesthesia to the patient. An ultraviolet filter integrated in the microscope lamp (OPMI Pentero – Zeiss - Germany) was used to stimulate fluorophores making visible the fluorescent tissues.
The StealthStation S7® (Medtronic Inc. - USA) navigation system was used in all cases.
Gadolinium-enhanced, T1-weighted, 3D sequences and FLAIR 3D sequences were used for
intraoperative navigation. The two datasets were merged before patients’ registration using the
software provided by the navigation system. T1-sequences were used as reference exams and optic
or electromagnetic skin tracer was used for patients’ registration. During microsurgery, continuous
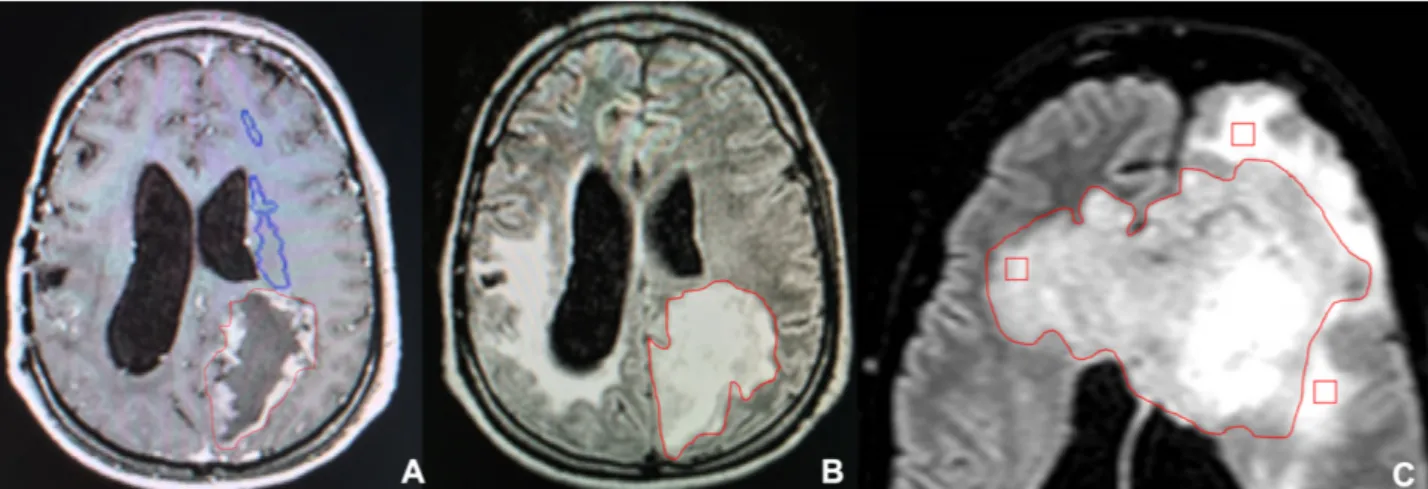
neuronavigation was performed, using the focus of the microscope (OPMI Pentero – Zeiss - Germany) as navigation pointer. Microsurgical videos (obtained alternating white and ultraviolet light) were also visualized on navigation system screen to obtain immediate comparison between MR images (Gad-T1 and FLAIR) and intraoperative findings. When resection of the enhancing tumor was deemed complete, according to Gad-T1 navigation data, all residual white matter areas still showing fluorescence were identified and localized with navigation. A comparison between abnormal areas based on gadolinium-enhancing T1 and FLAIR signal was then performed. All patients underwent post-operative MR within 48 hours after surgery. Post-operative MR protocol included volumetric T1-weighted, without and with gadolinium enhancement, and volumetric FLAIR sequences as well as T2- and DWI-weighted images. Hyperintense areas in the context of surgical cavity, visualized on T1 sequences before and after gadolinium administration, were interpreted as blood clots and not considered for the extent of tumor resection (EOTR) analysis. Volumetric measurement of residual tumor was made using the same method above described for pre-operative assessment on gadolinium-enhanced, T1-weighted and FLAIR images ( Figure 2). EOTR analysis was then performed by calculating the rate of tumor resection,
considering the values of pre- and post-operative tumor volumes on gadolinium-enhanced, T1-weighted and FLAIR sequences, according to the following formula (SANAI BERGER): [(
preoperative tumor volume – postoperative tumor volume) / preoperative tumor volume] x100 (16).
Figure 2: Manual segmentation based on T1-Gad (A) and FLAIR (B) sequences for volumetric evaluation of HGG. The segmented pathological area on FLAIR sequences was selected according to the hyperintensity value recorded by multiple ROIs placed in different peritumoral areas, in each
slice used for segmenation (C). In this case the yellow ROI revealed a lower hyperintensity value than two red ROIs periferically placed. This allows to differentiate tumor (yellow ROI), included in segmented areas, from edema (red ROIs) excluded from segmented lesion.
Overall Survival (OS) and Progression Free Survival (PFS) was recorded for each patient included in the study. For surviving patients who are still undergoing clinical and radiological follow-up every three months, survival data were calculated at last follow-up visit in January 2018. Tumor progression was defined according to the Response Assessment in Neuro-Oncology Criteria (
RANO Criteria) (25), based on a scheduled follow-up scheme including brain MR performed every three months. Positron Emission Tomography with 11-C L-Methionine (11CMet-PET) was also used to differentiate real tumor progression from radionecrosis or pseudoprogression. Karnofsky
Performance Score (KPS) was used to assess patients’ clinical status pre- and postoperatively and
during follow-up.
Statistical analysis was performed using the SPSS 22.0 software (IBM, New York - USA). Student T-test was used to verify the presence of statistically significant differences between pre-operative tumor volumes measured on T1 and FLAIR sequences. Linear regression analysis investigated the statistical correlation between survival and radiological data obtained from volumetric
measurements and EOTR assessment.
4.2
Results
Patients included in the present study did not experience major and minor complications related to surgery. We did not observe any death in the early post-operative period nor within the first month after surgery. All patients underwent the same post-operative adjuvant treatment, based on Stupp protocol. Radiotherapy with concomitant oral temozolomide was started within 50 days after
surgery.
Histologic examination revealed glioblastoma (G IV according to WHO) in 44/50 cases, gliosarcoma (GIV WHO) in 3/50 and anaplastic astrocytoma in 3/50.
Mean pre-operative tumor volume on gadolinium-enhanced, T1-weighted MR sequences was 54.9 cc (range 33.4cc - 89.7cc), whereas mean pre-operative tumor volume on FLAIR sequences was 72. 6 cc (range 39.5cc – 103.8 cc). Paired student T-test revealed statistically significant differences between the two series of data (p<0.05). Tumor volumes calculated on contrast-enhanced T1-weighted images were constantly smaller than those obtained from 3D FLAIR-T1-weighted sequences.
KPS changed form a mean pre-operative value of 75.4 to a mean post-operative value of 64.8. The KPS registered at last follow-up control was 76.6. No statistically significant differences in KPS variations were documented during follow-up (range 12-36 months).
Neurological worsening related to surgery was documented in 6/50 patients (12%). Three of these six patients suffered from permanent neurological deficits, whilst in the other three patients neurological impairment was transient and recovered within 3 months after surgery. In all cases experiencing post-operative neurological worsening, intraoperative neuromonitoring (cortical and subcortical electrical stimulation as well as MEPs and SSEPs recording) had been used.
In all patients, fluorescent areas were entirely resected if neuromonitoring ruled out the presence of eloquent tissue. Evidence of fluorescent tissue beyond the contrast-enhancing edges of the tumor, according to neuronavigation data, was documented in 47/50 patients (94 %). Interestingly, in such cases neuronavigation based on 3D FLAIR images revealed a constant correspondence between 5-ALA fluorescent and hyperintense areas, pre-operatively segmented as tumor and not oedema. Volumetric evaluation of EOTR based on gadolinium-enhanced, T1-weighted sequences
documented residual tumor in 3/50 (6%) patients. Mean residual tumor volume was 1.76cc (range 0 .9cc- 1.8cc). Conversely, EOTR evaluation based on FLAIR sequences revealed residual tumor in 33/50 (66%) patients. Mean residual tumor volume measured on 3D FLAIR images was 3.7cc ( range 0.4 cc – 8.7 cc). The mean EOTR rate calculated on the two different imaging modalities ( gadolinium-enhanced, T1-weighted and FLAIR MR sequences) resulted 99.8% (range 95.6%-100% ) and 93.45% (range 70.4%-100 %), respectively. Comparison of such data revealed statistically significant differences in post-operative residual tumor volumes according to the paired Student T-test (p<0.05).
Mean OS and PFS were, respectively, 23.12 months and 18.72 months. 9/50 patients (18%) are still alive and under follow-up.
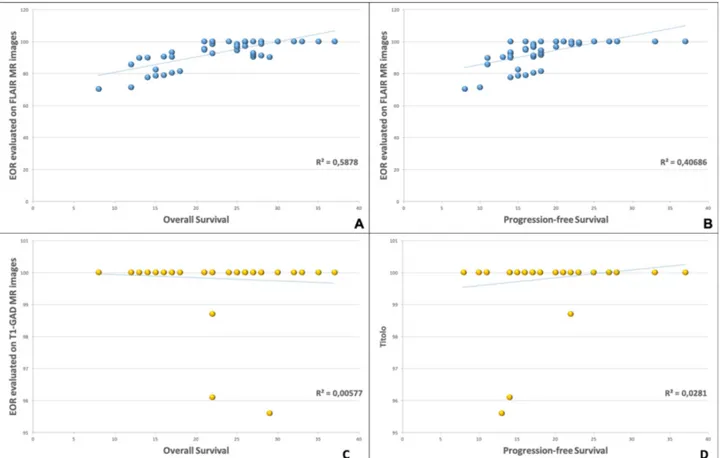
Linear regression analysis (Figure 3) revealed positive correlation between PFS and FLAIR-based EOTR rate (R2=0.41) as well as between OS and FLAIR-based EOTR rate (R2=0.59). Weak correlations were found relating PFS and OS to gadolinium-enhanced, T1-weighted-based EOTR ( R2=0.028 and 0.006, respectively). A stronger correlation was also found between residual tumor volume measured on FLAIR rather than on gadolinium-enhanced, T1-weighted MR images and overall survival (R2=0.28 and 0.007, respectively).
Figure 3: Linear regression analysis demonstrated the presence of a positive correlation between FLAIR-based Extent of tumor resection values and Overall Survival (A), and Progression Free survival (B). No significant correlation between survival parameters and T1-Gad-based Extent of resection evaluation was documented (C, D).
5.
In vitro experiments on temozolomide
5.1.1 Preparation of TMZ-loaded nanoparticles
The preparation of the temozolomide encapsulated in nanoparticles has already been described in the literature. Temozolomide (TMZ) has been purchased by Merck & Co., Inc. (Whitehouse Station
, NJ, USA). Different nanoparticles have been synthetized at Department of “Scienze del Farmaco”
University of Catania whereas nanoparticles combined with monoclonal antibodies have been
obtained at Department of “Biologia e Biotecnologie - Charles Darwin” Sapienza University, Rome .
In our experiments, we started investigating two different nanocarriers: poly lactic-co-glycolic acid
(PLGA) and chitosane. Both nanosystems were combined with temozolomide, and investigated “in vitro”.
Only the nanosystem created by the combination of PLGA with TMZ has been selected for in vivo experiments, for several reasons.
The encapsulation of TMZ in PLGA NPs has been already demonstrated as a suitable strategy to increase TMZ therapeutic efficacy and to overcome its limitations, as toxicity in healthy tissues by targeting the tumour cells. Also, TMZ encapsulation in PLGA NPs should enhance drug transport across the BBB and avoid drug recognition by p-glycoprotein pump in target cells circumventing drug efflux. Moreover, these NPs exhibit low synthesis complexity (26) and are able to maintain a controlled drug release for several days, decreasing the need for frequent drug administration and doses, minimizing the side effects in healthy tissues (27). The PLGA polymer can also be easily functionalized for the design of NPs with different targeting
moieties (28).
The steps of preparation of TMZ-loaded in PLGA-PEG nanoparticles included:
• PLGA, PEG and TMZ were dissolved in a solvent (ACETONE).
• TMZ (3 mg) and PLGA-PEG-FOL copolymer (30 mg) are dissolved in DMSO (3 mL) and
the DMSO solution is added dropwise (0.3 mL/min)
• Stirring for 2 hrs to allow diffusion of the organic solvent.
• The resulting solution has been centrifuged at 25,000 rpm for 30 min and the nanoparticles
that appeared as the pellet were subjected to freeze-drying.
• The lyophilised nanoparticles were weighed and dissolved in acetonitrile, and the amount of
encapsulated TMZ was determined by UV/Vis spectrophotometry
The steps of preparation of TMZ loaded in Chitosane nanoparticles
• TMZ (3 mg) and chitosane (30 mg) are dissolved in DMSO (3 mL) and the DMSO solution is added dropwise (0.3 mL/min)
• Stirring for 2 hrs to allow diffusion of the organic solvent.
• The resulting solution has been centrifuged at 25,000 rpm for 30 min and the nanoparticles that appeared as the pellet were subjected to freeze-drying.
• The lyophilised nanoparticles were weighted and dissolved in acetonitrile, and the amount of encapsulated TMZ was determined by UV/Vis spectrophotometry
5.1.2 Cell lines
Primary cell lines of glioblastoma U251 and U87 have been obtained from laboratories of
Department of “Scienze Biomediche e Biotecnologiche - Biometech” University of Catania used,
both derived from human glioblastoma and commonly used in pre-clinical studies on glioblastoma. The cytotoxicity towards these cell lines of the two nanopharmaceuticals obtained will be measured and compared with the temozolomide in standard formulation (free).All the used lines were
cultured in high-glucose Dulbecco's Modified Eagle medium (DMEM), supplemented with 10% fetal bovine serum (FBS) and 1% penicillin-streptomycin. Cells were maintained at 37 °C in a humidified 5% CO2 incubator. At 80% of confluence, the cells were trypsinized and subcultured. Both U251 and U87 cell lines were chosen since they show significant similarities with the genetic, immunohistochemical and histological and characteristics of human GBM tumor (29).
5.1.3 Preparation of TMZ-loaded mAb-PLGA NPs
TMZ-loaded PEG-PLGA NPs were prepared using also the single emulsion-solvent evaporation technique. 8 mg of non-modified PLGA was added to the previously prepared PEG-PLGA. Also 1 mg TMZ was added to the PLGA mixture in dichloromethane, and the remaining protocol was performed as described previously in section 5.1.2. The prepared NPs were next modified with OX26 mAb by a covalent coupling reaction at a molecular ratio of OX26 mAb: PEG-PLGA of 1:2. The maleimide group on PEG extremity reacts with thiol groups present on mAbs, after mAb
activation by Traut’s reagent. A drop of EDTA was added to prevent oxidation of the thiol groups (
30). The activated mAbs were separated from the excess reagents by size exclusion
chromatography (PD Minitrap G-25 columns containing Sphadex Medium, GE Healthcare, Sweden ). The activated mAbs were then added to the previously prepared PEG-PLGA NPs and incubated 1 h in the dark at RT, followed by overnight incubation at 4 °C. Non-attached antibody was removed by centrifugation (30 min, 14100 g).
5.1.4 PLGA NPs physicochemical characterization
The physicochemical features of the prepared NPs, as mean diameter, size distribution and zeta potential values, were assessed by Dynamic Light Scattering (DLS) and by laser doppler velocimetry methods. The measurements were performed in a ZetaSizer Nano ZS, Malvern
Instruments, UK. The average NP size was obtained by measuring the fluctuations of scattered light intensity as a function of time. These fluctuations can be related to the NPs diffusion coefficient and size, using the Stokes-Einstein Equation. The attained data is given in intensity distribution. The zeta potential data analysis was performed using the dielectric constant of water and the zeta potential values were estimated by Smoluchowski approximation from the electrophoretic mobility. The morphological analysis of the NPs was obtained by Transmission Electron Microscopy (TEM). The samples were visualized on copper grids (Formvar/Carbon-400 mesh Copper, Agar Scientific, UK) and negatively stained with a 2% (v/v) uranyl acetate solution.
5.1.5 TMZ encapsulation efficiency and release from PLGA NPs
The TMZ encapsulation efficiency (EE) and its release from PLGA NPs were determined by UV–Vis spectrophotometry at λmax 265 nm. Free TMZ was obtained from centrifugation of NPs suspension (30 min, 14100 g), and quantified using a calibration curve of known TMZ
concentrations (UV-1700 PharmaSpec, Shimadzu, Japan). The TMZ loading capacity of the prepared PLGA NPs was also determined by the following equation: (amount of encapsulated TMZ/polymer weight x 100).
In vitro temozolomide release studies were performed, over 20 days at 37° C, using a cellulose dialysis membrane diffusion technique. A sufficient amount of TMZ-loaded PLGA NPs was diluted in 2 mL of release buffer (PBS, pH 7.4, 0.01 M) and placed into a dialysis device (Float-A-Lyzer G2, CE, 10KDa, SpectrumLabs (Laguna Hills, CA)). The outside space of the dialysis device was filled with 4 mL of release buffer. At predetermined times, samples were collected from the outside medium and, after measurement by UV-Vis spectrophotometry, returned to the release medium. A solution of TMZ in PBS was used as control.
5.1.6 Cellular imaging studies
The NPs in vitro uptake in the human cells lines (U251, U87) was assessed using laser scanning confocal microscopy (LSCM) (Leica TCS SP5 II, Leica Microsystems, Germany). For that purpose, C6-loaded NPs were used. This fluorescent marker is distributed in the NPs matrix, allowing the visualization of the NPs inside the cellular compartments (31). 1000 cells/well were seeded in
12-well plates (Ibidi, Germany) and allowed to attach for 24 h (37 °C, in a humidified 5% CO2
incubator). Cells were then treated with mAb modified and unmodified C6-loaded NPs for 2 and 72 h. After the incubation period and subsequent wash with PBS, the cells were fixed with 4% (w/v) paraformaldehyde. The acidic cell compartments (as endosomes/lysosomes) were stained with LysoTracker® Red and cell nuclei were marked with DAPI. At least six images from different areas of each cell lines were acquired in emission mode. Untreated cells were also used control.
5.1.7 Quantification of in vitro cellular uptake of mAb-PLGA NPs
Cellular uptake of mAb-modified and unmodified PLGA NPs was quantified by a fluorescence assay using C6 loaded PLGA NPs. U251 and U87 cells were seeded in 96-well plates at a density of 8000 cells per well and allowed to attach for 24 h. Six NPs samples were diluted in cell culture medium at final polymer concentration of 50 μg/mL, and the cells were incubated with these
samples for 0.5 h and 2 h. At the end of the incubation period, the cells were washed with cold PBS to remove the non-internalized NPs. The cells were then lysed with 0.1% Triton X-100 in 0.1 N NaOH solution. The fluorescence intensity from C6-loaded NPs was measured using a fluorescence microplate reader (HT Microplate Spectrophotometer, BioTek) with excitation and emission wavelengths set at 430 and 485 nm, respectively.
5.1.8 Transferrin competitive binding assay
Transferrin blocking assay was used to confirm whether the mAb-PLGA NPs are internalized through transferrin receptor-mediated endocytosis. Competitive binding to TfRs was achieved using an excess of transferrin, and cellular uptake of PLGA NPs was quantified by fluorescence using C6 as mentioned above. U251, U87 and NHA cells were seeded in 96- well plates at a density of 8000 cells per well and allowed to attach for 24 h. Transferrin was diluted in cell culture medium and added to the cells at six final different concentrations ranging from 1 to 10 mg/mL. The same range of concentrations of folate was used as control. After 1 h, cells were incubated for 2 h with C6-NPs samples at final polymer concentration of 50 μg/mL.
At the end of the incubation period, the cells were washed and lysed as described in the previous section. The fluorescence intensity from C6-loaded NPs was measured with excitation and emission wavelengths set at 430 and 485 nm, respectively.
5.2.1 PLGA NPs physicochemical properties
Different TMZ-loaded nanoparticles were prepared during our experiments. In all the prepared formulations based on PLGA, PVA was used as an emulsion stabilizer since it has a high affinity to
PLGA and forms a uniform layer on the NPs’ surface, conferring stability against aggregation (32).
Maleimide-functionalized PEG was also used to allow covalent coupling of OX26 mAb at the PEG terminus with the chemically reactive end-group. The physicochemical properties of the prepared
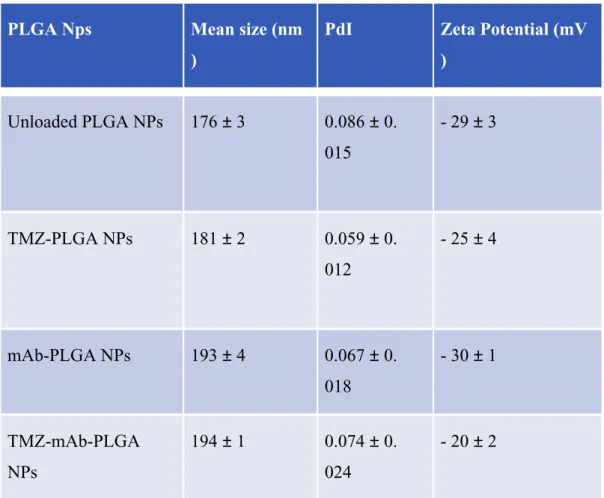
NPs were evaluated and are presented in Table 3.
PLGA Nps Mean size (nm
)
PdI Zeta Potential (mV
) Unloaded PLGA NPs 176 ± 3 0.086 ± 0. 015 - 29 ± 3 TMZ-PLGA NPs 181 ± 2 0.059 ± 0. 012 - 25 ± 4 mAb-PLGA NPs 193 ± 4 0.067 ± 0. 018 - 30 ± 1 TMZ-mAb-PLGA NPs 194 ± 1 0.074 ± 0. 024 - 20 ± 2
Table 3: Physicochemical features of different Nanoparticles
The prepared unloaded NPs exhibited a mean diameter of 176 ± 3 nm, and a zeta potential value of -29 ± 3 mV, negative as expected due to the negative charge of the carboxylic groups of PLGA polymer (Table 1). The TMZ molecules accommodation in the polymeric matrix caused a significant (p<0.05) increase in size for the TMZ-PLGA NPs (181 ± 2 nm).
Moreover, NPs mean size was also significantly increased with OX26 mAb modification (194 ± 1 nm) (p<0.05), indicating an efficient conjugation since the diameter of the globular antibody is
approximately 15 nm (33). The prepared nanocarriers exhibited a small size distribution (PdI ≤ 0.1). Loading of the NPs with TMZ did not significantly affect their zeta potential, however a small decrease was observed due to the adsorption of TMZ molecules on PLGA NPs surface, exerting a masking effect on the superficial net charge (34). The modification of the NPs’ surface with mAb
also does not significantly alter their zeta potential, due to the negative nature of this
immunoglobulin (p>0.05). The colloidal stability of the prepared NPs is a result of electric charge
of the carboxylic groups at the NP surfaces, and the PVA layer on the NP’s surface causing steric
repulsions. In fact, TEM demonstrates a stabilizer layer surrounding PLGA NPs. TEM also shows
uniform PLGA NPs with a spherical form. The mean size of the NPs revealed by TEM are in agreement with those determined by DLS analysis. NP dimensions and zeta potential are key parameters that affect the efficiency of NP systemic circulation, and uptake by target cells (35). Also transport across the BBB will depend on these parameters. Although mAb modification of the
NPs’ surface is expected to enhance the transport of NPs across the BBB through receptor-mediated
transport, these two physiochemical characteristics also are determining factors. Thus, these parameters were considered during the design of this nanosystem. The prepared mAb-modified PLGA NPs exhibit suitable physicochemical characteristics for cancer cell uptake and transport across themBBB. Since neutral and anionic NPs are more easily transported across the BBB and are not associated to BBB toxicity (36), most of the NP formulations described in the literature for brain delivery have moderate to high (between −1 to −45 mV) negative zeta potentials, as the one prepared in this work (37). It has also been proven that NPs with dimensions up to 200 nm are more easily accumulated in brain tissue (38) since tumor microenvironment exhibits vascular
fenestrations in the range of 40–200 nm (36). Also, NPs with dimensions up to 200 nm are more efficiently taken up by receptor-mediated endocytosis, as it was intended in this work with the use
of TfR (39).
The stability of the prepared NPs was assessed in terms of size and zeta potential, and no changes were observed (data not shown), proving that the developed system is stable at storage conditions (4 ºC), for at least one month. The binding ability of the mAb-modified NPs to TfR was evaluated by
ELISA assays.
OX26 mAb-modified NPs showed significantly higher absorbance at 405 nm (0.81 ± 0.05) than non -modified NPs (0.29 ± 0.08) (p<0.05). Therefore, OX26 mAb demonstrated that the bioactivity for the TfR is preserved after the mAb conjugation with the NPs.
PLGA NPs loaded with TMZ showed encapsulation efficiencies ranging from 48 ± 10% for mAb-PLGA NPs to 44 ± 3% for non-modified NPs, respectively. Drug loading varied from 10 ± 2% for mAb-PLGA NPs to 9 ± 1% of the polymer weight for non-modified NPs. These NPs were
subsequently evaluated for their ability to sustain the release of TMZ for cancer cell therapy. The in vitro release profile of TMZ from PLGA NPs was evaluated at 37 °C in PBS (pH 7.4, 0.01 M) to
mimic the physiological pH and salt concentrations.
The TMZ release can be justified by two possible mechanisms. In aqueous medium, the esters bonds of PLGA are hydrolyzed causing the erosion of the polymeric matrix, allowing the release of the entrapped TMZ molecules. TMZ is also released by diffusion through the polymeric matrix. Thus, the release rate of a drug will depend upon different factors such as drug physicochemical properties and geometry of drug-loaded PLGA NPs (size and shape) (39).
The dialysis method was used to compare the release of encapsulated TMZ with free TMZ. TMZ molecules were released in a biphasic release pattern, composed of an initial rapid released followed by a slower and controlled release, characteristic of PLGA NPs. As Figure 2 shows, 36± 6% of the total TMZ was released at the first 24 h for mAb-modified PLGA NPs and 43 ± 1% for non-modified NPs, respectively. When in aqueous medium, the surfaceadsorbed TMZ molecules are rapidly released from the NPs, explaining the verified burst release. The TMZ entrapped in NPs polymeric matrix exhibited a slower and controlled release for several days. The conjugation of mAbs on the surface of the PLGA NPs affected the TMZ release from the PLGA NPs, since it was observed a higher release from non-modified PLGA in comparison to mAb-PLGA NPs. Non-modified PLGA NPs exhibited a total release of TMZ (98 ± 2%) after 9 days, while mAb-Non-modified NPs only released about 78 ± 2% of entrapped TMZ at day 20 (Figure 4). These results may be explained by the mAb molecules linked to the surface of the NPs that may obstruct water permeation, hindering the diffusion of the drug molecules as previously reported (30).
Figure 4: In vitro temozolomide release studies were performed, over 20 days at 37° C, using a cellulose dialysis membrane diffusion technique.
5.2.3 Cell viability test
In the first step of the study U87 viability have been tested, using the first two compounds initially synthetized (Chitosane NPs and PLGA-PEG NPs): results are summarized in the following figures (
Figures 5, 6)
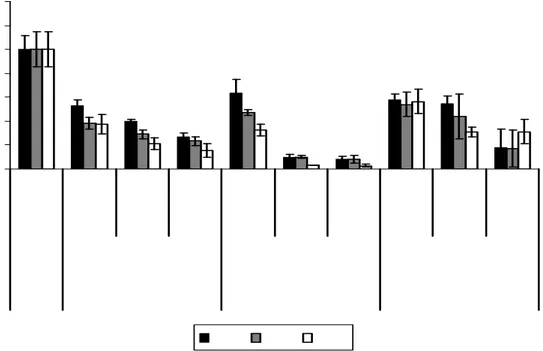
Figure 5: Cell viability at three times intervals of two different nanosystems at different
concentration compared with free Temozolomide.For NPs, the reported concentrations refer to quantity of TMZ that has been efficiently loaded into nanoparticles. Each result was compared to untreated cells (control).
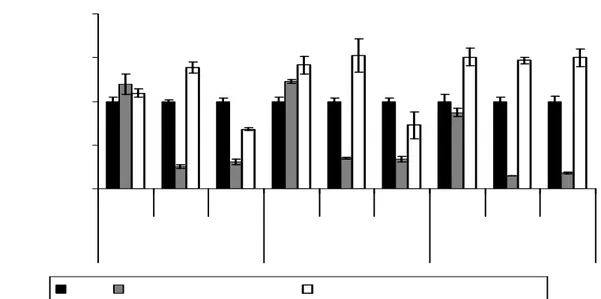
Figure 6: Cell viability at three times intervals of two different nanosystems at different
concentration compared with free Temozolomide.For NPs, the reported concentrations refer to quantity of TMZ that has been efficiently loaded into nanoparticles. Each result was compared to cell treatments with TMZ at same concentration and time of incubation.
5.2.4 In vitro cellular uptake of mAb-PLGA NPs
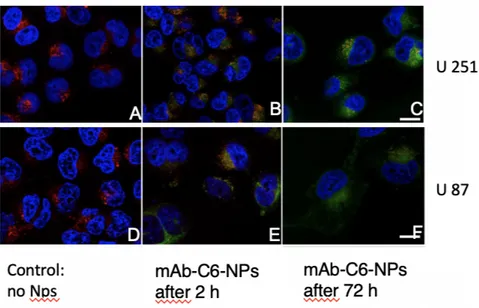
Coumarin-6 was used as fluorescence marker to visualize the cellular uptake of the prepared PLGA NPs by confocal microscopy, in malignant glioma cell lines, U87 and U251. This fluorescent dye is distributed in the NPsmatrix, allowing their visualization inside the cellular compartments since during the time of the experiment only about 13% of the dye is released from the NPs (data not shown). The cell nuclei were stained with DAPI and the acidic compartments, as endosomes and lysosomes, with LysoTracker Deep Red. The confocal images of non-treated and mAb-C6-PLGA NPs treated cells are presented in Figure 7.
The colocalization of PLGA NPs within the late endosomes/lysosomes is represented by the
yellow/orange color. Scale bar: 25 μm. After 2 h incubation, the NPs were uptaken by all the treated cells. The colocalization of C6-NPs and lysotracker-stained lysosomes is represented by the
yellow/orange dots, due to the combined fluorescence of green and red emission, respectively (40), suggesting that the NPs are internalized by an endocytic mechanism (Figures 7B and 7E). Also, as
shown in Figures 7C and 7F, after 72 h incubation it is possible to visualize the NPs in the cytoplasm, suggesting that the NPs can escape the endo-lysosomal compartments. The images
after 72 h incubation also show a decrease in the number of cells, due to the antiproliferative activity of the TMZ entrapped in the NPs. All the attained results suggest that these mAb-PLGA NPs, being internalized by endocytosis mechanism, are able to efficiently perform as cytoplasmic drug delivery vehicles, avoiding multidrug resistance mechanisms such as TMZ efflux from target cells.
Figure 7: Confocal microscopy. Coumarin-6 was used as fluorescence marker: nuclei are marked in blue, the acidic compartments (late endosomes/lysosomes) in red and the mAb-C6-NPs in green.
5.2.5 Selective cellular uptake of mAb-PLGA NPs
C-6 was also used to quantify the cellular internalization of the PLGA NPs in U251 and U87 cell lines. The cellular internalization of mAb-modified and non-modified PLGA NPs was measured after 0.5 and 2 h of incubation, respectively.
As the attained results show, the NPs were efficiently internalized by the cells, showing that the longer the incubation time, the higher the cellular uptake (p<0.05). Also, modification of the PLGA NPs surface with mAb for Transferrin Receptor (TfR) significantly increased the cellular
internalization in all the studied cell lines for 2 h incubation period (p<0.05). Cellular uptake of mAb-NPs by U251 cells after 0.5 h and 2 h of incubation was found to be 1.89 and 1.37-fold higher than unmodified NPs, respectively. For U87 cells, the cellular uptake for mAb-NPs was 1.70 and 1. 41-fold higher in 0.5 and 2 h incubation, respectively.
Tf competitive binding assay was used to investigate how TfR impacts the mAb-PLGA NPs cell internalization. Cells were pre-treated with increasing doses of Tf to block the TfR before the
incubation with NPs. As Figure 4D shows, cellular internalization of mAb-NPs significantly decreased with blockage of TfR in a dose-depend manner, in all the studied cell lines (p<0.05). It was observed a decrease between 43 and 48% in the internalization of mAb-NPs when using 10 mg/mL of Tf. Blockage of the TfR did not affect the internalization of the non-modified NPs. The same blocking experiment, using folate instead of TfR, was used as control, showing that
pretreatment with folate did not exhibit any effects on the mAb-NPs uptake. Confocal studies displaying NPs in late endosomes/lysosomes suggest that these NPs are selectively uptaken by TfR-mediated endocytosis.
6.
In vivo experiments on temozolomide
6.1Methods
6.1.1 Model of glioma-bearing rats
Ten male Sprague-Dawley rats (weighing 180–220 g) were maintained at 22° C on a 12-h light/dark cycle in polyethylene cages with ad libitum access to food and water. GBM development was induced by intracranial implantation of C6 cells.
Rats were anesthetized by intraperitoneal (i.p.) injection of 10% chloral hydrate (0.4 mL/kg), and then C6 cells (1x10⁶ cells in 6 lL of DMEM) were injected stereotactically into the right caudate nucleus (3mm lateral to the bregma and 5mm deep from the dura) using a microsyringe (Hua et al., 2018). The wounds were closed with sutures and sterilized with iodophor. Antibiotic drug was injected intramuscularly, and the rats were carefully monitored until recovery from anesthesia. After implant, the animals provided with free access to standard chow pellets, water and were housed in colony cages with the environmentally controlled conditions. The animals were divided
into 5 groups consisting of 2 animals and formulations were administered gently in rats’ nostril to
inhale the each formulations.
The formulations were delicately administred (in order to avoid mucosal damages) using 2cm polyethylene tube attached to micro syringe.
6.1.2 In vivo brain distribution of NPs
The brain hemispheres collected after sacrificing rats were washed and dissected. The brains were homogenized by adding methanol and stored at -20°C until use. The sample was mixed with internal standard, i.e., caffeine (500 ng/mL), and acetonitrile (2mL) was added to precipitate the protein. 2mL diethyl ether added to above sample to extract the TMZ and then centrifuged at 4000 rpm for 5 min. The supernatant was collected, evaporated and the dried sample was reconstituted with the mobile phase, filtered with 0.2μm nylon membrane filter before analysis. The brain concentration time was evaluated by pharmacokinetic software (Microsoft Excel, Pharsight Corporation, Mountain View, CA).
6.1.3 In vivo anti-glioma activity
To evaluate the in vivo anti-glioma activity of three different nanosystems, intracranial glioma-bearing rats were divided into five groups which were administered intranasally with saline ( controls), free temozolomide (TMZ), TMZ loaded in PLGA-PEG NPs, TMZ loaded in mAb-PLGA NPs and TMZ loaded in Chitosane NPs. For all nanosystems a dose of 5 mg/kg of TMZ was
calculated. Administrations were performed at 6, 7, 8, 9, and 10 days after C6 cell implantation. On the 15th day, one rat from each group was sacrificed, and the brain was isolated to prepare paraffin
sections. The other rat (one per group) was used to calculate survival times.
6.2
Results
6.2.1 TMZ brain concentration
The concentration of TMZ in brain was estimated on the 15th day after C6 cell implantation in all
groups after administration of formulations. The concentration of TMZ in brain after administration of TMZ-Chitosane was found to be significantly higher than TMZ-PLGAPEG NPs (Table 4). Conversely, administration of TMZ loaded in mAb-PLGAPEG NPs generates a lower brain concentration of TMZ compared to TMZ-PLGAPEG NPs
This result indicated that the presence of lipid and chitosane in the formulation act as a permeation enhancer and adhered for a longer period of time. The addition of chitosan as mucoadhesive polymer plays an important role in enhancing the brain uptake by giving prolonged contact time with mucosa. The higher brain concentration was achieved with TMZ-Chitosane NPs compared to TMZ-PLGAPEG NPs, showing the superiority of Chitosane as enhancer for the brain delivery by intra-nasal route. Despite the adjunct of monoclonal antibody has been conceived to potentiate brain targeting, the concentration of temozolomide in the rat treatetd with TMZ-mAb-PLGAPEG NPs was lower compared to TMZ-PLGAPEG NPs. These results are similar to those reported in the literature on nose-to-brain delivery of particle up to 200 nm in diameter (43). The administration of drug by intranasal route effords the olfactory and trigeminal nerve for drug transport from nasal epithelium to brain, bypassing BBB, which may not take place with the administration of other
routes (44).
Glioma-bearing rats were used to evaluate the anti-glioma effects of different nanosystem we tested , the survival times were 15 days for rat treated with TMZ-Chitosane NP, 16 days for rat treated with saline, 17 days for rat treated with free TMZ, 19 days for rat treated with TMZ-PLGAPEG NP, and 20 days for rat treated with TMZ-mAb-PLGAPEG NP. The short survival of rat treated with TMZ-Chitosane NP can be interpreted as the result of a toxic effect of Chitosane or TMZ on normal brain. Indeed, a similar survival time was observed in rat treated with free TMZ.
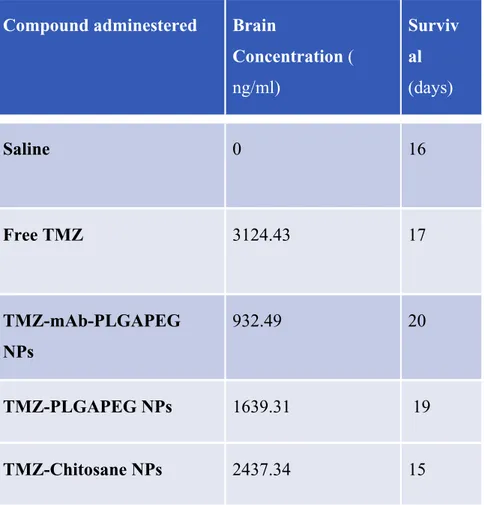
Compound adminestered Brain
Concentration ( ng/ml) Surviv al (days) Saline 0 16 Free TMZ 3124.43 17 TMZ-mAb-PLGAPEG NPs 932.49 20 TMZ-PLGAPEG NPs 1639.31 19 TMZ-Chitosane NPs 2437.34 15
7.
Discussion
7.1
Strategies to improve surgical and clinical outcome
Extent of tumor resection is a survival predictor in brain tumor surgery (45). The role of surgery in the multidisciplinary management of HGG, particularly in increasing time-to-progression and overall survival, has been clearly demonstrated and several evidences have been published (46,47). However, HGG have intrinsic radiological, histological, anatomo-pathological and biological heterogeneity, which make difficult the oncological approach. Indeed, HGG, often identified as the most infiltrating and aggressive tumors, are likely to be considered as the manifestation of a
complex process of tumorigenesis involving not only the “visible” tumor but also the peritumoral areas.
For several years, glioblastoma peritumoral areas have been considered as regions of tumor infiltration, where tumor cells could be found intermingled with normal brain tissue. According to the commonly used neuro-oncological protocols, such areas are targeted by radiation therapy, and temozolomide-based chemotherapy can act as a cytostatic agent.
In routine neurosurgical practice, resection of HGG aims to safely remove all the visible tumor respecting neurological functions. However, all strategies aiming to increase the EOR in brain tumor surgery (i.e. 5-ALA, intraoperative imaging tools) have the potential risk to resect eloquent brain, particularly in infiltrating areas. Indeed, the old concept of neuro-oncological surgery stating
that “where there is tumor, function is not present” has been definitely deny by the evidence that
tumor cells infiltrating normal white matter are often identified in the context of functioning cortical areas and subcortical pathways (6,48).
Recently, the role of 5-ALA in detection of infiltrating tumor areas has been investigated. Lau et al., published in 2016 a prospective phase II clinical trial, which correlated cellularity with fluorescence
intensity in high-grade brain gliomas. This study demonstrated a direct correlation between 5-ALA
fluorescence intensity and rate of gliomas’ infiltration. Interestingly, in the same study, authors
highlighted some limitations in the use of 5-ALA, which can generate false positive, particularly in peritumoral areas (49).
Intuitively, resection of peritumoral areas of glioblastoma should have a positive impact on survival parameters and delay recurrence, as the increased cytoreductive effect of the so-called
supramaximal resection could improve survival. Evidences on the positive correlation between tumor resection pushed beyond the margins of enhancing tumor are coming from recently published studies. Eyupoglu et al. reported the results of a series of patients undergone supra-complete
resection of glioblastoma, based on 5-ALA vaguely positive areas surrounding enhancing tumor. They found prolongation of survival associated to supra-complete resection of all 5-ALA positive areas, including vaguely fluorescent ones (50).
In 2015, Li et al. published the results of a retrospective analysis on a large cohort of patients undergone surgery for HGG (51). They performed a review of 1229 operated cases, finding that gross total resection (i.e.: complete resection of enhancing tumor) was achieved in 71% of cases ( 876 patients). A subgroup of these patients, received a resection of ≥53.21% of the surrounding FLAIR abnormality beyond the 100% contrast-enhancing resection. In such subgroup a significant prolongation of survival, compared with that following only resection of enhancing tumor, has been documented by authors. The paper by Li et al. is important because it introduced for the first time the concept of resection of FLAIR-positive abnormalities surrounding the enhancing tumor. Nevertheless, this study lacks of a volumetric evaluation of EOTR of FLAIR-positive areas and such supramaximal resection has been only retrospectively analyzed and documented. Volumetric assessment of resection, in modern neuro-oncology, is considered the most accurate method to objectively evaluate EOTR and it should be applied not only for research purposes but also for routine clinical use, as recently highlighted by Henker et al (52).
Our study introduces a surgical protocol aiming to obtain an aware and quantifiable supra-maximal resection of glioblastoma. Stating the limits of 5-ALA focused on by Lau (49) and the promising results coming from the other reported clinical experiences, we hypothesized that neuronavigation of FLAIR sequences and pre-operatively planning of FLAIR-based resection represent a more reliable approach to guarantee a safe and accurate supra-maximal resection.
FLAIR sequences have been studied and applied to low-grade tumour pre- and post-operative evaluation for several years. Nowadays, the role of FLAIR images role in surgical planning of HGG is emerging (53,54). The usefulness of FLAIR sequences depends on the suppression of CSF artefacts, particularly in cases of cortical-subcortical lesions, having a wide extension and involving
more than one lobe or periventricular areas. In particular, FLAIR sequences are used in high-grade gliomas for radiotherapy planning, although different problems are known: radiation effects, reduction in corticosteroid doses, demyelination, ischemic injury and other post-treatment effects, may alter the tumour volume evaluation (53). Similar problems are evaluated for pre-surgical planning: if FLAIR sequences are optimal to evaluate volumes and growth of LGG, in HGG the major problem is represented by the peri-tumoral oedema, a problem known from the beginning in
FLAIR use (53). Perilesional margins, not comprised in a T1 gadolimium-enhanced sequence, are composed by a mass-reactive oedema and a low-density tumour-cells infiltration. The greatest problem is the inability of FLAIR to clearly distinguish the second component from the first one ( 55). Different studies have tried to solve this issue, improving details of radiological acquisition techniques and their elaboration, also trying to create an auto-elaborating software to investigate the grade of tumour infiltration and follow the evolution post of neuro-radiological features (54,55). In our series, the FLAIR segmentation has been verified evaluating the differences of MR signal detected by multiple ROIs placed in peritumoral areas. This method has been validated and used also in radiosurgery (54), demonstrating a good reliability in definition of tumoral infiltration pathway.
The application of volumetric assessment as well as the precise definition of boundaries of FLAIR positive tumor, are likely associated to a more accurate pre-operative planning and post-operative evaluation of resection. Indeed, our results, albeit limited to a small cohort, seem to demonstrate the existence of a direct and constant correlation between the extended tumor resection, which also includes peritumoral infiltrating areas, and survival. In particular, we found that a higher percentage of FLAIR based EOTR is related to a prolonged Overall Survival. This suggests a possible positive impact of the proposed protocol on clinical outcome.
Another interesting finding of our study is the results of analysis of residual tumor evaluated by FLAIR images. As demonstrated by recent evidences (56), residual tumor is a negative predictor factor of survival in glioblastoma and a residual tumor volume smaller than 2 cm3 can guarantee a
meaningful increase of clinical outcome. We performed a volumetric evaluation of residual tumor both on T1 gadolinium-enhanced and on FLAIR sequences. We did not find statistically significant correlation between residual tumor measured by T1 nor by FLAIR sequences and survival.
However, the statistical strength of correlation resulted higher for FLAIR evaluated residual tumor volume. This finding is explainable as a complete (i.e.: 100% of EOTR) resection of FLAIR contoured tumor is often not achievable (to preserve neurological functions) also in most of cases harbouring 100% of T1 enhaning tumor resection.
We did not include in our analysis data concerning biomolecular asset of tumors, as such data were not available for all patients. However, correlation and regression analysis used for statistical interpretation of our data has been conceived to investigate the independent role of FLAIR-based
resection in improvement of clinical parameters, regardless of other patients’ related factors.
7.2
Strategies to increase the effectiveness of adjuvant therapy:
nanotechnologies to overcome BBB
The heterogeneity of GB, in combination with its high infiltrative nature, determine a poor outcome for standard treatments. To overcome these hurdles, different targeting strategies have been adopted for developing effective nanostructured delivery systems (NDS) to the brain. There are many strategies described to direct NPs to the brain tumor, including the use of nanotechnology coupled with passive, active or stimuli responsive targeting approaches (57-61).
Nanotechnology provides endless opportunities in the area of cancer treatment using targeted anticancer drug delivery systems. For that, NPs have to be appropriately studied and designed to accomplish the greatest therapeutic and/or diagnostic effect with reduced side effects, especially for chemotherapy drugs (62). NPs are complex drug delivery systems, which can be structurally divided into the external layer (shell) and internal layer (core). The shell can be functionalized with a variety of small molecules, polymers, polysaccharides, proteins and metal ions; the core, a central part of the NPs, can be chemically combined with different materials. NPs are flexible and versatile, with an architecture that ensure small size, appropriate shape, and surface functionalization, in order to accomplish the objectives of the proposed function. NPs have been shown to improve
pharmacokinetics of available drugs, by reducing drug biodistribution to non-target compartments, delivering the adequate amount of the drug into the right site, overcoming solubility and stability issues and allowing higher drug encapsulation. Regarding the complexity of BBB and/or BBTB, NPs offer the possibility to encapsulate hydrophilic anticancer drugs, increase the blood circulation and tissue distribution, with improvement of their preferential accumulation at the tumor site. Additionally, NPs have been described to overcome multi-drug resistance mechanisms. Several nanostructured delivery systems (NDS) have been developed for brain tumor delivery, and
depending on the nature and composition, they can be classified as organic NPs and inorganic NPs ( 63). Organic NPs are described as being composed by organic compounds, including lipids,