CORSO DI DOTTORATO DI RICERCA IN
“GENETICA E BIOLOGIA CELLULARE”
XXII CICLO
Cell growth density affects the
structural and functional properties
of Caco-2 differentiated monolayer
BIO/11
Coordinatore: Prof. Giorgio PRANTERA
(Dip. Agrobiologia e Agrochimica, Univ. La Tuscia, Viterbo)
Tutor: Dr. Armando FELSANI
(CNR - INMM, Roma).
Dottorando:
Manuela NATOLI
1
Table of content
Table of content ... 1 Abstract ... 3 Sommario ... 4 Introduction ... 6
The intestine: morphology and functions ...8
The enterocyte ...9
The tight junctions ...11
The Caco-2 intestinal cell line ...13
The cell line variability ...15
Materials and Methods ... 17
Caco-2 cell line maintanence and differentiation ...17
Plating efficiency assay ...17
Copper toxicity assay ...17
Cell cycle ...18
Western Blot analysis ...18
Total RNA preparation ...18
Real-time RT-PCR analysis ...19
Whole genome expression profiling ...19
Fluorescence and immunofluorescence microscopy ...21
Results ... 23
The “Low Density” (LD) cell-line maintaining protocol ...23
LD cells have a higher cell proliferation rate ...23
LD cells show a slower exit from cell cycle but express the same level of differentiation markers as compared to the HD cells ...26
The differentiated LD Caco-2 cells possess a well-defined enterocyte-like gene expression profile ...28
Cell-growth density deeply influence the architecture of polarized monolayer ...34
Cell-growth density affects the Caco-2 response to toxic injury ...36
Discussion ... 39
Acknowledgements ... 42
Bibliography ... 43
Appendix I – Supplementary Data ... 47
Appendix II ... 53
3
Abstract
The human intestinal Caco-2 cell line has been extensively used as a model of the intestinal barrier. However, it is widely reported in literature that culture-related conditions, as well as the different Caco-2 cell lines utilized in different laboratories, often lead to problems of reproducibility making difficult to compare results. We developed a new cell-growth protocol in which Caco-2 cells were subcultured at 50% of confluence (Low Density, LD) instead of 90% of confluence, as usually reported in literature (High Density, HD). Using this new protocol, Caco-2 cells retained a higher proliferation potential resulting in a cell population, which, reaching confluence was able to differentiate almost synchronously, forming a more homogeneous and perfectly polarized cell monolayer, as compared to that obtained with the HD cells. This comparison has been done by analyzing the gene expression and the structural characteristics of the 21-days differentiated monolayers by microarrays hybridization and by confocal microscopy.
We then investigated if these differences could also modify the effects of toxicants on 21-days-differentiated LD and HD cells. We analyzed the 2 hours-acute toxicity of CuCl2 in terms of actin depolymerization and MT2A (metallothionein 2A) and HSPA1A
(heat shock protein 70) genes induction. Copper treatment resulted in different levels of actin depolymerization and gene expression induction in relationship with the culture protocol, the LD cells showing a more homogeneous and stronger response. Our results suggest that cell growth density could influence a number of morphological and physiological properties of differentiated Caco-2 cells and these effects must be taken in account when these cells are used as intestinal model.
4
Sommario
Le cellule intestinali umani Caco-2 sono largamente utilizzate come modello in vitro della barriera intestinale negli studi di farmacocinetica e farmacodinamica; tuttavia in letteratura è riportata l’alta variabilità di questo modello riguardo alle condizioni di coltura cellulare e i cloni di Caco-2 che sono utilizzati. In questo lavoro è stato sviluppato un nuovo protocollo di mantenimento della linea cellulare che prevede la sottocoltura delle cellule quando nella piastra di coltura si raggiunge il 50% di confluenza (Low Density, LD) piuttosto che il consueto 90% (High Density, HD) riportato in letteratura.
Utilizzando questo protocollo (LD) le cellule Caco-2 mantengono un alto potenziale proliferativo che produce un’omogeneità nell’inizio del differenziamento e quindi una strutturazione più omogenea del monostrato cellulare durante e alla fine del differenziamento. Abbiamo quindi condotto uno studio di comparazione delle cellule Caco-2 LD e HD a livello morfologico tramite microscopia confocale e a livello genico tramite la tecnologia microarray.
In seguito abbiamo condotto uno studio fisiologico di risposta tossica andando ad analizzare le differenze tra le cellule HD e LD durante e dopo l’esposizione del monostrato differenziato a concentrazioni crescenti di cloruro di rame. Abbiamo analizzato nelle due ora la depolimerizzazione dell’actina filamentosa tramite microscopia e l’induzione genica di metallotioneina 2A (MT2A) e heat shock protein 70 (HSPA1A). Il trattamento con rame ha evidenziato una differente sensibilità del modello alle concentrazioni utilizzate con una risposta fisiologica più omogenea nelle cellule LD.
In conclusione i nostri risultati suggeriscono una diretta influenza delle procedure di mantenimento della linea cellulare sulle caratteristiche morfologiche e fisiologiche delle cellule Caco-2; queste differenze non possono quindi essere trascurate nel momento in cui questa linea cellulare è utilizzata come modello intestinale umano in vitro negli studi di predittività dei farmaci.
5 To my family
6
Introduction
In the last twenty years animal experimentation has been supplemented and in some cases replaced with in vitro models in particular in the branch of pharmacokinetics and pharmacodynamics. Advances in combinatorial chemistry have revolutionized the field of drug discovery, producing an increasing number of compounds which need to be tested. In this context, the US Food and Drug Administration (FDA) developed a new guideline for bioequivalence studies based on the biopharmaceutical classification system (BCS) in which solubility and permeability are considered fundamental properties to define the rate of absorption of the active ingredient of a drug product (van de Waterbeemd, 1998).
To define these two parameters, many studies on intestine in vitro models have been done in the context of the FDA directive and many cell lines are still under investigation to define the best predictive models for biopharmaceutical studies.
The human Caco-2 cell line is one of the most used cell model to study absorption, metabolism and bioavailability of drugs and xenobiotics (Artursson et al., 2001). Notwithstanding it represents a well established and accepted in vitro model for the human intestinal epithelium and its use is recognized by the FDA (Kim et al., 2006; van de Waterbeemd, 1998), many papers claim that cell culture conditions, such as the composition of the medium and the culturing system adopted, as well as the passage number, could affect Caco-2 cells differentiation and transport properties (Sambuy et al., 2005; Briske-Anderson et al., 1997). The Caco-2 cell population maintained in culture is characterized by an intraclonal variability revealed by the presence of subpopulations with different morphologies (Vachon and Beaulieu, 1992) and different physiological characteristics (Vachon et al., 1996; Mahraoui et al., 1992).This property of Caco-2 cells led to the existence of different clones maintained in different laboratories. This fact plus the variability of culture protocols often makes the comparison of results obtained in different laboratories particularly difficult.
In the last few years many studies have been focused on the inter-laboratories variability produced by the cell-culture related factors such as the animal serum used, the supplements added to the culture media, the passage number and the source of the clones (Zucco et al., 2005; Briske-Anderson et al., 1997). Although all these studies underlined the importance of the cell-culture related factors for the reproducibility between
7 laboratories, up to date, there are no studies that focused on the necessity to standardize the protocols used to manage the propagation of this cell line.
Caco-2 cells differentiate spontaneously in culture without supplementation of differentiating factors and, usually, standard protocols recommend to split cell cultures when they have almost reached the confluence. In a cell model in which the start of differentiation is not under the operator control, it is probable that the intraclonal variability could be strongly influenced by the degree of confluence decided in that particular laboratory.
Since the Caco-2 cell line still remains one of the best choices to study the intestinal physiology, the aim of this study is to define how the splitting confluence could influence the capability of this cell line to differentiate correctly in a structurally and functionally mature enterocyte.
8
The intestine: morphology and functions
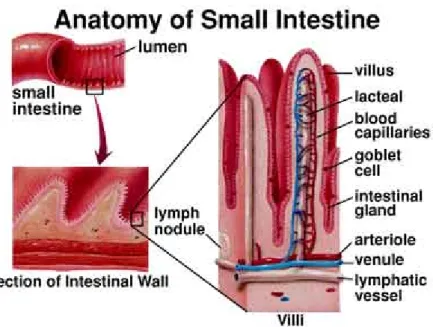
The intestine is a highly coiled muscular tube secured to the peritoneum in the abdominal cavity; in humans we can divide the intestine in two portions: small ( 6-7 meters) and large (1.5 meters). In the small intestine the whole process of nutrient absorption is carried out, while in the large intestine occurs the recovery of water and minerals that serves the digestion.
Fig 1 Anatomy of small intestine
The small intestine is further divided in three segments according to the functions they perform: duodenum (in which are conveyed secretions of liver and pancreas), jejunum (in which nutrients are digested to small organic molecules and absorbed into the bloodstream) and ilium (where the absorbing processes are completed).
The entire luminal surface of the small intestine has villi, small projections of mucosa. The villi are lined with simple columnar epithelial cells, also called enterocytes.
The enterocytes are tall cells with middle to basal nuclei and have an apical brush border, also known as microvilli. Both villi and microvilli function to increase the surface area for greater absorption.
Between each villus there are the crypts of Leiberkuhn, also known as intestinal glands, another component of the mucosa. These empty at the base of the villi and extend into the lamina propria. The crypts are lined with the same columnar epithelial cells (enterocytes) and goblet cells as the surface and also house stem cells for the replication of
9 all intestinal cell types. In the staminal compartment stem cells divide to generate two daughter cells of which the first will continue its staminal life while the latter will differentiate in the constituent cells of the villus.
Concerning the enterocytes they divide, differentiate and migrate up towards the tip of the villus, where they eventually exfoliate.
Fig 2 Schematic representation of the migration of the ienterocyte along the
cripta-villus direction (Gordon 1989
Enteroendocrine paracrine cells are also located in the crypts. They secrete hormones into the capillaries that run through the lamina propria to locally regulate intestinal activity.
The enterocyte
Enterocytes are polarized prism-like cells with the apical compartment faced toward the lumen of the intestine and the basolateral compartment connected with the bloodstream.
The polarization of these cells is guaranteed by a well organized and structured network of intercellular junctions such as tight junctions, adherens junctions and desmosomes that divide the apical domain from the basolateral domain of the cell.
10 The nucleus is located at the base of the cell whereas the golgi apparatus and lysosomes are positioned in the supernuclear portion of the enterocyte.
Fig 3 Schematic representation of a mature enterocyte
The apical domain of the enterocyte is distinguished by the presence of microvilli (that constitute the brush-border) and by the presence of the structural connecting tight junctions between cells.
The microvilli are constituted with an internal cytoskeleton of actin that run all over the length of the microvillus. This cytoskeleton is connected with its terminal web of intermediate filaments to a net of microtubules at the base of the microvillus.
Fig 4 cytosckeleton of the brush border
The terminal web of the intermediate filaments is further connected to the entire enterocyte by proteic bridges between myosin type I and calmodulin (Cheney and
11 Mooseker, 1992); moreover filaments of actin are also connected to proteins villin and fimbrin (Mooseker, 1985). In particular villin is part of the microtubules and constitutes the internal portion of the microvillus.
The apical membrane of the enterocyte is directly involved in the interactions between cells and intestinal lumen and most of the enzymes and transporters crucial for the intestinal absorption are on the microvilli.
The enzymes can be divided according to their activity as: glicosidases (sucrase-isomaltase, lactase, maltase-glucoamidase, trealase); peptidases (aminopeptidase-N and A, dipeptil-peptidase IV) and the lipases.
The tight junctions
Tight junctions (TJ) form a continuous, circumferential, belt like structure at the luminal end of the intercellular space, where it serves as a gatekeeper of the paracellular pathway.
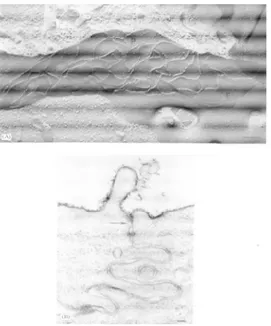
On the cytoplasmic side of the TJ, the TJ plaque is the site of a growing number of TJ-associated protein complexes. Within the confines of the TJ, the cell membranes of adjacent epithelial cells are brought into intimate focal contact sites in which the intercellular space is obliterated. Freeze-fracture electron microscopy reveals these to be a network of strands within the plane of the plasma membranes of neighboring cells.
Fig 5 Structure of tight junctions. A) electron microscopy image of tight junctions after freeze-fracture.
B) Tight junction section
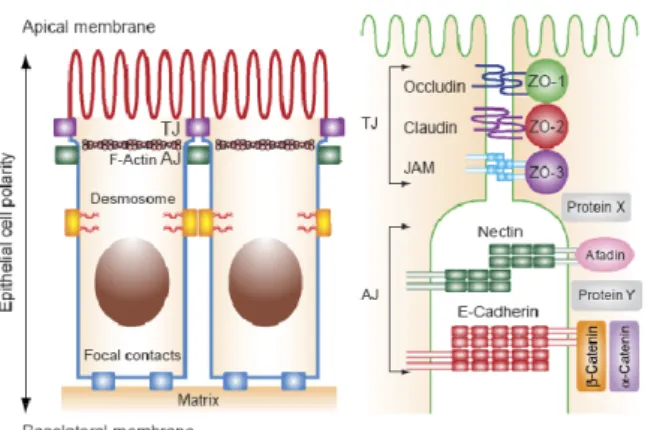
12 The components constituting the multimolecular TJ complex may be divided into three groups: 1) integral TJ proteins that bridge the apical intercellular space and form a regulated permeability barrier; 2) TJ plaque proteins, many of which express PDZ domains (Psd/SAP90, Disc Large, ZO-1) that serve as links between the integral TJ proteins and the actin cytoskeleton and as adapters for the recruitment of cytosolic molecules implicated in cell signaling; 3) a miscellaneous group of cytosolic and nuclear proteins, tumor suppressor, transcriptional and post-transcriptional factors that interact directly or indirectly with TJ plaque proteins to coordinate such diverse functions as the regulation of paracellular solute permeability, cell proliferation, and cell polarity.
Belong to the first group: occludin, the family of claudins and the junctional adhesion molecules (JAM) that are a member of the immunoglobulin superfamily.
Fig 6 Schematic representation of the molecular structure of trans-membrane domains
of the tight junction proteinsOccludin, Claudin-1 and JAM-1
The second group consists of a large family of proteins that share in their molecular structure a PDZ domain. Belong to this set of proteins: ZO 1 - 3 (zonula occludens 1 - 3), mDlg (mammalian disc large), MAGI 1 – 3 (membrane associated guanyl kinase inverted protein), MUPP1 (multi-PDZ domain protein 1), PAR (partitioning-defective protein), PALS (protein associated with Lin-7) and Scribb (Scribble).
13
Fig 7 Organization of junctional proteins in epithelial cells
The Caco‐2 intestinal cell line
Caco-2 cell line derives from a human colon adenocarcinoma and in standard condition of culture expresses spontaneously several morphological and functional characteristics of the enterocytes of the small intestine (Artursson, 1991).
During the growing phase Caco-2 cells remain undifferentiated and immediately after they reach the status of confluence, cells start the differentiation program that will be finished 18-21 days later.
According to the morphological and functional grade of differentiation that Caco-2 cell have during the 21 days from seeding we can divide the cell population into three subgroups: 1) cells homogeneously undifferentiated (sub confluent population); 2) cells heterogeneously polarized and differentiated (intermediate phase); 3) cells homogeneously polarized and differentiated (>15 days after seeding) (Delie and Rubas, 1997).
To better reproduce the steric conditions existing in the intestine in vivo, Caco-2 cells are generally cultured on permeable filter supports that allow free access of ions and nutrients to the two sides of the cell monolayer.
14
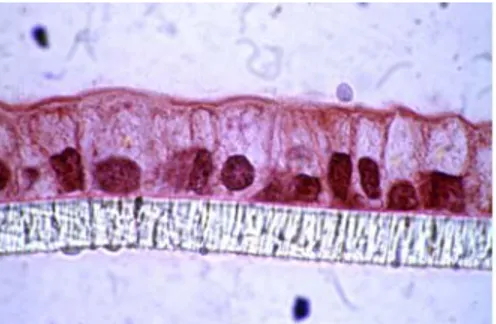
Fig 8 Cross section of Caco-2 cells seeded and differentiated on PET filter supports
Since these conditions led to improved morphological and functional differentiation, they have been proposed, and since then extensively utilized, as a more physiological model for intestinal transports and toxicity studies (Artursson, 1991; Hidalgo et al., 1989; Hilgers et al., 1990; Wilson, 1990).
Fig 9 electron microscopy image of Caco-2 brush border
If we look at the morphology of Caco-2 cells, we can see that these cells organize as a polarized monolayer with tight junctions and microvilli, mimicking the in vivo enterocyte (Pinto et al., 1983). The functional polarity of the differentiated Caco-2 cells is further indicated, when cells are grown on plastic dishes, by the formation of domes in the monolayer due to the detachment from the plastic surface caused by the unidirectional fluxes of ions and water from the apical to the basolateral compartment..
On the microvilli forming the brush border are located a number of enzymes typical of the mature enterocyte such as: sucrase-isomaltase, lactase, aminopeptidase N, dipeptilpeptidane IV and alkaline phosphatase. The level of expression of these enzymes
15 are comparable to the in vivo level and also the activity of these enzymes increases with the different stages of differentiation as in the human small intestine (Delie and Rubas, 1997).
Finally, other functions of the enterocyte that are expressed in Caco-2 cells are the polarized membrane receptors for growth factors and a number of transport activities located either on apical or basolateral membrane.
The cell line variability
The Caco-2 population in culture, even in the stationary differentiated phase, is characterized by the presence of subpopulations with different morphologies. The mosaic expression of brush border enzymes in confluent Caco-2 cells has been previously described and cells with different level of sucrase-isomaltase activity has been sub-cloned (Beaulieu and Quaroni, 1991). Transient mosaic patterns of specific functional intestinal markers and lack of coordination between proliferation and differentiation related genes was also reported (Vachon and Beaulieu, 1992; Vachon et al., 1996), suggesting that the morphological and functional differentiation were not coupled in parental Caco-2 cells.
To improve the homogeneity and the stability of the Caco-2 cell population, clonal cell lines has been isolated and characterized by several groups. The existence of Caco-2 cell lines maintained in different laboratories and/or of different clonal origin, in addition to the effects of different culture protocols, often has made the comparison of results particularly difficult.
Since its original isolation (Fogh et al., 1977), the Caco-2 cell line has been propagated in several laboratories around the world, giving origin to cell populations of different “age” or passage number in culture.
The expression of typical differentiation markers of intestinal enterocytes, such as sucrase-isomaltase and the glucose transporter GLUT-5, has been shown to increase from early to late passages (Chantret et al., 1994; Mahraoui et al., 1992). Passage number can also influence metabolic activities: variability of CYP3A4 mRNA expression level has been reported, and it has been explained as an effect of passage number and/or culture conditions (Nakamura et al., 2002). The variations with increasing passage numbers in the expression level of the differentiation markers have been ascribed to the intrinsic heterogeneity of the parental Caco-2 cell population, leading to the selection during repeated culture passages of faster growing cell populations, expressing different
sub-16 sets of characteristics (Briske-Anderson et al., 1997; Walter and Kissel, 1994; Walter et al., 1995; Yu et al., 1997).
Another parameter that can be responsible of variations in the expression level of transporters is the cell seeding density before starting cell differentiation. In literature a wide range of seeding densities on permeable filters is reported, but several studies demonstrated that this parameter could influence the structure of monolayer producing cell multilayers and inhibiting carrier mediated transport (Behrens and Kissel, 2003). In particular, the expression of the active peptide transporter HPT1 and of the efflux pump ABCB1 (P-gp) were down-regulated when Caco-2 cells were seeded with a cell density higher than 6 ×10⁵ cells/cm2.
17
Materials and Methods
Caco‐2 cell line maintanence and differentiation
The human intestinal Caco-2 cell line was originally obtained from Prof. Alan Zweibaum (INSERM, Villejuif, France). To carry out the LD and HD protocols cells were split at 50% and 90% of confluence respectively at least for 10 passages; subsequently a large batch of cells was produced to perform all the experiments and a range of 4 passages after the cells thawing was used to limit passage number inter-variability.
Both LD and HD cells were maintained at 37°C in a 90% air /10% CO2 atmosphere
in DMEM containing 25 mM glucose, 3.7 g/L NaHCO3 and supplemented with 4 mM
L-glutamine, 1% non essential amino acids, 100 U/L penicillin, 100µg/L streptomycin, and 10% heat-inactivated foetal calf serum (Hyclone) (complete medium).
For the differentiation experiments, cells were seeded on polyethylene-terephtalate (PET) filter inserts (0.4 µm pore diameter, 4.71 cm2; Falcon Becton-Dickinson) at a density of 3×10⁵ cell/cm2 and maintained for 21 days in complete medium; the medium was changed three times a week.
Plating efficiency assay
One thousand LD or HD Caco-2 cells were seeded on a 35 mm dish in complete medium. After 1 week from seeding cells were washed twice with PBS buffer supplemented with 1 mM CaCl2 and MgCl2 respectively (PBS++) and fixed for 30 min with
a solution of absolute methanol and 0.001% crystal violet. Dishes were then accurately washed with double distilled H2O and colonies were counted. The number of colonies
formed was expressed as percent of colonies with respect of cells seeded. A total of three independent experiments were performed.
Copper toxicity assay
To investigate the effects of copper ions, 21-days differentiated Caco-2 cells were treated for 1 or 2 h at 37°C with increasing concentrations of CuCl2 in Hanks' balanced salt
solution (HBSS, 137 mM NaCl, 5.36 mM KCl, 0.44 mM KH2PO4, 0.34 mM Na2PO4, 1
mM CaCl2, 1 mM MgCl2, and 5.6 mM glucose) with 20 mM MES, pH 6.0 in the apical
(AP) compartment. The basolateral (BL) compartment contained HBSS containing 20 mM HEPES at pH 7.4.
18
Cell cycle
Cell cycle analysis was performed by pulse-chase bromodeoxyuridine (BrdU, Sigma) incorporation and propidium iodide DNA staining, as previously described (Bucci et al., 2005)
For the BrdU incorporation, 30 min before starting the experiment a pulse of 20 μM BrdU was given to the cell culture. Afterwards, BrdU-free medium was added to the cell culture and samples were taken every 2 h for further 24 h. Mouse anti-BrdU (Becton-Dickinson) and FITC-conjugated F(Ab’) rabbit anti-mouse IgG (DAKO) antibodies were used to detect the BrdU incorporation. Twenty thousand events per sample were acquired by using a FACScan cytofluorimeter. The top region of the cytograms represents BrdUrd-positive cells. The percentages of the cell cycle distribution were estimated on linear PI histograms by using the MODFIT software.
Western Blot analysis
LD and HD Caco-2 cells were seeded on PET filters at the density of 3 · 105 cells/cm2 and harvested at different days of differentiation (cycling cells C, 1, 3, 6, 9, 12, 15, 21 days after seeding). Cells were then incubated in urea buffer (8 M urea, 100 mM NaH2PO4, 10 mM Tris pH 8), for 30 min on ice and then briefly sonicated. Proteins were
subjected to SDS–polyacrylamide gels electrophoresis. The resolved proteins were blotted overnight to nitrocellulose membranes, which then were blocked in PBS 1X containing 5% non-fat milk for at least 1 h. Blots were incubated with the following primary anti-human antibodies: anti-cyclin A polyclonal antibody (C-19), anti-p27Kip1 polyclonal antibody (C-19), anti-SI polyclonal antibody (T-17), all from Santa Cruz Biotechnology; anti-pRB monoclonal antibody (clone G3-245; BD-Pharmigen) and anti-ezrin monoclonal antibody (clone 3C12; Zymed). The membranes were then incubated 45 min with the relevant secondary antibody (anti mouse, anti-rabbit or anti-goat IgG (H+L)) conjugated with Alexa fluor 680 (Invitrogen) or IRDye 800 (LI-COR Biosciences) and analyzed with the Licor Odyssey Infrared Image System in the 700 or 800 nm channel.
Total RNA preparation
Total cellular RNA was isolated using standard Trizol (Invitrogen) protocol and subsequently purified and DNAse treated on RNAeasy Qiagen columns. Alternatively, total cellular RNA was isolated using NucleoSpin RNA II silica columns
(Macherey-19 Nagel). RNA quantity was determined by absorbance at 260 nm using a NanoDrop UV-VIS spectrophotometer. Each sample was then quality checked using the RNA 6000 Nano kit with a BioAnalyzer 2100 (Agilent): samples with a RIN index lower than 8.0 were discarded (Schroeder et al., 2006)
Real‐time RT‐PCR analysis
500 ng RNA was retro-transcribed using standard conditions and the cDNA was then subjected to real time PCR analysis with an Applied Biosystems 7900HT thermal cycler, using the SensiMix SYBR Kit (Bioline) and the following specific primers: PPARG (sense
[s]: GACCTGAAACTTCAAGAGTACCAAA, antisense [as]:
TGAGGCTTATTGTAGAGCTGAGTC), CDX2 (s: GAGCTGGAGAAGGAGTTTCACTA, as: GCGGTTCTGAAACCAGATTTT), CLDN4
(s: TCCGCCAAGTATTCTGCTG, as: CGTGGCACCTTACACGTAGTT), MYO1A (s: TGGCAGATTTCATCTACAAGAGC, as: GTTTGTGGATGGCAAATTGTT), ANPEP (s: CATCCATCAGAGATGGCAGAC, as: TGCTGAAGAGATCGTTCTGG), SLC11A2 (s: CACCGTCAGTATCCCAAGGT, as: CCGATGATAGCCAACTCCAC), SI (s: AATCCTTTTGGCATCCAGATT, as: GCAGCCAAGAATCCCAAAT), ALPI (s: CATACCTGGCTCTGTCCAAGA, as: GTCTGGAAGTTGGCCTTGAC), CYP3A4 (s: GATGGCTCTCATCCCAGACTT, as: AGTCCATGTGAATGGGTTCC), MT2A (s: CTCTAGCCGCCTCTTCAGC, as: ACTCTTTGCATTTGCAGGAAC), HSPA1A (s: AAGGACCGAGCTCTTCTCG, as: GCTCGGCTCTGAGATTGG), PPIA (s: ATGCTGGACCCAACACAAAT, as: TCTTTCACTTTGCCAAACACC) and TBP (s: GAACATCATGGATCAGAACAACA, as: ATAGGGATTCCGGGAGTCAT). Experiments were done in technical quadruplicates. Expression data were normalized using the Ct values of the internal controls PPIA and TBP.
Whole genome expression profiling
The gene expression profiling was performed using the Agilent two-color microarray system
(http://www.chem.agilent.com/enUS/Products/Instruments/dnamicroarrays/Pages/default.a spx). Two different experiments have been performed, with a total of 10 samples: the first one (called “Diff/Cycl”) to compare 2 LD cells in the proliferating phase with Caco-2 LD cells at the end of Caco-21-days differentiation period; the second one (called “LD/HD”) to compare Caco-2 LD with Caco-2 HD differentiated cells. In the “Diff/Cycl” experiment
20 two different pairs of biological replicates (isolated from two different LD cell passages) were analyzed, while in the “LD/HD” experiment only one pair of samples was used. In both experiments, for each pair of sample a technical dye-swap replicate was included (see Supplementary Figure 1 for a scheme of the experiments).
500 ng of total RNA were retrotranscribed using oligo-dT primers linked to the T7-promoter and the resulting cDNA was used as a template for cyanine 3-CTP or cyanine 5-CTP labelled cRNA preparation, using the Agilent Low Input Linear Amplification Kit. The labeled cRNA were purified with Qiagen’s RNeasy mini spin columns. To monitor both the labelling reactions and the microarray performance, Agilent Spike-In Mix was added to the mRNA samples prior to labelling reactions according the RNA Spike-In protocol.
Two-color mixes of labelled cRNA pairs were hybridized either to 44K (“Diff/Cycl” experiment) or 4x44K (“LD/HD” experiment) whole human genome oligonucleotide microarray (Agilent G4112A and G4112F respectively, 41000 unique probes) at 65°C for 17 hours using Agilent’s Gene Expression Hybridization Kit. The hybridized microarrays were disassembled at room temperature in Agilent Gene Expression Wash Buffer 1. After the disassembly, the microarrays were washed in Gene Expression Buffer 1 for one minute at room temperature, followed by washing with Gene Expression Wash Buffer 2 for one minute at 37°C. The microarrays were then treated with acetonitrile for one minute at room temperature.
Post-hybridization image acquisition was accomplished using the Agilent Scanner G2564B, equipped with two lasers (532 nm and 635 nm) and a 48 slide auto-sampler carousel. The “extended range” scanning protocol was used for the 4x44K chip, where the output of two following scannings at 10% and 100% of laser power are numerically combined. Data extraction from the images was accomplished by Agilent Feature Extraction 9.1 software using the standard Agilent two-color gene expression extraction protocol (GE2-v4_91).
Raw data filtering was performed in Microsoft Excel using any of the following criteria to discard spots: spots with more than 5% of saturated pixel in any of the two channels, spots flagged as “not found” by the Feature Extraction software in any of the two channels, spots with a Signal/Noise ratio smaller than 3 in any of the two channels, where Signal = (median of the spot - median spot background level) and Noise is the IQR
21 (interQuantileRange) of the median spot background. Basic data analysis was perfomed on filtered data using Agilent GeneSpring GX 7.3 and Microsoft Excel. In every array the normalized channel ratio Nr was normalized by the Lowess algorithm within GeneSpring, using 20% of data as smoothing window. In the cluster of Figure 3, the separated Lowess normalized Red (R_norm) and Green (G_norm) channels are obtained by the formulas Log2(R_norm) = (Log2(Nr)+Log2(R*G))/2 and Log2(G_norm) = (-Log2(Nr)+Log2(R*G))/2, where R and G are the non-normalized channel values. For the “Diff/Cycl” experiment two separate normalization procedures were used, the Lowess and the dye-swap method, that combines and averages two dye-swapped replicates. Differentially expressed genes were identified as those showing an average fold change larger than 1.5 and lower than 1.5 in the “LD/HD” experiment, in the linear scale. In the “Diff/Cycl” experiment differential genes were identified with a more stringent criteria, as those showing an average fold change larger than 2.0 or lower than 1/2.0 in the linear scale but in both sets of normalized data, Lowess and dye-swap, except for Figure 5 where the threshold was 1.5. The analysis of over- and under- represented functional annotations was performed, pooling up- and down- regulated genes, using the DAVID web tool (http://david.abcc.ncifcrf.gov/) (Huang et al., 2009), selecting the following categories both for functional clustering (high stringency) and charts: goterm_bp_4, goterm_bp_5, goterm_cc_4, goterm_cc_5, goterm_mf_4, goterm_mf_5, panther_bp_all, panther_mf_all, interpro, pir_superfamily, smart, panther_family, panther_subfamily, kegg_pathway, panther_pathway, chromosome, cytoband, cog_ontology, sp_pir_keywords, up_seq_feature. Gene clustering analysis was done using MeV 4.4 (MultiExperiment Viewer, TM4 suite , http://www.tm4.org/mev/)(Saeed et al., 2006).
Fluorescence and immunofluorescence microscopy
Caco-2 cells were seeded on PET inserts in complete medium and cultured for the time indicated in the legend of the figures. For-F-actin localization cells were fixed in 2% paraformaldehyde in PBS++ containing 2% sucrose for 30 min, washed with PBS++ , blocked with 5% non-fat dry milk in PBS++ and incubated for 30 min with 0.33 mg/ml TRITC-phalloidin (0.25 mm) in PBS++ containing 0.2% BSA; double-labeling of the nuclei was performed with 1µg/ml DAPI for 30 sec in PBS. Finally, cells were washed in PBS, briefly rinsed in ddH2O and glasses were mounted with ProLong Gold anti-Fade Reagent (Molecular Probes).
22 To study the localization of ZO-1 protein and the colocalization of ZO-1 with Claudin 4 or Villin 1, we used a confocal laser scanning microscope (Leica Confocal Microsystem TCS SP5). ZO-1 was detected using the polyclonal anti-ZO-1 antibody purchased by Zymed while for Claudin4 and Villin 1 the antibodies were from Santa Cruz.
The secondary antibodies were: Alexa Fluor 594 Goat anti-mouse IgG, Alexa Fluor 555 Donkey anti-rabbit IgG and Alexa Fluor 488 Goat antirabbit F(ab')2 fragment
antibodies. In order to avoid any possible cross-talk between secondary antibodies we chose antibodies generated in Donkey, a species known to show negligible cross-reactivity, or F(ab')2 fragments. Each image represented the maximal projection of 100-frames
z-stack; images were processed using Leica Application Suite 6000. Brightness and contrast were adjusted.
23
Results
The “Low Density” (LD) cell‐line maintaining protocol
Caco-2 cells in the growing phase tend to generate islets, showing a core constituted by prismatic epithelial-like more differentiated cells surrounded by large flattened growing cells at the border. When cells approach confluence, the proportion of the prismatic epithelial-like cells increases, up to a point in which these cells represent the large majority of the population. Obviously, each time cells are trypsinized and passed to another plate, the number of growing cells increases, but actually not all the replated cells enter the cell cycle.
We tested a novel cell-line-maintaining protocol, (Low Density protocol or LD protocol) where cells are split when they reach just 50% of confluence with an approximately density of 5 x 10⁴ cells/cm2. Using this protocol we avoid heterogeneous cell-growth conditions in which a subpopulation of cells start to differentiate during the line maintenance procedure. In this paper, we used this protocol in comparison with the standard Caco-2 maintenance protocol in which cells are subcultured at 80-90 % of confluence (High Density protocol or HD protocol).
To form the differentiated monolayer, LD and HD cells were both seeded at the same density of 3 x 10⁵ cells/cm2 on PET inserts (Falcon) and let to differentiate spontaneously into mature enterocytes over 21 days.
LD cells have a higher cell proliferation rate
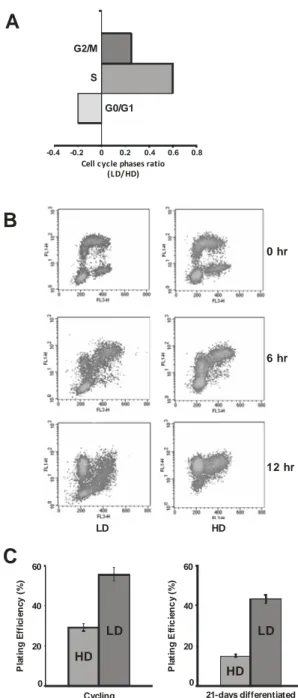
To explore differences in proliferation of Caco-2 cells maintained either with LD or HD protocol, we first investigated the cell cycle phase’s distribution after propidium iodide staining. In Figure 1A is shown the ratio of cell cycle phases percentages evaluated in growing LD and HD cells. A significant increase in the proliferative compartment was observed in LD vs HD cells (S phase = 60 % and G2/M = 30% increase), indicating that in LD cells a higher number of cells was in the proliferative phases.
To investigate whether the increase in LD cell proliferation was due to a faster cell cycle transition we have performed a pulse-chase BrdU incorporation experiment by flow cytometry. Cells were exposed to BrdU for a pulse of 30 min. In order to calculate the cell-cycle phase length, BrdU incorporation was monitored immediately at the end of the BrdU
24 pulse and every 2 h during the subsequent 24 h. In Figure 1B are shown the BrdU cytograms in LD and HD cells at 0, 6 and 12 h after the pulse. The calculation of the cell-cycle phase length indicated that both S and G1 phases in LD cells were shorter than in HD cells (S-phase length = 12 vs 17 h; G1 phase length = 4 vs 6.5 h), thus resulting in a reduced total cell cycle duration (LD cells = 19 h vs HD cells = 25 h). It was therefore evident that LD cells entered and completed the cell cycle faster than HD cells. The colony formation assay (Figure 1C, right and left panel) also demonstrated that the LD cells have a higher proliferative potential than the HD ones: cycling LD cells show 60% of colonies formed compared to the 29% of the HD ones (Figure 1C, left panel) and this difference is still maintained after 21-days of differentiation, when LD cells show 45% of colony formed compared to the 15 % of HD cells (Figure 1C, right panel).
25
A
C
LD HD 0 hr 6 hr 12 hr -0.4 -0.2 0 0.2 0.4 0.6 0.8 G2/M S G0/G1 Cell cycle phases ratio (LD/HD)B
20 40 60 0 HD LD P lat in g E ff ici en cy ( % ) Cycling 20 40 60 0 HD LD Pl a ti n g Ef fi c ie n c y ( % ) 21-days differentiatedFigure 1. Effects of cell-growth density on cell-cycle length and plating efficiency.
(A) Cell cycle phase ratios of growing LD versus HD cells. (B) Representative cytograms of BrdU pulse-chase experiments. Each cytogram shows the different distribution of LD and HD cells 0, 6 and 12 hours after the BrdU pulse. (C) Plating efficiency of growing (left panel) and differentiated (right panel) LD and HD cells referred as percent of colony formed after plating.
26
LD cells show a slower exit from cell cycle but express the same level
of differentiation markers as compared to the HD cells
To determine if cells with different proliferative potential were equally able to exit from the cell cycle and differentiate spontaneously in mature enterocytes, we followed the expression levels of some cell-cycle regulating proteins and intestine differentiation markers during 21 days of differentiation. Both LD and HD cells were seeded at the density of 3 x 10⁵ cells/cm2 on PET inserts and harvested at the indicated days of cell differentiation. As visible in Figure 2A, consistent with a faster exit from the cell cycle, the HD Caco-2 cells showed, earlier than the LD cells, modifications in some cell cycle-related molecules such as dephosphorylation of the retinoblastoma gene product (pRB; day 3 vs day 9 in LD cells), down-regulation of cyclin A (day 6 vs day 9 in LD cells) and accumulation of p27 (day 1 vs day 3 in LD cells). Correspondingly, a significant increase of the differentiation protein marker sucrate-isomaltase was already evident in HD cells at day 9, while LD cells showed an equivalent amount of SI only at day 15. Such differences between LD and HD cells can be explained by hypothesizing that the Caco-2 cells maintained at high density of culture have already entered the differentiation program beforehand cell seeding on the PET inserts.
Differences between the LD and the HD cell were also evident examining the trend of expression during the differentiation process of genes involved in the intestinal development. As shown in Figure 2B, we analyzed during the 21 days of differentiation by qRT-PCR the expression of genes encoding for intestinal enzymes, such as CYP3A4 (cytochrome P450), ALPI (phosphatase alkaline), ANPEP (aminopeptidase N) and SI (sucrase-isomaltase); for brush border transporters, such as SLC11A2 (or DMT1, divalent metal transporter 1); for structural proteins, such as CLDN4 (Claudin 4), MYO1A (Villin1); for transcriptional factor essential in the cripta-villus transition, such as PPARG (peroxisome proliferative activated receptor gamma) and CDX2 (caudal-type homeobox transcription factor 2). The general trend of induction of CDX2 and PPARG genes was almost the same in LD and HD cells whereas the value of fold increase is clearly higher in LD cells. The pattern of expression did not significantly vary also for the structural genes CLDN4 and MYO1A and the transporter SLC11A2. On the contrary the genes coding for brush- border enzymes ANPEP, SI and ALPI showed the largest differences both in trend of expression and fold increase. A significant difference between LD and HD cells was also suggested by the substantial induction of CYP3A4 gene in LD cells.
27 pRB SI Differentiation days cyclin A ezrin p27 1 3 6 9 12 15 21 HD C 1 3 6 9 12 15 21 LD C F o ld i n cr ea se F o ld i n cr ea se F o ld i n cr ea se 0 4 8 12 16 1 3 6 9 12 15 21 PPARG 0 2 4 6 8 10 1 3 6 9 12 15 21 CDX2 0 2 4 6 8 1 3 6 9 12 15 21 SLC11A2 0 100 200 300 400 500 1 3 6 9 12 15 21 ANPEP 0 10 20 30 1 3 6 9 12 15 21 CLDN4 0 10 20 30 40 50 1 3 6 9 12 15 21 MYO1A 0 2 4 6 8 1 3 6 9 12 15 21 ALPI 0 1 3 6 9 12 15 21 SI 1·103 3·103 4·103 2·103 0 1 3 6 9 12 15 21 CYP3A4 2·104 4·104 6·104 8·104 1·105
Differentiation day Differentiation day Differentiation day
A
B
Figure 2. Effects of cell-growth density on the time-courses of the expression of cell cycle regulatory proteins and intestine differentiation key genes during 21 days of LD and HD cell differentiation.
(A) Western blot time course analysis on total cell lysates of some cell-cycle regulatory proteins and differentiation markers of the intestinal maturation of Caco-2 cells. Each lane was loaded with 80 µg of proteins from cell lysate. Ezrin was used as a loading control. The experiment was repeated three times showing similar results. A representative blot is presented. C: cycling cells (B) Quantitative RT-PCR time-course of genes involved in the enterocyte development. The values are expressed as fold induction respect to cycling LD cells.
28
The differentiated LD Caco‐2 cells possess a well‐defined enterocyte‐
like gene expression profile
To investigate the effects of the alternative line-maintenance protocol on the terminal differentiation of the Caco-2 cells, we used the Agilent microarray technology to compare the whole gene expression profiles of (i) 21-days differentiated LD cells versus LD cycling cells; and (ii) 21-days differentiated LD cells versus 21-days differentiated HD cells. The first experiment, called “Diff/Cycl”, was designed in the two-color dye-swap configuration with biological duplicates of the samples (as schematized in supplementary Figure S1), the data were normalized using the Lowess and the dye-swap methods and differential genes were selected by filtering a combination of both normalized datasets as shown in supplementary Figure S2.
Figure 3 shows the hierarchical cluster of the filtered normalized expression data obtained from the two-color microarray “Diff/Cycl” experiment. The 8 columns correspond to the red and the green separated Lowess-normalized channels (see methods) for each of the four arrays. In this cluster it is possible to discriminate sets of genes that are up or down regulated in terms of absolute values; on the top of the cluster the biological replicates and technical replicates cluster together as expected indicating a good reproducibility between duplicate samples.
Supplementary Figure 3 shows another hierarchical cluster diagram obtained using the same filtered normalized expression data from the “Diff/Cycl” experiment. In red are grouped the genes at least 2 fold up-regulated while in green are grouped the genes at least 2 fold down-regulated in differentiated cells. The four columns correspond to the log2 ratio
differentiated/cycling cells for the 4 arrays (two biological replicates and the corresponding 2 dye-swapped technical replicates). The sample tree on the top of the diagram shows that the technical replicates cluster together as expected.
On the right of the figure there is a list of the statistically significant functional categories (10-2<p<10-15) obtained submitting the 2-fold filtered genes to the DAVID Bioinformatics Database (http://david.abcc.ncifcrf.gov/) (Sherman et al., 2007). The black marks below each category indicate the position in the hierarchical cluster on the left of the genes belonging to that category. The median position of genes along the Y-axis of the cluster has been computed for each category and the list of categories has been sorted according to this value, for a better discrimination of categories containing more down-regulated genes from those containing a majority of up-down-regulated genes.
29 C1 R e d C 1 G reen C2 R e d C 2 G reen D1 R e d D 1 G reen D2 R e d D2 G re e n 7.0 14.0 A b so lu te ex p re s s io n v a lu e ( L o g )2
Figure 3. Hierarchical clustering, with Euclidean distance, of filtered normalized expression data obtained from the two-color microarray experiment “Diff/Cycl” where the Caco-2 LD differentiated cells are screened versus the Caco-2 LD cycling cells.
Log2 of absolute expression values are shown. The set used for clustering is composed by
the 1183 genes that show an average ratio Differentiated/Cycling greater than 2.0 or smaller than 1/2.0 (in the linear scale) in normalized data, where the normalization procedure included both the Lowess and dye-swap methods (see Materials and Methods). The 8 columns correspond to the Red and Green separate Lowess normalized channels for each of the 4 arrays; 2+2 biological replicates and the corresponding technical 2+2 dye-swapped replicates (one per sample) are shown. The column headers have the following meaning: C, cycling cells; D, differentiated cells, 1 and 2 refers to the biological replicate samples; Red and Green, refers to the cyanine label (either Red, cyanine 5 or Green, cyanine 3). It is clear from the sample tree on the top of the diagram that the chosen gene set is very effective in discriminating cycling and differentiated cells, since the biological replicates cluster together, cycling samples on the left and differentiated ones on the right, moreover within each of these two groups the technical replicates also cluster together.
30 G 0 :0 00 02 7 9 M p h a s e h _ce ll c ycl e P a th w a y: C y c li n s a n d C e ll C y c le R e g u la tio n G 0 :0 0 1 6 323 B a s o la te ra l p las m a m e m b ra n e P T H R 1 1 783 :S F 1 3 S u lf o tr a n s fe ra s e S U L T 1 A G 0 :0 0 0 4 177 A m in o p e p ti d a se ac ti v it y G O :00 420 60 W o u n d h e al in g IP R 0 0 1 3 14: P e p ti d a s e S 1 A , ch ym o tr y p s in h sa0 09 80: M e ta b o li s m o f x e n o b io ti cs b y cy to ch ro m e P 4 5 0 In te s ti n e IP R 0 0 2 21 3 :U D P -g lu cu ro n o sy l/ U D P -g lu c o s yl tr an s fe rase Up -r e g u la te d D o w n -r eg u lat e d Log (D 1 gr ee n/ C 1 r e d) 2 Log (D 2 gr ee n/ C 2 r e d) 2 Log (D 1 r ed/ C 1 g re e n) 2 Log (D 2 r ed/ C 2 g re e n) 2
Log2 ratio Diff/Cycl
-4.0 0 +4.0 9 1 4 9 1 10 60 7 8 1 5 68 12 8 7 7 1 18 69 h s a03 32 0: P P A R si g n a li n g p a th w a y Li p id M e ta bo li s m
Figure 4. Hierarchical clustering, with Euclidean distance, of filtered nornalized expression data obtained from the two-color microarray experiment “Diff/Cycl” where the Caco-2 LD proliferating cells are screened versus the Caco-2 LD cycling cells.
Log2 of relative expression values are shown. The set used for clustering is composed by
the 1183 genes that show an average ratio Differentiated/Cycling greater than 2.0 or smaller than 1/2.0 (in the linear scale) in normalized data, where the normalization procedure included both the Lowess and dye-swap methods (see Materials and Methods). The 4 columns correspond to the Log2 ratio Differentiated/Cycling for the 4 arrays: 2
couples of biological replicates and the corresponding 2 dye-swapped technical replicates. The column headers have the following meaning: C, cycling cells; D, differentiated cells, 1 and 2 refers to the biological replicate samples; Red and Green, refers to the cyanine label (either Red, cyanine 5 or Green, cyanine 3). The sample tree on the top of the diagram
31 shows that the technical replicates cluster together as expected. The gene annotation using the DAVID system is shown to the right: on the top are listed the main statistically significant functional categories (under- or over-represented in the gene set), below every black mark indicates that the corresponding gene belongs to the category on the top. The categories definitions and the genes belonging to them are listed in Supplementary Table 1.
A short and sorted list of non biologically redundant categories is reported in Figure 4 together with the hierarchical cluster diagram. Analyzing the genes comprised in the more up-regulated categories, they were typical genes of the intestine differentiation, while the down-regulated categories include cell cycle progression and regulation genes. The up-regulated genes belong to the PPAR-signaling pathway, the intestine, the lipid metabolism, the xenobiotics metabolism by CYP450 and the UDP-glucoronosyl/UDP-glucosyl transferases. The down-regulated genes are represented mainly by those belonging to the pathways controlling cell cycle progression and regulation. In Supplementary Table 1 is reported a list of the categories and the corresponding p-values shown in Figure 4.
Then we compared the whole gene expression profile of 21-days differentiated LD cells versus 21-days differentiated HD cells, obtaining the list of the genes whose level of expression was different between LD and HD cells: we called this the “LD/HD” experiment. Supplementary Table 2 reports the 163 genes of LD cells showing at least 1.5-fold increase or decrease with respect to the HD cells. Among these listed genes, relevant ones are involved in the function of the absorbing enterocyte, such as those coding for transporters (SLCO4A1, SLC12A2, SLC2A14 etc.) and enzymes (GSTM3, GPX7, CP), and others implicated in the cell polarization processes (PBK, DLG7, LAMA1).
Figure 5A shows the intersection of two sets of differential expressed genes obtained from the above described microarray experiments: the set of genes increasing or decreasing at least 1.5 fold in the Diff/Cycl” experiment and the set of genes increasing or decreasing at least 1.5-fold in the “LD/HD” experiment. It is quite surprising that out of the 163 genes differentially espressed between LD and HD cells, 56 also belong to the set of 2888 genes differentially expressed between differentiated and cycling LD cells. We have thus analyzed the distribution of these genes as shown in Figure 5B plotting the Log2 ratios of
each gene. This scatter plot shows both the extent and direction of gene expression variations. About 50% of the genes in common between the two sets are located into the right quadrants (b and c), representing genes up-regulated at the end of differentiation and
32 more expressed in LD (b quadrant) or in HD differentiated cells (c quadrant). These genes are reported in Supplementary Table 3. The left quadrants (a and d) of the plot contain the genes that are down-regulated at the end of differentiation. Interestingly, the other 50% of the genes in common between the two sets form a cluster only in the (a) quadrant, and include those that are more expressed in LD cells and down-regulated during differentiation. Among these genes (also reported in Supplementary Table 3) most are related with apoptosis, cell cycle and DNA repair
Diff/Cycl
LD/HD
2832
56
107
Log (Diff/Cycl)2 L o g (LD /H D) 2 -3.0 -2.0 -1.0 0.0 1.0 2.0 3.0 -6.0 -4.0 -2.0 2.0 4.0 6.0 Cell cycle Apoptosis DNA repair a b c dFigure 5. Intersection of the sets of differentially expressed genes obtained from the Diff/Cycl” experiment and from the “LD/HD” experiment.
From Lowess normalized data a total of 2888 genes (“Diff/Cycl” experiment) and 163 genes (“LD/HD” experiment) were selected, showing an average relative ratio greater than 1.5 or smaller than 1/1.5 in the linear scale. The relative Log2 ratios of genes belonging to
both sets, {Diff/Cycl ∩ LD/HD} in blue in the Venn diagram, are shown in the scatter plot. The three gene sets located in the quadrants (a), (b) and (c) of the plot are listed in the Supplementary Table 3, functionally annotated using the DAVID system. The 163 genes belonging to the LD/HD set, {LD/HD}, were also functionally annotated using the DAVID system and are reported in Supplementary Table 2. The most significant DAVID keywords are shown for the subset in quadrant (a).
33 ZO-1 Villin HD HD LD LD F-actin
A
B
mergeFigure 6. Localization by confocal microscopy of Caco-2 brush border proteins.
(A) Phalloidin-TRITC staining of F-actin of 21-days differentiated LD and HD cells. Each image is the orthogonal maximum projection of a 100-frames z-stack. (B) ZO-1 and villin co-immunofluorescence staining of 21-days differentiated LD and HD cells. Upper panel: orthogonal maximum projection (100-frames z-stack) of ZO-1 protein; medium panel: orthogonal maximum projection (100-frames z-stack) of villin protein; lower panel: perpendicular projection (100-frames z-stack) of merged ZO-1 (green) and villin (red) proteins with nuclei (cyan). Scale bars: 25 micron.
34
Cell‐growth density deeply influence the architecture of polarized
monolayer
We then investigated the effects of the two alternative cell-line culture protocol on the characteristics of differentiated cell monolayer, and in particular on the organization of proteins participating to the tight junction complex (Paris et al., 2008) and the structure of the brush border (Khurana and George, 2008).
Figure 6A shows representative images obtained by confocal microscopy of 21-days differentiated LD and HD cells stained with phalloidin-TRITC. This staining is specific for the fraction of actin present in polymerized form (F-actin), which in the intestinal epithelium constitutes the cytoskeleton that runs all over the length of the microvilli, anchoring them to the terminal web located at the base (Friederich et al., 1990). The LD cells show a regular brush border, in which the microvilli are well distributed all over the monolayer surface and clearly defined by their content of F-actin, while the monolayer formed by HD cells was characterized by scarce amount of polymerized actin, showing large unstained regions.
Figure 6B shows the localization of the protein villin, one of the main structural component of the microvilli (Khurana and George, 2008). The co-staining with the tight-junction protein zonula occludens 1 (ZO-1) allowed identifying the apical domain of the cells (Fanning et al., 1998). In this case, the amount of villin was comparable between the two samples and its localization was correct in relation to the ZO-1 position. This result indicates that the morphological difference between the brush-border of the two cell types was mainly due to the different level of actin polymerization.
To further investigate the effects of the cell-line maintenance protocols on the structure and organization of the cell monolayer, we analyzed the localization of the tight junction proteins ZO-1 and claudin 4. These proteins are key components for the assembly and functionality of the tight junction barrier, and normally they possess a well defined localization along the perimeter of the cells. ZO-1 surrounds the upper side of the cell, defining the border of apical domain, while claudin 4 runs all over the lateral domain (Acharya et al., 2004).
35 Claudin 4 ZO-1 HD LD
B
merge LD HD 10 .0 m 4. 4 m ZO-1A
Figure 7. Localization by confocal microscopy of Caco-2 tight junction proteins.
(A) ZO-1 and claudin-4 co-immunofluorescence staining of 21-days differentiated LD and HD cells. Each image is the orthogonal maximum projection of a 100-frames z-stack. Upper panel: orthogonal maximum projection of ZO-1 protein; medium panel: orthogonal maximum projection of claudin-4 protein; lower panel: perpendicular projection of merged ZO-1 (green), claudin-4 (red) and nuclei (cyan). Scale bar is 25 micon(B) ZO-1 immunofluorescence staining of 21-days differentiated LD and HD cells. Each image is the orthogonal maximum projection of a 50-frames z-stack. Upper panel: orthogonal maximum projection of ZO-1 protein; medium panel: perpendicular projection of merged ZO-1 protein (green) and nuclei (cyan); lower panel: detail of the distribution of ZO-1 protein along the z-axis. Scale bar: 50 micron.
36 Figure 7A shows the immunostaining of ZO-1 in differentiated LD and HD cells. The ZO-1 localization in the orthogonal projection of the LD monolayer appears very regular, defining an homogeneous pattern of cell boundaries, further confirmed by the perpendicular projection, in which ZO-1 fluorescence is aligned in a narrow (about 4 µm) and well defined region. On the contrary, HD cells form a much more irregular monolayer, both in orthogonal and perpendicular view. The region containing the ZO-1 signals is wider (about 10 µm) and the signals are scattered and not aligned.
Figure 7B shows the consequences of the perturbed ZO-1 distribution on the localization of claudin-4. While in the LD monolayer both proteins are regularly aligned around the boundaries of the cells, in the HD one the correct localization of claudin 4 is completely lost, both in the orthogonal and the perpendicular projection.
Cell‐growth density affects the Caco‐2 response to toxic injury
On the basis of the above described differences in the structure of the junctional complex and in the aspect of the brush border, we asked whether the changes observed between LD and HD cells could also result in a different cellular response to toxic injury
To address this question, we carried out an acute treatment with increasing concentrations of copper chloride, a compound that enters into the Caco-2 cells mainly by its apical transporter DMT1 (SLC11A2) (Arredondo et al., 2003) and whose effects on the cells structure in terms of polymerization of the actin are well documented in literature (Ferruzza et al., 2002; Ferruzza et al., 1999b; Ferruzza et al., 1999a). In Figure 8A, the effect of 2 hours treatment with 100 and 300 µM CuCl2 on the actin grade of
polymerization is shown. We observed an increasing depolymerization of F-actin both in LD and HD cells, but the dose-effect ratio was not comparable between cell types. In HD cells the treatment with 100 µM CuCl2 had substantially no effect on the polymerizated
fraction of actin, while the effect of the same concentration on LD cells were extremely evident, resulting in the actin almost complete depolymerization. Only at 300 µM CuCl2
actin was completely depolymerizated in both cell types and no difference was evident between them.
37
A
B
HSPA1A 0 1 2 3 4 1 h 2 h F o ld in cr eas e LD HD MT2A 1 h 2 h 0 5 10 15 20 F o ld i n cr eas e LD HD LD HD 300 M CuCl2 100 M CuCl2 ControlFigure 8. Response of LD and HD Caco-2 cells to copper chloride treatment.
(A) Phalloidin-TRITC staining of F-actin of 21-days differentiated LD and HD cells treated for 2 hours with increasing concentrations of copper chloride. Each image is the orthogonal maximum projection of a 100-frames z-stack. Scale bar: 25 micron. (B) Relative expression by quantitative RT-PCR of two genes involved in the response to copper toxicity, MT2A and HSPA1A, in 21-days differentiated LD and HD cells treated with 100 µM CuCl2 for 1 or 2 hours. The values are expressed as fold induction respect to
38 To see if the different response of the two cell types was also reflected at the gene expression level, we measured by real-time RT-PCR the expression level of two genes involved in copper metabolism and toxicity response: the heath shock protein 70 (HSPA1A) and the metallothionein 2A (MT2A) (Song and Freedman, 2005). Figure 8B shows that after 1 and 2 hours of 100 µM CuCl2 treatment, the expression of MT2A was
significantly higher in LD compared with HD cells. In the same experimental conditions, the increase of HSPA1A was time-dependent and more pronounced in LD cells, with a strong increase after 2 hours of treatment. Moreover, it is worthwhile to note, that in all these experiments, which have been repeated many times, the response of LD cells were always more reproducible and constant compared to the HD ones.
39
Discussion
We studied the effects elicited by Caco-2 cell line growth-density on the formation of the differentiated monolayer. To minimize the effects of any other difference, the experiments have been carried out using cells derived from the same source and applying rigorously standardized times of culture and differentiation, type of plastics, quality of animal serum and cell handling. Our results demonstrated how a simple modification of the routine manipulation of this cell line is sufficient to deeply influence the characteristics of the differentiated cells.
The general idea behind the new LD growth-differentiation protocol was to apply the differentiation-inducing conditions to totally undifferentiated actively-growing cells, avoiding as much as possible the intermediate stage of a partially differentiated inhomogeneous cell population. The cell cycle time of LD cells was shorter, suggesting that LD growing cell were more active and in healthier conditions. Moreover, comparing the cell cycle profiles of growing LD and HD cells, we found a higher number of LD cells in the proliferative compartment of the cell cycle, suggesting a more synchronous state of the cell population. The colony formation assay demonstrated how the HD cells have a reduced ability to attach to the plate (almost 50% less than LD ones), probably due to a selective pressure that acts against cells that have already started the differentiation program. On the contrary the LD cells were less subjected to this type of selection, because only a small subpopulation of these cells reached a degree of confluence sufficient to trigger the differentiation process.
The analysis of proteins involved in the exit from the cell cycle during 21 days of differentiation has been very informative. Results about pRB protein dephosphorilation (Tamrakar et al., 2000) showed that the HD cells withdraw from cell cycle at least 3-6 days before LD cells. The same time delay was confirmed analyzing the time-course of the levels of cyclin A and kinase inhibitor p27Kip (Reed, 1997). The early exit from cell cycle showed by the HD cells can be a consequence of the higher degree of confluence in which these cells were maintained and it is consistent with their reduced ability to attach to the plate. Notwithstanding the delay in the onset of sucrase-isomaltase (Beaulieu et al., 1989) accumulation was in accord with the general delay in the exit from cell cycle of LD cells, its value level at plateau confirmed the capability of LD cells to differentiate at the same extent of the HD ones.
40 Analyzing the RT-qPCR time-course of LD and HD cells, we found that two genes encoding for transcription factors controlling intestinal cells differentiation, PPARG (Huin et al., 2002) and CDX2 (Walters, 2005), display similar trend and timing of transcript accumulation. Our interpretation is that both regulatory genes were induced by the same mechanism and with the same timing after cell seeding, starting the differentiation process. The other genes examined by RT-PCR are structural and functional differentiation markers, presumably controlled directly or indirectly by the two above-mentioned transcription factors. These genes could be grouped into two categories according to the trend and timing of their expression: the genes of the first category (MYO1A, SLC11A2, ALPI and CYP3A4) behaved almost in the same way in LD and HD cells, while the expression of the genes belonging to the second category (SI, ANPEP and CLDN4) increased significantly earlier in HD cells, in some case even before the peak of induction of CDX2 and PPARG. Our explanation of this fact is that HD cells have been subjected to a first round of transcriptional induction before the final seeding on the filters.
Notwithstanding this early induction, the level of SI accumulation in HD cells was lower of that reached at the end of differentiation by the LD cells. Also the induction of CYP3A4 was strong in LD cells both as absolute value and in comparison with the HD cells. It is worthwhile to note that previously in literature a similar variability in the expression of SI and CYP3A4 (this latter often undetectable in Caco-2 clones) was ascribed to interclonal variability and passage numbers (Fogh et al., 1977; Peterson and Mooseker, 1992; Schmiedlin-Ren et al., 1997a; Schmiedlin-Ren et al., 1997b).
The microarray data clearly demonstrated that the LD cell growing protocol was able to produce Caco-2 cells that after 21 days were capable to form a perfectly differentiated monolayer of mature enterocytes. Our data, even if limited to the comparison of growing and differentiated cells, appeared very similar and comparable to those recently published by Brown (Saaf et al., 2007; Halbleib et al., 2007). We found a good clusterization of microarray data with the biological processes involved in differentiation. The annotated gene list obtained using DAVID database tools showed a good correlation between the genes up or down regulated in our model and those expected to be up- or down-regulated in intestinal differentiation.
Analyzing the microarray data obtained comparing the 21-day differentiated LD versus HD cells, we found only a limited number of differences. We found 163 differentially expressed genes, which, since we were comparing two differentiated cultures
41 obtained from the same original cell clone and differing only for the growth-density conditions, represents a significant number. More interestingly, about one third of these modulated genes correspond to genes that are regulated during the differentiation process. In our opinion, this significant modulation of the gene expression of the differentiated cells supports our hypothesis that the initial growth-density condition of a Caco-2 cell culture affects the quality of the subsequent differentiation process.