WP-EMS
Working Papers Series in
Economics, Mathematics and Statistics
“The productivity gap among European countries”
• Giorgio Calcagnini (Department of Economics, Society and Politics, University of Urbino)
• Germana Giombini (Department of Economics, Society and Politics, University of Urbino)
• Giuseppe Travaglini (Department of Economics, Society and Politics, University of Urbino)
ISSN 1974-4110 (on line edition) ISSN 1594-7645 (print edition)
The productivity gap among European
countries
G. Calcagnini G. Giombini and G. Travaglini
∗Department of Economics, Society and Politics
Universit`
a di Urbino Carlo Bo
61029 Urbino, Italy
giorgio.calcagnini | germana.giombini | giuseppe.travaglini @uniurb.it
Abstract
This paper aims at analyzing Total Factor Productivity (TFP) in four European countries (France, Germany, Italy and the Nether-lands) between 1950 and 2011. It uses the common trend - common cycle approach to decompose series in trends and cycles. We find that the four economies share three common trends and a common cycle. Further, we show that in the case of Italy and the Netherlands trend and cycle innovations have a negative relationship that supports the ‘opportunity cost’ approach to productivity growth, and that trend innovations are generally larger than cycle innovations. Finally, while we do not explore what drives the three common trends, we show that countries’ differences in TFP performance in recent years may be due to the so-called “deep”determinants in growth literature such as the presence of efficient mechanisms of creation and transmission of knowledge, international integration, and efficient markets and insti-tutions.
Keywords: Total factor productivity; Cointegration analysis; Mar-ket imperfections.
JEL Code: D24 D43 E02 E23
∗Contact author. This paper was prepared for the workshop on R&D, Technology and
Productivity, The Royal Netherlands Institute in Rome (KNIR), November 20, 2015.
1
Introduction
Without deviation from the norm, progress is not possible — Frank Zappa
Productivity (as measured as output per unit of single input or total inputs), and its growth, is well recognized by essentially all economists as the key variable to long-run improvement in terms of income and (un)employment. Most of the same economists would also agree that productivity depends upon a combination of investment in physical and human capital, knowledge and technical progress. However, the link between this combination and productivity may be considerably weakened by factors as the institutional quality, market efficiency, degree of openness and flexibility of the economy (Saltari and Travaglini, 2008 and 2010). Therefore, understanding the fac-tors behind productivity is a complex process because more than a single determinant can be significant at the same time (World Economic Forum, 2014 p. 4).
This paper aims at analyzing Total Factor Productivity (TFP) in four European countries (France, Germany, Italy and the Netherlands) between 1950 and 2011. We employ annual data and we focus on Germany, France, Italy and the Netherlands, which have a similar degree of economic develop-ment. This choice should give us some advantages in terms of their stochastic properties. Indeed, we expect that the probability is relatively high that these four countries share a larger number of stochastic trends and cycles than in the case of a larger ‘club’ of countries with different levels of economic devel-opment. In fact, it is by means of the analysis of the TFP trend stochastic characteristics that we expect to achieve a better understanding of the four economies’ growth opportunities.1 In developing our econometric analysis we use a time series approach by which it is possible to calculate for each time series its secular-nonstationary (trend) and cyclical-stationary components without imposing restrictive assumptions on how transitory and permanent shocks affect selected variables. The possibility to separate cycles from trends allows us to concentrate our analysis on the so-called “deep”determinants of TFP, which may still be different from one economy to another, even within the same European market.
To calculate the secular-nonstationary component of the TFP, we em-ploy the multivariate procedure developed by Vahid and Engle (1993), Engle and Issler (1995) and Koziski (1993), known as the common trends - common cycles approach. This methodology has the appealing feature that, in the
1We employed a similar approach in a previous paper, see Calcagnini and Travaglini
special case where the number of common trends (ct ) and common cycles (cc) adds up to the number of time series (ts), trend and cyclical compo-nents can be calculated as simple linear combinations of the data. Further, in this special case we are able to identify trend and cycle components with-out imposing a priori conditions on the relationships existing among the different type of shocks in the economy, as in the case of other time series decomposition analyses (i.e. Blanchard and Quah, 1989).
Common trends are identified in the context of cointegrating relation-ships. Evidence of a single common trend would suggest that productivity time series have structural characteristics of such similarity across economies that the (log) level of Total Factor Productivity converges in the long run. Common cycles, on the other hand, are short-run relationships linking sta-tionary series. If the four economic cycles depend upon the same shocks, a single common cycle can be identified as evidence of business cycle synchro-nization.
We obtain several results.
First, measured TFP shows different dynamics across the four economies. Germany, that up the Eighties recorded the strongest mean growth rate, shows mean growth rates in the remaining sub periods. Differently from Germany, the Netherlands recorded positive mean TFP growth rates during the whole period. France and Italy are cases that are located between those of Germany and the Netherlands. Indeed, while France have been recording negative mean growth rates since the beginning of the Nineties, Italy only shows a decrease in TFP during the last decade.
Second, we show the existence of only one cointegrating relationship among the Total Factor Productivity time series of the four countries. This result implies that the four time series share three stochastic trends that, in turn, implies the absence of convergence of national TFP levels.2 Finding only one cointegrating relationship means that the four economies are struc-turally different and affected by different shocks (or that the same shock produces different results in each country because of the economic and insti-tutional environment in which they occur).
Third, we find that the four time series share a single business cycle. The latter result implies that short-run TFP depends upon the same shocks in all countries. This is the case in which the sum of stochastic trends (three) and common cycles (one) add up to the number of time series (four). There-fore, there is only one trend-cycle decomposition of Total Factor Productivity in each country.
Four, our analysis shows the presence of a relationship between trend
and cycle shocks only for two out of the four economies. Indeed, the corre-lation coefficient between the two types of shock is negative and statistically significant only for Italy and the Netherlands.
Five, we find that trend innovations are generally larger than cycle innovations. Trend innovations are relatively larger in France and Italy than in Germany and the Netherlands.
Overall, these results mean that in the long run a 1% shock to produc-tivity trend determines a 1% increase in the level of Total Factor Productiv-ity. However, in case of negative cycle shocks, countries such as Italy and the Netherlands have a competitive advantage over Germany and France because the short-run dynamics pushes trend TFP in the opposite direction. The negative relationship observed between trend and cycle innovations supports the ‘opportunity cost’ approach to productivity growth (Saint-Paul, 1993). According to it, the intertemporal substitution of productivity-improving ac-tivities along the business cycle predicts that recessions are associated with a higher pace of productivity-improving activities. Again, Italy and the Netherlands are the economies that seem to ‘benefit’ more from short-run negative innovations because, for a given negative shock, their economies react by reallocating resources and obtaining the largest improvement on long-run Total Factor Productivity.
However, the lack of any relationship between the two types of inno-vation in Germany and France means that both economies have sounded “deep”growth-determinants that allow them to cope with short-term shocks without the need to start a resource reallocation that favors productivity-improving activities. In other words, the two aforementioned economies are equipped with productive systems that, on average, show greater growth po-tential and are less influenced by business cycles than, for instance, Italy. By growth potential we mean the presence of efficient mechanisms of cre-ation and transmission of knowledge, interncre-ational integrcre-ation, and efficient markets and institutions.
Data on the most recent sub-period, for which we were able to collect information, seem to support our hypothesis according to which long-run TFP performance is related to the so-called “deep”determinants of economic growth.3 Indeed, the four countries studied in this paper are characterized by different degrees of institutional and market efficiency, international in-tegration, and of mechanisms of creation and transmission of knowledge. We believe that governments should increasingly aim at reducing market imperfections that hinder businesses’ dynamism and, consequently, the real-location of resources from less to more productive investment, and improving
the mechanisms of creation and transmission of knowledge, especially those related to universities.
The paper is organized as follows. The next section describes the data and results from the common trend - common cycle approach. Section three discusses results and main implications for economic policies. The final Sec-tion concludes.
2
Recovering Common Trends and Common
Cycles in Total Factor Productivity
Our analysis makes use of Total Factor Productivity time series (at constant national prices) from the University of Groningen and the University of Cal-ifornia, Davis for the period 1950-2011 that are included in the Penn World Table (PWT) 8.0.4 PWT8.0 includes a TFP measure that allows for com-parisons across countries at a point in time (variable CTFP) and a measure that allows comparisons within countries across the years (RTFPN A) (See Feenstra et al., 2013a and 2013b) In this paper we make use of RTFPN A because of the time-series nature of our analysis.5 All RTFPN A time series are annual indexes with base 2005=100 and span from 1950 to 2011.
There are some caveats concerning the use of Total Factor Productivity time series. Lipsey and Carlaw (2000) provide nine different quotations re-ferred to TFP measures taken from the economic literature and group them in three main positions:
• Changes in TFP measure the rate of technical change;
• TFP measures only the free lunches of technical change, which are mainly associated with externalities and scale effects;
• TFP measures anything useful.6
There are also a number of measurement issues related to TFP that need to be considered. Among them, the need to correctly estimate capi-tal and labor inputs. Further, the basic Solow residual calculation assumes that the factors of production are flexible and fully employed (Solow, 1957). This may not be the case if there are costs involved in hiring and firing or
4Time series are available at https://research.stlouisfed.org/fred2/search?st=
total+factor+productivity
5We made our analysis all over again also using CTFP time series as a robustness check
of our results. Overall, our results based on RTFPN As are confirmed.
in installing new machines and equipment. Finally, firms may respond to short-run fluctuations in demand by varying the degree of capital (and la-bor) utilization.7 Some of these measuring issues have been taken care in calculating TFP time series included in the Penn World Table (PWT) 8.0.
Our approach to the use and meanings of TFP is somewhat eclectic. We still interpret changes in TFP as a measure of modifications occurred in the way the economy generates income, and try to identify whether these changes are related to types of externalities, such as institutions or market imperfections.
Keeping in mind these caveats, we now move to data analysis.
The means of annual percentage growth rates of TFP over the whole period show significant differences among the four economies. Germany and France record the largest average growth rate at 1.07% per year, followed by the Netherlands and Italy (0.88% and 0.84%, respectively) (see Table 1). These figures mean that, on average, the TFP growth rate of the first two economies has been around 25% larger than the growth rates of Italy and the Netherlands (Dutch TFP growth rate has been almost 5% larger than the Italian one). Columns 3 to 6 of Table 1 show mean TFP growth rates for different sub-periods. The latter are measured according to calendar decades after 1980 to avoid the choice of another periodization that, in any case, would be a matter of debate. It is worthwhile noting that the Netherlands are the only economy with positive TFP growth rates in all sub-periods. The decline in the Italian TFP occurred only during the last decade, while in Germany and France started recording negative TFP growth rates since the Eighties and the Nineties, respectively.8
To obtain a more precise description of TFP we rely on the common trend - common cycle (CTCC) method developed by Vahid and Engle (1993), Engle and Issler (1995), and Kozicki (1993). The CTCC method is based on the joint analysis of the degree of short- and long-run comovements present in the Total Factor Productivity series of the four economies. This method-ology works under the assumption that the data contain unit-roots, there-fore stochastic trends. Searching for common trends amounts to performing cointegration tests, which can be interpreted as long-run comovement tests.
7See Groth et al. (2004).
8A less dynamic business growth distribution is associated with lower productivity
growth. Importantly, both a higher share of growing and shrinking firms are correlated with faster productivity growth. Indeed, European countries have on average a lower share of high-growth firms than the US. But they also have fewer medium-growth firms and fewer shrinking firms. At the same time, Europe has a much larger share of ‘static’ firms, that is, firms that neither expand nor contract in a three-year period (Bravo Biosca, 2010).
Table 1: Total Factor Productivity - Growth Rates
(Means of annual percentage growth rates)
1950-2011 1950-1980 1981-1990 1991-2000 2001-2011
Germany 1.07 2.49 -0.30 -0.20 -0.36
France 1.07 2.28 0.22 -0.23 -0.26
Italy 0.84 1.99 0.18 0.19 -1.12
Netherlands 0.88 1.41 0.26 0.72 0.12
Source: Our calculations on data from University of Groningen and University of California, Davis. Total Factor Productivity at Constant National Prices, retrieved from FRED, Federal Reserve Bank of St. Louis
https://research.stlouisfed.org/fred2/search?st=total+factor+productivity.
Cycles are modeled as transitory but persistent processes, which may be com-mon to several economies. Such cycles reveal all synchronized persistence in TFP series, describing their short-run comovement. Testing for common cy-cles amounts to searching for independent linear combinations of the (level of the) TFP series that are random walks, thus cycle free. The test therefore is a search for linear combinations of the first differences of the variables whose correlation with the elements of the past information is zero. Past informa-tion is formed by the lagged first differences of TFP series and a number of error correction (EC) terms equal to the cointegration rank (Vahid and Engle, 1993).9
The CTCC methods requires three fundamental steps.
The first step is a test of Total Factor Productivity nonstationarity. This was carried out by means of the Modified Dickey-Fueller (DF-GLS) test.10 Results from the DF-GLS test are shown in Table 2 and support the null hypothesis of nonstationarity for all four time series.11
The second step involves tests for cointegration. We employ Johansen’s (1988, 1991) technique, which estimates the number of linearly independent cointegrating vectors (r ). We consider the data as being approximately well described by a Vector Autoregression model (VAR) with a restricted constant and no time trend both in the cointegration space and data (“Model 1”in
9The EC is the one calculated on the basis of the cointegration vector.
10Elliott et al. (1996), and later studies, have shown that this test has significantly
greater power than the previous versions of the augmented Dickey-Fuller test.
11Unit root tests, Cointegration tests and Canonical correlation analysis are carried out
after removing the deterministic components (trend and intercept) of each time series. On this approach see Lutkepohl and Saikkonen (2000), Saikkonen and Lutkepohl (2002). Unit root tests confirm that the (log of the) original series and the series after removing the deterministic components are I(1), while their first differences are I(0).
Table 2: Modified Dickey-Fuller (DF-GLS) Test: 1952-2011.
(Null: Time Series is Nonstationary)
Test Statistic 5% Critical Value Max Lag Germany -1.628 -2.922 1 France -1.236 -2.922 1 Italy -2.561 -2.923 2 Netherlands -2.375 -2.924 3
the context of the Johansen’s methodology).12 Table 3 presents Johansen’s trace statistic test for the system containing the time series of Total Factor Productivity for Germany, France, Italy and the Netherlands. The first ‘trace statistics’ value smaller than the 5% critical value is for r< = 1. This result, combined with the rejection of the null that r = 0, allows us to conclude that there is only one cointegration vector that, in turn, implies that TFP of the four countries does not converge. The latter result is consistent with national economies characterized by different structures, institutions, market imperfections and, likely, by different technology shocks.13 Indeed, finding only one cointegrating vector rules out the possibility that TFP data of the four countries have one common stochastic trend. Since the rank of the cointegrating space is 1 the four TFP series will share three idiosyncratic common trends.
Table 3: Johansen Tests for Cointegration: 1952-2011.
(r = number of cointegrating relationships)
Null Log Eigenvalue Trace 5% Critical Likelihood Statistic Value
r=0 694.5 . 57.45 47.21
r<=1 709.0 0.382 28.62 29.68 r<=2 716.4 0.219 13.78 15.41
r<=3 722.2 0.176 2.21 3.76
r<=4 723.3 0.036 . .
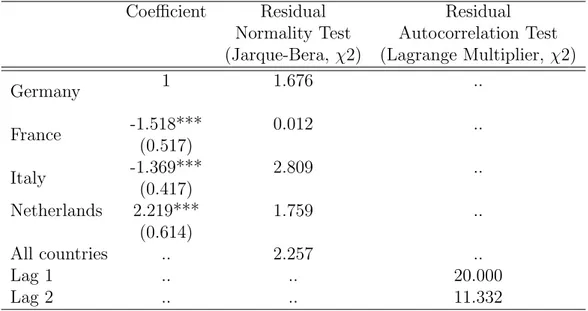
Table 4 shows the estimated cointegration vector on the base of a
Vec-12See previous footnote.
tor Error Correction Model (VECM) and conditioning on one lag of the endogenous variables. Estimated coefficients are statistically significant and all residuals passed autocorrelation and normality tests, a desirable feature since Johansen’s test assumes independent Gaussian errors.
Table 4: Cointegration Vector Estimates
Coefficient Residual Residual
Normality Test Autocorrelation Test (Jarque-Bera, χ2) (Lagrange Multiplier, χ2)
Germany 1 1.676 .. France -1.518*** 0.012 .. (0.517) Italy -1.369*** 2.809 .. (0.417) Netherlands 2.219*** 1.759 .. (0.614) All countries .. 2.257 .. Lag 1 .. .. 20.000 Lag 2 .. .. 11.332
∗∗∗,∗∗,∗ statistically significant at the 1%, 5% and 10% probability level.
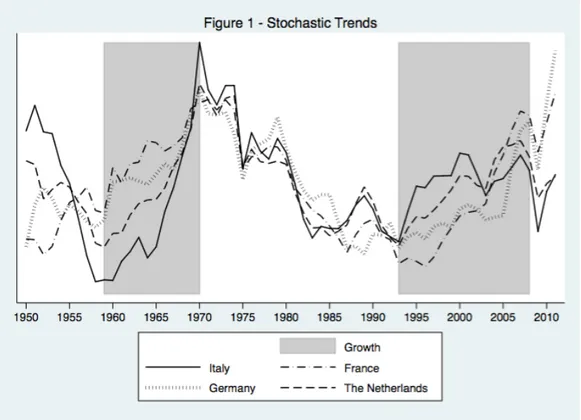
The (log of) common trends of the four TFP series are plotted in Fig-ure 1. Shaded areas represent two of most important time periods in terms of economic growth for European economies, which are common to all four countries. The first shaded area refers to the fabulous Sixties during which the secular component of TFP recorded an increase as a consequence of a prolonged expansion in investment in the years following the end of the second world war. The second one, which again mark another phase of increasing TFP, refers to the time period that starts in the early Nineties characterized by the diffusion of ICTs and Internet as main driving forces of economic growth. Especially Internet drove business transformation and economic modernization by also rejuvenating traditional activities. Indeed, the Internet technology has enabled fundamental business transformations that spans the entire value chain in virtually all sectors and types of compa-nies (see Dedrick et al., 2003; Manyika and Roxburgh, 2011). The economic crisis of 2008 seems to have only temporarily stopped the secular compo-nent of TFP that continued to growth in the most recent years, even though with different intensities across the four economies. Indeed, the burst of the 2008 crisis hit the German and French economies less hard than the Italian
and Dutch ones. Therefore, the former returned to their pre-crisis stochastic trend faster than the latter (see Figure 1).
The third step involves tests for the existence of common cycles. The procedure developed by Vahid and Engle (1993) suggests looking for linear combinations of the series, i.e. Total Factor Productivity, that are uncor-related with any linear combination of the RHS variables of the Error Cor-rection Model formed with a number of error corCor-rection terms equal to the cointegration rank. This is equivalent to imposing a reduced rank condition on the coefficient matrix of lagged TFP growth rates and error correction terms. Vahid and Engle suggest performing this reduced rank condition test by canonical correlation analysis. In this case, the cofeature rank, s, is the number of statistically zero canonical correlations and the number of common cycles is equal to the number of series minus s.
Table 5 shows the results of the common-cycle tests carried out by means of the Wilks’ Lambda Statistic and its corresponding F-test of the null hypotheses that the current and all smaller canonical correlations are statistically zero. As noted before, the cofeature rank s is the number of sta-tistically zero canonical correlations. At the 5% level, the test cannot reject the hypothesis that the three smallest canonical correlations are statistically zero, which implies that s is three. Thus, the four TFP series share one
common cycle and do have similar short-run fluctuations. This feature of the data set exemplifies the basic thrust behind Burns and Mitchell’s (1946) research.
Table 5: Canonical Correlation Analysis: 1951-2011.
(Wilk’s Lambda Test: significance of canonical correlation, s)
Null Canonical Wilk’s Lambda Degrees of Freedom F Correlations Statistic Num./Denom.
s=4 0.666 0.464 20/170 2.213***
s=3 0.353 0.835 12/138 0.638
s=2 0.197 0.953 6/106 0.859
s=1 0.090 0.992 2/54 0.802
∗∗∗,∗∗,∗ statistically significant at the 1%, 5% and 10% probability level.
3
Interpreting common trends and cycles
Once we have trends and cycles of each TFP series we are also able to cal-culate their innovations. In the case of stochastic trends, innovations are the first differences of the series, while in the case of cycles they are residuals from regressing cycles on past information (cycles lagged 1 and 2).14
Table 6 shows results of the correlation analysis between trend and cycle innovations in each country, and their variance decomposition analysis.
Table 6: Correlations between Innovations and Variance Decomposition Analysis
1952-2011
Correlation Coefficients Trend Innovationsa Cycle Innovationsb
Germany -0.05 85.6 14.4
France 0.06 92.9 7.1
Italy -0.46∗∗∗ 89.1 10.1
Netherlands -0.34∗∗∗ 76.4 23.6
a) % of the variance of TFP innovation attributed to trend innovations; b) % of the variance of TFP innovation attributed to cycle innovations;
∗∗∗,∗∗,∗ statistically significant at the 1%, 5% and 10% probability level.
14In both cases we run Lagrange Multiplier tests to check for residual serial correlation.
Innovations are negatively, and statistically significant, correlated in Italy and the Netherlands. The negative relationship observed between trend and cycle innovations supports the ‘opportunity cost’ approach to productivity growth (Saint-Paul, 1993; Calcagnini, 1995). According to it, the intertemporal substitution of productivity-improving activities along the business cycle predicts that recessions are associated with a higher pace of productivity-improving activities. Therefore, on one side we find the economies of Italy and the Netherlands that during recessions react to neg-ative shocks by restructuring their production system, on the other, the economies of Germany and France for which no statistically significant cor-relation has been found (see Table 6).15
The lack of statistically significant correlation between trend and cycle innovations in Germany and France means that both economies have sounded “deep”growth-determinants that allow them to cope with short-term shocks without the need to start a resource reallocation that favors productivity-improving activities. In other words, the two aforementioned economies are equipped with productive systems that, on average, show greater growth po-tential and are less influenced by business cycles than, for instance, Italy. By growth potential we mean the presence of efficient mechanisms of cre-ation and transmission of knowledge, interncre-ational integrcre-ation, and efficient markets and institutions.
Illustrative of the differences that characterize the four economies are the results of the variance decomposition of Table 6. Indeed, trend innova-tions are generally larger than cycle innovainnova-tions. The former are relatively larger in France and Italy, followed by Germany and the Netherlands.
In the long run a 1% shock to productivity trend determines a 1% increase in the level of TFP. However, in case of negative trend shocks, Italy and the Netherlands should have a competitive advantage over Germany and France because the short-run dynamics pushes Total Factor Productivity towards the opposite direction by reallocating resources and obtaining the largest improvement on long-run TFP.
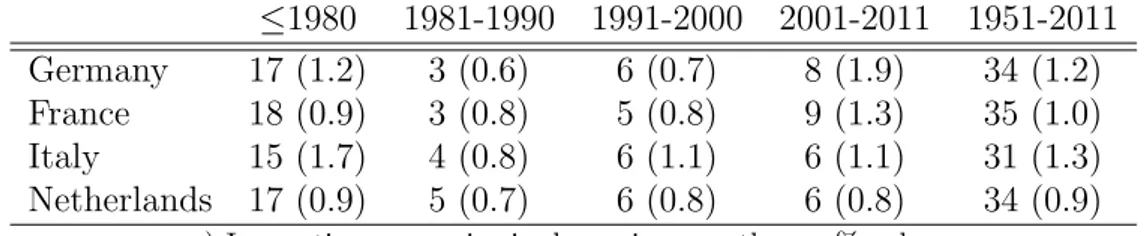
Table 9 provides further information on the characteristics of trend in-novations for the four countries such as the number of positive trend shocks and their mean size. We note that, over the whole time period, Italy is the economy that recorded the lowest number of positive trend shock (31), but the largest mean shock size (1.3%). As for the remaining three economies,
15For instance, several studies showed the Italian manufacturing firms, mainly those
exposed to international competition and of larger size, before the last economic recession, undergone a deep restructuring process (Cipolletta and De Nardis, 2012; Arrighetti and Tra`u, 2012; Chiappini, 2012; Di Giacinto and Micucci, 2011; Bugamelli et al., 2010; De Nardis and Pappalardo, 2010; De Nardis and Ventura, 2010).
while the number of positive shocks has been almost the same (34-35 shocks), Germany recorded the second largest mean shock size (1.2%), followed by France (1.0%) and the Netherlands (0.9%). When we focus on the most recent sub-period (2001-2011), Germany and France were those with the highest number of positive shocks (8 and 9, respectively) and the largest mean shock size (1.9% and 1.3%, respectively). As for Italy and the Nether-lands, they recorded six positive shocks each, and mean size shocks of 1.1% and 0.8%, respectively. These data confirm the visual analysis of Figure 1 according to which, during the most recent years, Germany and France experienced the most dynamic secular trends with respect to Italy and the Netherlands.
Table 7: Number of Positive Trend Innovations and Their Mean Sizea
≤1980 1981-1990 1991-2000 2001-2011 1951-2011 Germany 17 (1.2) 3 (0.6) 6 (0.7) 8 (1.9) 34 (1.2) France 18 (0.9) 3 (0.8) 5 (0.8) 9 (1.3) 35 (1.0) Italy 15 (1.7) 4 (0.8) 6 (1.1) 6 (1.1) 31 (1.3) Netherlands 17 (0.9) 5 (0.7) 6 (0.8) 6 (0.8) 34 (0.9)
a) Innovation mean size is shown in parentheses, % values.
3.1
Deep determinants of economic growth
To provide some explanations for the differences observed in TFP sec-ular trends among the four European economies, we turned ourselves to analyze the “deep”determinants of economic growth such as the presence of efficient markets and institutions, efficient mechanisms of creation and transmission of knowledge, the degree of international integration. We also limited our analysis to the most recent sub-period for which more data on the “deep”determinants of economic growth are available.
As discussed above, one of the most powerful mechanisms behind TFP dynamics is the ease of each economy to reallocate resource that favors productivity-improving activities. The reallocation of resources from less to more productive businesses is mainly affected by businesses’ dynamism, both in terms of growth and contraction. A less dynamic business growth distribu-tion is associated with lower productivity growth. Importantly, both a higher share of growing and shrinking firms are correlated with faster productiv-ity growth. This business churning means more experimentation/innovation and, in the long run, higher productivity through the selection of the most
efficient firms. In a ‘lock-in context’, such as the Italian one, firms are follow-ing a risk-averse approach. Too many firms appear either unwillfollow-ing or unable to experiment and exploit new growth opportunities. As a result, they fail to innovate effectively. The benefits of innovation are only maximized when firms build on it. This means expanding and replacing less successful firms, driving productivity growth in the process.16
To generate its benefits this process needs an environment where not just barriers to entry, but also barriers to growth and contraction, such as improving product and labour market regulation, better access to finance and to markets across borders, are removed. Table 8 shows the ranking on the ease of doing business in Germany, France, Italy and the Netherlands in 2005 and 2011 (World Bank, 2006 and 2012). Italy is the country with the lower ranking, that is with the worst conditions to do business. Further, Italy lost 10 positions in the ranking between 2005 and 2011 while, for instance, France gained 18 positions and is now closer to Germany that lost 3 positions and ranks 22. Finally, the Netherlands ranks 30 in 2011 from 24 in 2005.17
Table 8: Ranking on the Ease of Doing Business
2005 2011
Germany 19 22
France 44 26
Italy 70 80
Netherlands 24 30
A high ranking on the ease of doing business index means that the regulatory environment is more conducive to the starting and operation of a local firm.
Source: World Bank (2012 and 2006).
Another “deep”determinant of economic growth is the integration of one economy in the world market and is measured through its market share and international trade openness.18 The idea is that trade is a carrier of
16See Bravo Biosca (2010).
17The Italian economy, especially its manufacturing, still finds itself ‘locked-in’ with a
production structure that on average has not been changing much during the last 25-30 years and failed to converge towards the most developed European countries such as France and Germany. However, it is not clear if this ‘lock-in effect’ is the cause or the result of the ‘missing’ intertemporal substitution of productivity-improving activities. More likely the two phenomena tend to reinforce one-another and increase the gap between the Italian TFP and that of the other most industrialized countries.
knowledge, which in turn has a positive effect on TFP. In particular, certain kinds of imports (machinery and equipment) are expected to generate more technology transfer than others.
As for trade openness, all four countries increased the ratio of the sum of imports and exports on GDP between 2005 and 2011. However, in 2011 the Netherlands show the highest ratio of 146% followed by Germany at 85%. France and Italy recorded similar ratios of trade openness of 58% and 56%, respectively.
Table 9: Trade opennessa and Export market share % values
Trade openness Export market share
2005 2011 2005 2011
Germany 71 85 7.4 7.7
France 53 58 4.6 3.6
Italy 49 56 3.7 2.9
Netherlands 123 146 2.8 3.1
a) Sum of exports and imports (% of GDP).
Source: World Bank (2015), World Development Indicators.
The above results are consistent with those of the World Economic Fo-rum on global competitiveness according to which Germany and the Nether-lands are most competitive and innovative economies, followed by France and Italy (Table 10).
Table 10: The Global Competitiveness Index (mean score 2004-2011)
Overall index Innovation and sophistication factors
Germany 5.39 5.34
France 5.10 4.88
Italy 4.35 4.11
Netherlands 5.37 5.16
Scores are measured on a 1-to-7 scale.
Source: World Economic Forum (several issues).
A more direct way to analyze the contribution of technology/knowledge transfer on TFP is to look at the R&D investment and the knowledge transfer
(KT) systems in each of the four countries. As for the former, Germany and France show the highest ratios of R&D investment on GDP, followed by the Netherlands and Italy. During the most recent period, German R&D investment has been more than twice the Italian one (Table 11, columns (1) and (2)). The chief role of R&D is to lead to new products, processes and knowledge, i.e. leading to innovation and the understanding and imitation of others’ discoveries. The latter is related to absorptive capacity and provides for efficient technology/knowledge transfer.19 Therefore, R&D investment is one of the main determinant of the secular trend of TFP.
Table 11: R&D Expenditure - % of GDP (Columns (1)-(2)) and Implementation of the 2008 KT Recommendation in European
countries (Column (3)) - % values
(1) (2) (3) (4)∗ 1996-2004 2005-2011 2012 ∆ (excl. plans) Germany 2.4 2.7 78 -7 France 2.2 2.2 64 0 Italy 1.1 1.2 59 -8 Netherlands 1.9 1.9 61 -6
Source: World Bank (2015), World Development Indicators and European Commission (2013), pp. 30, 32. ∗Same as Column (3), but excluding plans.
As we mentioned the role of KT systems in relation of each country’s absorptive capacity, we note that the implementation of the 2008 KT Rec-ommendations shows a significant variability among the four countries in our study. Again, Germany shows the highest stage of implementation of the KT Recommendations, while Italy the lowest. Results do not change when we exclude plans from our calculations (Table 11, columns (3) and (4)).
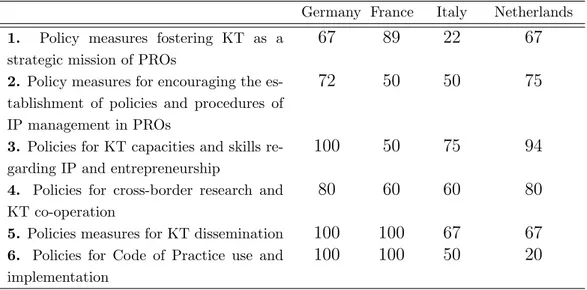
Table 12 breaks down results on the implementation of KT Recom-mendations by single policy measure. These policy measures concern themes such as the fostering of KT as a strategic mission of public research or-ganizations (PROs), policies for KT capacities and skills regarding IP and entrepreneurship, cross-border research and KT co-operation, measures for KT dissemination. In most of all policies shown in Table 12, the two coun-tries that appear in a more advanced stage of implementation are Germany and France. Again, Italy looks well lagged behind the other three countries. Another way to look at the effect of an efficient input and output reallocation on TFP is to analyze the presence of market imperfections. The
Table 12: Implementation of the 2008 KT Recommendation in European countries
broken down by Recommendation theme - % values
Germany France Italy Netherlands 1. Policy measures fostering KT as a
strategic mission of PROs
67 89 22 67
2. Policy measures for encouraging the es-tablishment of policies and procedures of IP management in PROs
72 50 50 75
3. Policies for KT capacities and skills re-garding IP and entrepreneurship
100 50 75 94
4. Policies for cross-border research and KT co-operation
80 60 60 80
5. Policies measures for KT dissemination 100 100 67 67
6. Policies for Code of Practice use and implementation
100 100 50 20
Source: European Commission (2013), Chapter 2.4.
general idea is that the presence of market imperfections makes the resource reallocation more difficult. We focus on three types of imperfection: product and labor market regulations and imperfections in the financial markets.
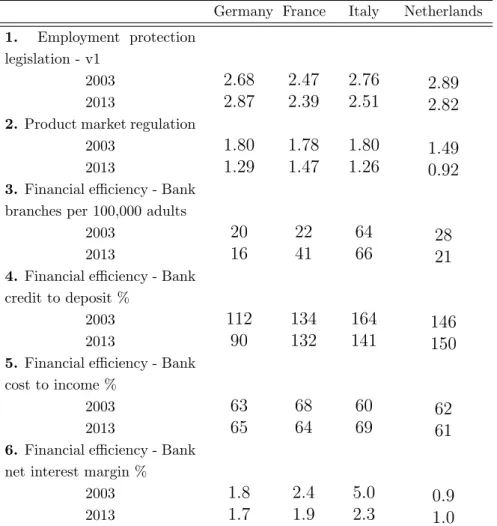
As for labor market imperfections, measured by the OECD Employ-ment Protection Legislation index (EPL)20, the Netherlands and Italy showed the highest levels of labor market rigidity in 2003, followed by Germany and France, respectively. Further, between 2003-2013, three (France, Italy and the Netherlands) out of the four countries increased the level of market flex-ibility and Italy has been the country where the EPL indicator showed the largest decrease. Diversely, Germany increased the rigidity of its labor mar-ket (see Table 12). EPL impacts TFP through its effects on firms’ investment. Within a neoclassical framework, regulation can increase the cost the firm faces when expanding its productive capacity, and limits its capacity to re-spond to changes in fundamentals. Therefore, a higher EPL should result in a negative impact on investment, by increasing firms’ adjustment costs
20The EPL Version 1 of this indicator measures the strictness of regulation of individual
dismissal of employees on regular or indefinite contracts. It incorporates 8 data items, which refer to the procedurial inconveniance and to the notice and severance pay for no-fault individual dismissal. All indicators are expressed in a scale 0-6, in which higher values refer to higher strictness (OECD, 2004 and 2012).
over time. However, higher Employment Protection Legislation values also mean higher firing costs and, therefore, higher labor costs. The latter im-ply a substitution effect of labor with capital, with the consequence of likely higher capital accumulation growth rates. The substitution effect means that firms find it convenient to move towards more capital-intensive technologies wherever labor market institutions make the organization of production less responsive to the business cycle (see Calcagnini et al., 2009, 2014). Which of the two effects dominates cannot be determined a priori and may depend upon the combined effects of other market imperfections both in the product and the financial markets.
Table 13: Market imperfections in European countries
Germany France Italy Netherlands 1. Employment protection
legislation - v1
2003 2.68 2.47 2.76 2.89
2013 2.87 2.39 2.51 2.82
2. Product market regulation
2003 1.80 1.78 1.80 1.49
2013 1.29 1.47 1.26 0.92
3. Financial efficiency - Bank branches per 100,000 adults
2003 20 22 64 28
2013 16 41 66 21
4. Financial efficiency - Bank credit to deposit %
2003 112 134 164 146
2013 90 132 141 150
5. Financial efficiency - Bank cost to income %
2003 63 68 60 62
2013 65 64 69 61
6. Financial efficiency - Bank net interest margin %
2003 1.8 2.4 5.0 0.9
2013 1.7 1.9 2.3 1.0
Source: OECD (2015) for 1 and 2, World Bank (2015) for 3 to 6.
decade, often triggered by the economic crisis. Among the four countries, the Netherlands has, in 2013, the most competition-friendly regulatory en-vironment, with the lowest score for regulation of product market. The Netherlands is followed by Italy, Germany and France. Between 2003 and 2013, the country with the largest improvement in the overall Product Mar-ket Regulation (PMR)21 score is Italy, which also became the second most competition-friendly regulatory environment after the Netherlands (see Table 12).22
In economies where the financial markets are well developed, invest-ment opportunities can readily be seized, resources are more likely to be allocated optimally to investments with the highest returns. The latter, in turn, imply a higher probability for TFP growth.23 As for the financial mar-ket imperfections, the four marmar-kets are characterized by different structures as measured by the number of bank branches per 100,000 adults. Italy is the economy where the physical presence of banks is overwhelming compared to that of the others: in 2013 the Italian banking industry operates by means of 66 bank branches per 100,000 adults, which are 50% more numerous than those in France, three and four times those in the Netherlands and Germany, respectively (see Table 12). These differences in the national banking indus-tries have a positive effect on the respective loan-deposit multipliers, but a negative one on bank internal costs (as measured by the cost-income ratio) and, especially, on the cost of bore by firms when accessing bank financing. Indeed, data on bank net interest margins show that loans are relatively costlier in Italy than in the others three economies. The most efficient bank-ing industry is the Dutch one (see Table 12).
4
Conclusion
In this paper we applied the common-trend and common-cycle methodol-ogy to identify trend and cycle components of Total Factor Productivity in
21The OECD Indicator of Product Market Regulation (PMR) measures the degree to
which policies promote or inhibit competition in areas of the product market where com-petition is viable. More specifically, it measures the incidence of regulatory barriers to competition via state control of business operations and the protection of incumbents, as well as through various legal and administrative barriers to start-ups or to foreign trade and investment. The indicator is constructed based on detailed information on regulatory practices across a large number of sectors, with a strong emphasis on network industries, but also professional services and retail distribution. See Koske et al. (2015).
22For an analysis of the effects of market regulation on profits and investment see
Calcagnini et al. (2015).
Germany, France, Italy and the Netherlands and, subsequently, to identifies some of the so-called “deep”determinants of trend TFP in each economy.
We found that the four TFP series share a single common cycles, but they share more than one single common stochastic trend. Indeed, the num-ber of common stochastic trend is equal to three that, together with the finding of a single common cycle, gives rise to a special situation according to which we were able to identify trend and cycle components without impos-ing a priori conditions on the relationships existimpos-ing among the different type of shocks in the economy, as in the case of other time series decomposition analyses.
Once the trend TFPs of the four economies were calculated, we tried to speculate on some of their “deep”determinants, namely the presence of efficient mechanisms of creation and transmission of knowledge, international integration, and efficient markets and institutions.
Our results, using data on the most recent sub-period (2001-2011) for which we were able to collect information, seem to support our hypothesis according to which long-run TFP performance is positively related the de-gree of institutional and market efficiency, international integration, and of mechanisms of creation and transmission of knowledge.
As policy implications, we believe that governments should increasingly aim at reducing market imperfections that hinder businesses’ dynamism and, consequently, the reallocation of resources from less to more productive in-vestment, and improving the mechanisms of creation and transmission of knowledge, especially those related to universities. Policies aimed at solely reform labor market, raising its flexibility, without driving firms towards in-novation and skilled investments can have the unintended consequence to weaken the degree of competition and the aggregate technology advance-ments of economies.
References
Arrighetti A. and F. Tra`u (2012), “Far from the madding crowd. Sviluppo delle competenze e nuovi percorsi evolutivi delle imprese italiane”, L’Industria, March.
Bernard A. B., and S. N. Durlauf (1995), “Convergence in International Output”, Journal of Applied Econometrics, 10 (2), 97-108.
Blanchard O. and D. Quah (1989), “The Dynamic Effects of Aggregate Demand and Supply Disturbances”, American Economic Review,79, 655-673. Bravo Biosca A. (2010), “Growth Dynamics. Exploring business growth and contraction in Europe and the U.S.”, Nesta Research report: November 2010.
Bugamelli M., Schivardi F. and R. Zizza (2010), “The Euro and Firm Restructuring”, in A. Alesina and F. Giavazzi (Eds) Europe and the Euro, pp. 99-138, University of Chicago Press, Chicago
Burns, A.F., and W.C. Mitchell (1946), “Measuring business cycles”, Na-tional Bureau of Economic Research. New York, NY.
Calcagnini G. (1995), “Common trends and common cycles in interna-tional labor productivity”, Economics Letters, 48: 179-184.
Calcagnini G., Ferrando A. and G. Giombini (2014), “Does Employment Protection Legislation affect Firm Investment? The European Case”, Eco-nomic Modelling, Volume 36, pp. 658-665.
Calcagnini G., Ferrando A. and G. Giombini (2015), “Multiple Market Imperfections, Firm Profitability and Investment”, European Journal of Law and Economics, vol. 40(1), pp. 95-120.
Calcagnini G., Giombini G. and E. Saltari (2009), “Financial and Labor Market Imperfections and Investment”, Economics Letters, vol. 102; pp. 22-26.
Calcagnini G., and G. Travaglini (2014), “A time series analysis of labor productivity. Italy versus the European countries and the U.S.”, Economic Modelling, Volume 36, pp. 622-628.
Chiappini R. (2012), “Persistence vs. mobility in industrial and techno-logical specialisations: Evidence from 11 Euro area countries”, draft, Lab-oratoire d’Analyse et de Recherche en Economie et Finance Internationales (LAREFI), Universit´e Montesquieu Bordeaux IV.
Cipolletta I. and S. De Nardis (2012), “L’Italia negli anni 2000: poca crescita, molta ristrutturazione”, draft.
Coe D.T. and E. Helpmann (1995), “International RD Spillovers”, Quar-terly Journal of Economics, Vol. 113, pp. 903-948.
De Nardis S. and C. Pappalardo (2010), “Imprese italiane nella compe-tizione internazionale: Modalit`a di un aggiustamento a lungo misconosci-uto”, paper presented at the 51st Annual Meeting of the Italian Economic Association, October.
De Nardis S. and M. Ventura (2010), “The Effects of Product Dropping on Firm’s Productivity and Employment Composition”, Empirical Economics Letters, 9(4): 343-352.
Dedrick, J., Gurbaxani, V., and Kraemer, K. L. (2003), “Information technology and economic performance: A critical review of the empirical evidence”, ACM Computing Surveys, 35(1), 1-28
Di Giacinto V. and G. Micucci (2011), “Il miglioramento qualitativo delle produzioni italiane: evidenze da prezzi e strategie delle imprese”, Banca d’Italia, Temi di discussione, n. 804 April.
Elliott, G., Rothenberg T. J., and J. H. Stock (1996), “Efficient tests for an autoregressive unit root”, Econometrica 64: 813-836
Engle R.F., and J.I. Issler (1995), “Estimating common sectoral cycles”, Journal of Monetary Economics, vol. 35(1): 83-113.
European Commission (2013), “Knowledge Transfer Study 2010-2012, Fi-nal Report”, Luxembourg: Publications Office of the European Union.
Feenstra R.C., Inklaar R. and M. P. Timmer (2013a), “The Next Gener-ation of the Penn World Table”, NBER Working Paper No. 19255
Feenstra R.C., Inklaar R. and M. P. Timmer (2013b), “PWT 8.0 - A user guide”, http://www.rug.nl/research/ggdc/data/pwt/v80/pwt_80_ user_guide.pdf.
Griliches S (1994), “Productivity, RD, and the Data Constraint”, Amer-ican Economic Review, 84(1), pp. 1-23.
Groth C., Gutierrez-Domenech M. and S. Srinivasan (2004), “Measuring total factor productivity for the United Kingdom”, Bank of England Quar-terly Bulletin, Spring, pp.63-73.
Isaksson A. (2007), “Determinants of total factor productivity: a litera-ture review”, UNIDO Staff Working Paper 02/2007
Johansen, S. (1988), “Statistical analysis of cointegrating vectors”, Jour-nal of Economic Dynamics and Control 12: 231-254.
Johansen, S. (1991), “Estimation and hypothesis testing of cointegration vectors in Gaussian vector autoregressive models”, Econometrica 59: 1551-1580.
Koske I., Wanner I., Bitetti R. and O. Barbiero (2015), “The 2013 update of the OECD’s database on product market regulation”, OECD Economics Department Working Papers No. 1200.
Kozicki, S. (1993), “Techniques for Estimating Dynamic Comovement with an Application to Common International Output Fluctuations”,
Fi-nance and Economics Discussion Series, 93-32, Federal Reserve Board, Wash-ington DC.
Lipsey R. G. and K. Carlaw (2000), “What Does Total Factor Productiv-ity Measure?”, International ProductivProductiv-ity Monitor, Nr. 1, Fall (Unabridged version), http://www.csls.ca/ipm/ipm1.asp.
Lutkepohl, H. and P. Saikkonen (2000), “Testing for the Cointegrating Rank of a VAR Process with a Time Trend”, Journal of Econometrics, 95: 177-198.
Mayer J. (2001), “Technology Diffusion, Human Capital and Economic Growth in Developing Countries”, Discussion Papers, No. 154, Geneva: United nations Conference on Trade and Development.
Manyika J. and C. Roxburgh (2011), “The great transformer: The im-pact of the Internet on economic growth and prosperity”, McKinsey Global Institute, October.
OECD (2004), “OECD Employment Outlook”, Paris: OECD. OECD (2012), “http://stats.oecd.org/”.
OECD (2015), “http://www.oecd.org/eco/growth/indicatorsofproduct marketregulationhomepage.htm#indicators”.
Saikkonen P. and H. Lutkepohl (2002), “Trend Adjustment Prior to Test-ing for the CointegratTest-ing Rank of a Vector Autoregressive Process”, Journal of Time Series Analysis, 21(4): 435-456.
Saint-Paul G. (1993), “Productivity growth and the structure of the busi-ness cycle”, European Economic Review, 37: 861-890.
Saltari E. and G. Travaglini (2008), “Il rallentamento della produttivit`a del lavoro e la crescita dell’occupazione. Il ruolo del progresso tecnologico e della flessibilit`a del lavoro”, Rivista Italiana degli Economisti, SIE, 13(1), 3-38.
Saltari E. and G. Travaglini (2010), “The Productivity Slowdown Puzzle. Technological and Non-technological Shocks in the Labor Market”, Interna-tional Economic Journal, 23 (4), 483-509.
Solow, Robert M. (1957), “Technological change and the aggregate pro-duction function”, Review of Economics and Statistics 39: 312-320.
Sondermann D. (2012), “Productivity in the Euro Area. Any Evidence of Convergence?”, ECB Working Paper Series, n. 1431.
Vahid F. and R.F. Engle (1993), “Common trends and common cycles”, Journal of Applied Econometrics, 8, 341-360.
World Bank (2006), “Doing Business in 2006. Creating Jobs”, The World Bank and the International Finance Corporation: Washington DC.
World Bank (2012), “Doing Business 2012. Doing business in a more transparent world”, The World Bank and the International Finance Corpo-ration: Washington DC.
World Bank (2015), “World Development Indicators”, http://data.worldbank. org/data-catalog/world-development-indicators
World Economic Forum (2014), “The Global Competitiveness Report 2014-2015. Full Data Edition”, World Economic Forum: Geneva.