JHEP07(2018)134
Published for SISSA by SpringerReceived: April 26, 2018 Accepted: July 12, 2018 Published: July 20, 2018
Measurement of Υ production in pp collisions at
√
s = 13 TeV
The LHCb collaboration
E-mail:
[email protected]
Abstract: The production cross-sections of Υ (1S), Υ (2S) and Υ (3S) mesons in
proton-proton collisions at
√
s = 13 TeV are measured with a data sample corresponding to an
integrated luminosity of 277 ± 11 pb
−1recorded by the LHCb experiment in 2015. The
Υ mesons are reconstructed in the decay mode Υ → µ
+µ
−. The differential production
cross-sections times the dimuon branching fractions are measured as a function of the
Υ transverse momentum, p
T, and rapidity, y, over the range 0 < p
T< 30 GeV/c and
2.0 < y < 4.5. The ratios of the cross-sections with respect to the LHCb measurement
at
√
s = 8 TeV are also determined. The measurements are compared with theoretical
predictions based on NRQCD.
Keywords: Quarkonium, Hadron-Hadron scattering (experiments), QCD
ArXiv ePrint:
1804.09214
Open Access, Copyright CERN,
for the benefit of the LHCb Collaboration. Article funded by SCOAP3.
JHEP07(2018)134
Contents
1
Introduction
1
2
The LHCb detector and event selection
2
3
Cross-section determination
3
4
Systematic uncertainties
4
5
Results
6
5.1
Cross-sections
6
5.2
Cross-section ratios
11
6
Conclusion
13
The LHCb collaboration
22
1
Introduction
The study of heavy quarkonium (cc and bb) production in high-energy hadron collisions
provides important information to better understand quantum chromodynamics (QCD).
Thanks to theoretical and experimental efforts in the past forty years, the comprehension
of hadronic production of heavy quarkonia has been improved significantly. The
produc-tion of heavy quarkonium in proton-proton (pp) collisions at the Large Hadron Collider
(LHC) is expected to start with the production of a heavy quark pair, QQ, followed by its
hadronization into a bound state. The heavy quark pair QQ is produced mainly via
Lead-ing Order (LO) gluon-gluon interactions. Several models have been proposed to describe
the underlying dynamics, such as the colour-singlet model (CSM) [
1
–
7
] and non-relativistic
QCD (NRQCD) [
8
–
10
]. In the CSM the intermediate QQ state is supposed to be colourless
and has the same quantum numbers as the quarkonium final state, while in NRQCD the
calculations also include the colour-octet contribution. However, at present no model can
describe both the heavy quarkonium production cross-section and polarisation
simultane-ously.
The production of Υ (1S), Υ (2S) and Υ (3S) mesons has been studied at LHC by
ATLAS [
11
,
12
] and CMS [
13
,
14
] collaborations at centre-of-mass energies of 7 TeV and
13 TeV. The measurements have also been performed by LHCb at centre-of-mass energies
of 2.76 TeV [
15
], 7 TeV [
16
–
19
] and 8 TeV [
17
–
20
]. The NRQCD calculations can describe
the trends of the differential production cross-sections in data for all three Υ states within
uncertainties. The measured production cross-section ratios between 7 TeV and 8 TeV [
18
]
as a function of transverse momentum, p
T, are consistently higher than the next-to-leading
JHEP07(2018)134
order NRQCD theory predictions [
21
], and the ratios as a function of rapidity show a
differ-ent trend than the predictions [
22
,
23
]. The measurement performed at 13 TeV presented
here provides valuable input to study the quarkonium production at a higher centre-of-mass
energy, enabling ratios to be determined with respect to data taken at a lower
centre-of-mass energy. Most of the theoretical and experimental uncertainties cancel in the ratios,
and more stringent constraints on the theoretical models can be obtained.
This paper presents a measurement of the differential production cross-sections times
dimuon branching fractions of Υ (1S), Υ (2S) and Υ (3S) mesons, as functions of p
T, and
rapidity, y, over the range 0 < p
T< 30 GeV/c and 2.0 < y < 4.5. Ratios between the
cross-section measurements at 13 TeV and 8 TeV [
18
] are also presented. The measurements are
compared with theoretical predictions based on NRQCD [
24
].
2
The LHCb detector and event selection
The LHCb detector [
25
,
26
] is a single-arm forward spectrometer covering the
pseudora-pidity range 2 < η < 5, designed for the study of particles containing b or c quarks. The
detector includes a high-precision tracking system consisting of a silicon-strip vertex
de-tector surrounding the pp interaction region [
27
], a large-area silicon-strip detector located
upstream of a dipole magnet with a bending power of about 4 Tm, and three stations of
silicon-strip detectors and straw drift tubes [
28
] placed downstream of the magnet. The
tracking system provides a measurement of momentum, p, of charged particles with a
rel-ative uncertainty that varies from 0.5% at low momentum to 1.0% at 200 GeV/c. The
minimum distance of a track to a primary vertex, the impact parameter, is measured
with a resolution of (15 + 29/p
T) µm, where p
Tis expressed in GeV/c. Different types
of charged hadrons are distinguished using information from two ring-imaging Cherenkov
detectors [
29
]. Photons, electrons and hadrons are identified by a calorimeter system
con-sisting of scintillating-pad (SPD) and preshower detectors, an electromagnetic calorimeter
and a hadronic calorimeter. Muons are identified by a system composed of alternating
layers of iron and multiwire proportional chambers [
30
].
The data sample used in this measurement corresponds to an integrated luminosity
of 277 ± 11 pb
−1of pp collisions at a centre-of-mass energy of 13 TeV collected during
2015. The online event selection is performed by a trigger system [
31
] that consists of a
hardware stage selecting dimuon candidates with the product of the transverse momenta
of the muons greater than (1.3 GeV/c)
2, followed by a two-stage software selection based
on the information available after full event reconstruction. In the software trigger, two
muons with p > 6 GeV/c, p
T> 300 MeV/c are selected to form a Υ candidate. These
two muon candidates are required to form a common vertex [
32
] with an invariant mass
M > 4.7 GeV/c
2. To reject high-multiplicity events with a large number of pp interactions,
a set of global event requirements [
31
] is applied, which includes the requirement that the
number of hits in the SPD subdetector be less than 900. In between the first and second
stages of the software trigger, the alignment and calibration of the detector is performed
nearly in real-time [
33
] and updated constants are made available for the trigger. The same
alignment and calibration information is propagated to the offline reconstruction, ensuring
JHEP07(2018)134
the consistency and high-quality of the tracking and particle identification information
between the trigger and offline software. The identical performance of the online and offline
reconstruction offers the opportunity to perform physics analyses directly using candidates
reconstructed in the trigger [
31
,
34
] as done in the present analysis.
After the trigger, the Υ candidates are further selected offline by requiring two well
identified muon candidates with transverse momentum larger than 1 GeV/c, and momentum
larger than 10 GeV/c. The invariant mass of the two muon candidates is required to be in
the range 8.5 < M < 11.5 GeV/c
2. Furthermore, the muons are required to form a vertex
with good fit quality.
The event-selection efficiencies are determined using simulated samples, which are
generated using Pythia 8 [
35
] with a specific LHCb configuration [
36
].
The three Υ
states are assumed to be produced unpolarised in this analysis. The decays of hadrons are
described by EvtGen [
37
], in which final-state radiation is simulated using Photos [
38
].
The Geant4 toolkit [
39
] is used to describe the interactions of the generated particles with
the detector and its response.
3
Cross-section determination
The double-differential production cross-section times dimuon branching fraction (B) is
defined as
d
2σ
dydp
T× B(Υ → µ
+µ
−) =
N (p
T, y)
L × ε
tot(p
T, y) × ∆y × ∆p
T,
(3.1)
where N (p
T, y) and ε
tot(p
T, y) are respectively the signal yields and the total efficiencies for
Υ (1S), Υ (2S) and Υ (3S) states in the given kinematic bin, L is the integrated luminosity,
and ∆p
Tand ∆y are the bin widths.
To determine the signal yields in each kinematic bin, an extended unbinned
maximum-likelihood fit is performed to the dimuon invariant mass distribution of the selected
can-didates. The dimuon mass distribution is described by three Crystal Ball functions [
40
],
one for each of the three Υ states, and the combinatorial background is described by an
exponential function. In each bin, the tail parameters of the Crystal Ball functions are
fixed as done in the previous analysis [
16
]. The mass and mass resolution of the Υ (1S)
state are free parameters. For the Υ (2S) and Υ (3S) states, the mass differences with
re-spect to the Υ (1S) state are fixed to the current world averages [
41
] and the ratios of the
mass resolutions with respect to that of the Υ (1S) state are fixed to those in the simulated
samples.
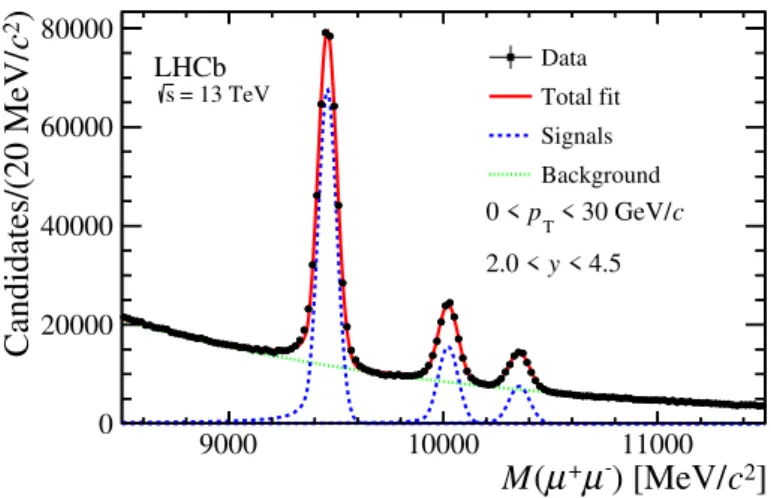
The invariant mass distribution of Υ candidates after all the selections in the range
0 < p
T< 30 GeV/c and 2.0 < y < 4.5 and the fit results are shown in figure
1
. The total
signal yields are 397 841 ± 796 for the Υ (1S) state, 99 790 ± 469 for the Υ (2S) state and
50 677 ± 381 for the Υ (3S) state.
The total efficiency, ε
tot, in each bin is computed as the product of the detector
geomet-rical acceptance and of the efficiencies related to particle reconstruction, event selection,
muon identification and trigger. The detector acceptance, selection and trigger efficiencies
are calculated using simulation. The tracking efficiency is obtained from simulation and
JHEP07(2018)134
]
2c
) [MeV/
-µ
+µ
(
M
9000 10000 11000)
2c
Candidates/(20 MeV/
0 20000 40000 60000 80000 = 13 TeV s LHCb c < 30 GeV/ T p 0 < < 4.5 y 2.0 < Data Total fit Signals BackgroundFigure 1. Dimuon invariant mass distribution of Υ candidates with 0 < pT < 30 GeV/c and 2.0 < y < 4.5. The fit result with the Crystal Ball functions plus an exponential function is also shown. The black dots refer to the data, the blue dashed line refers to the three signals and the green dotted line refers to the background.
corrected using a data-driven method [
42
] to improve its modelling in simulation
sam-ples. The muon identification efficiency is determined from simulation and calibrated with
J/ψ → µ
+µ
−and φ → µ
+µ
−data using a tag-and-probe method. The calibration samples
in data are not sufficient to give precise tracking and muon identification efficiencies for
the whole kinematic region.
4
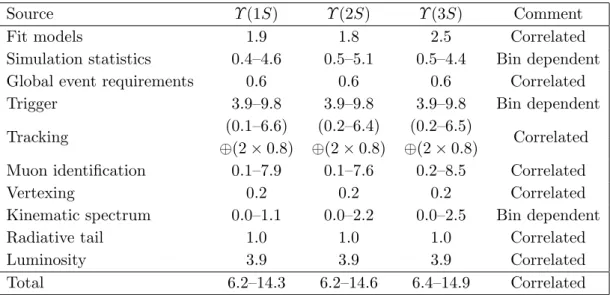
Systematic uncertainties
Several sources of systematic uncertainties are associated with the determination of the
signal yields, efficiencies, and integrated luminosity. They are reported in table
1
and
described below. The dominant uncertainties are due to the trigger efficiency and the
luminosity.
The uncertainty related to the fit model predominantly originates from the description
of the signal tails caused by final-state radiation, and from the description of the background
line shape. The former is studied by using the same fit model to describe the dimuon
invariant-mass distribution of a mixed sample in which the signal is from the full simulation,
and the background is generated with pseudoexperiments using the same shape and fraction
as in the data. The latter is studied by replacing the exponential function with a
second-order Chebyshev polynomial function. A combined relative uncertainty of 1.9% for the
Υ (1S) state, 1.8% for the Υ (2S) state and 2.5% for the Υ (3S) state is assigned.
The efficiency of the global event requirements is found to be 100% in simulation, and
99.4% in data, with negligible statistical uncertainty. The difference, 0.6%, is assigned as
systematic uncertainty.
The trigger efficiency uncertainty is computed using the same method as in the 7 TeV
and 8 TeV analyses [
18
]. The dimuon hardware-trigger efficiency is studied with events
triggered by the single-muon hardware trigger. The difference of this efficiency in data
JHEP07(2018)134
Source
Υ (1S)
Υ (2S)
Υ (3S)
Comment
Fit models
1.9
1.8
2.5
Correlated
Simulation statistics
0.4–4.6
0.5–5.1
0.5–4.4
Bin dependent
Global event requirements
0.6
0.6
0.6
Correlated
Trigger
3.9–9.8
3.9–9.8
3.9–9.8
Bin dependent
Tracking
(0.1–6.6)
(0.2–6.4)
(0.2–6.5)
Correlated
⊕(2 × 0.8)
⊕(2 × 0.8)
⊕(2 × 0.8)
Muon identification
0.1–7.9
0.1–7.6
0.2–8.5
Correlated
Vertexing
0.2
0.2
0.2
Correlated
Kinematic spectrum
0.0–1.1
0.0–2.2
0.0–2.5
Bin dependent
Radiative tail
1.0
1.0
1.0
Correlated
Luminosity
3.9
3.9
3.9
Correlated
Total
6.2–14.3
6.2–14.6
6.4–14.9
Correlated
Table 1. Summary of the relative systematic uncertainties (in %) on the Υ production cross-sections times dimuon branching fractions. Some of the uncertainties are correlated between intervals. For the trigger, track reconstruction and muon identification efficiencies, the uncertainties are larger in the high rapidity region. The uncertainties on the tracking efficiency account for both the limited size of the control samples (first parenthesis) and the impact of different multiplicity between data and simulation on each track (second parenthesis).
and simulated samples divided by that in simulation is assigned as the relative systematic
uncertainty. The systematic uncertainty related to the global event requirements applied
in the single-muon trigger, as well as other sources of uncertainties are assumed to be equal
to those estimated in the inclusive b¯
b cross-section measurements at 7 TeV and 13 TeV [
43
].
In total, the systematic uncertainty coming from trigger efficiencies is 3.9–9.8% for the
three Υ states, depending on the kinematic bin.
The tracking efficiencies in simulation are corrected with a data-driven method using
J/ψ → µ
+µ
−control samples. The number of SPD hits distributions in simulated samples
are weighted to improve the agreement with data and an uncertainty of 0.8% per track is
assigned to account for a different multiplicity between data and simulation. The tracking
efficiencies determined from simulated samples are corrected with the ratio of efficiencies
in data and simulation. The uncertainty due to the finite size of the control samples is
propagated to the final systematic uncertainty using a large number of pseudoexperiments
and is 0.1–6.6% for the Υ (1S) state, 0.2–6.4% for the Υ (2S) state and 0.2–6.5% for the
Υ (3S) state, depending on the kinematic bin. In total, the systematic uncertainty
origi-nating from the tracking efficiency is 1.6–6.8% for the Υ (1S) state, 1.6–6.6% for the Υ (2S)
state and 1.6–6.7% for the Υ (3S) state, depending on the kinematic bin.
The muon identification efficiency is determined from simulation and calibrated with
data using a tag-and-probe method. The single-muon identification efficiency is measured
in intervals of p, η and event multiplicity. The statistical uncertainty due to the finite size
of the calibration sample is propagated to the final results using pseudoexperiments. The
uncertainty related to the kinematic binning scheme of the calibration samples is studied
by changing the bin size. The uncertainty due to the kinematic correlations between the
JHEP07(2018)134
two muons, which is not considered in the efficiency calculation, is studied with simulated
samples. The correlation is found to be negligible except for the most forward region,
in which the two muons from the Υ decays have smaller opening angle. In total, the
systematic uncertainty assigned to the muon identification efficiency is 0.1–7.9% for the
Υ (1S) state, 0.1–7.6% for the Υ (2S) state and 0.2–8.5% for the Υ (3S) state, depending on
the kinematic bin.
The systematic uncertainty on the signal efficiency of the vertex fit quality requirement
is studied by comparing data and simulation. A relative difference of 0.2% is assigned for
the three Υ states.
The kinematic distributions of Υ mesons in simulation and in data are slightly different
within each kinematic bin due to the finite bin size in p
Tand y, causing differences in
efficiencies. This effect is studied by weighting the kinematic distributions of Υ states
in simulation to match the distributions in data. All efficiencies are recalculated, and
the relative differences of the total efficiency between the new and the nominal results are
assigned as systematic uncertainties, which vary between 0.0–1.1% for the Υ (1S) state, 0.0–
2.2% for the Υ (2S) state and 0.0–2.5% for the Υ (3S) state, depending on the kinematic bin.
A systematic uncertainty of 1.0% is assigned as a consequence of the limited precision
on the modelling of the final-state radiation in the simulation, estimated as in the previous
analysis [
20
].
The integrated luminosity is determined using the beam-gas imaging and van der
Meer scan methods [
44
]. A relative uncertainty of 3.9% is assigned on the luminosity and
propagated to the cross-sections.
5
Results
5.1
Cross-sections
The double-differential cross-sections multiplied by dimuon branching fractions for the
Υ (1S), Υ (2S) and Υ (3S) states are shown in figure
2
. The corresponding values are listed
in tables
2
–
4
. By integrating the double-differential results over p
T(y), the differential
cross-sections times dimuon branching fractions as functions of y (p
T) are shown in figure
3
for the three Υ states, with the theoretical predictions based on NRQCD [
24
] overlaid. The
NRQCD predictions are in agreement with the experimental data at high p
T.
The total cross-sections multiplied by dimuon branching fractions for the three states
integrated over the ranges of 0 < p
T< 15 GeV/c and 2.0 < y < 4.5 are measured to be
B(Υ (1S) → µ
+µ
−) × σ(Υ (1S), 0 < p
T< 15 GeV/c, 2 < y < 4.5) = 4687 ± 10 ± 294 pb,
B(Υ (2S) → µ
+µ
−) × σ(Υ (2S), 0 < p
T
< 15 GeV/c, 2 < y < 4.5) = 1134 ± 6 ± 71 pb,
B(Υ (3S) → µ
+µ
−) × σ(Υ (3S), 0 < p
T
< 15 GeV/c, 2 < y < 4.5) = 561 ± 4 ± 36 pb,
where the first uncertainty is statistical and the second is systematic. The corresponding
results as a function of pp centre-of-mass energy are shown in figure
4
.
In this paper, results are obtained under the assumption of zero polarisation. The
effects of possible Υ polarisation based on the LHCb measurements [
19
] in pp collisions at
JHEP07(2018)134
pT[GeV/c] 2.0 < y < 2.5 2.5 < y < 3.0 3.0 < y < 3.5 3.5 < y < 4.0 4.0 < y < 4.5 0–1 94.75 ± 2.44 ± 6.27 89.26 ± 1.65 ± 5.65 82.21 ± 1.65 ± 5.63 70.76 ± 1.55 ± 6.10 49.85 ± 1.74 ± 5.94 1–2 233.67 ± 3.83 ± 15.52 236.95 ± 2.72 ± 14.94 216.85 ± 2.61 ± 14.87 177.87 ± 2.47 ± 16.12 124.19 ± 2.68 ± 14.27 2–3 313.67 ± 4.40 ± 20.72 303.07 ± 3.14 ± 18.95 274.80 ± 2.89 ± 18.39 240.07 ± 2.88 ± 20.28 151.23 ± 2.94 ± 20.38 3–4 330.78 ± 4.51 ± 22.11 313.85 ± 3.22 ± 19.58 281.00 ± 2.90 ± 18.17 240.17 ± 2.84 ± 18.96 156.12 ± 3.04 ± 20.26 4–5 308.47 ± 4.36 ± 20.08 285.77 ± 3.09 ± 18.01 251.96 ± 2.70 ± 16.26 215.22 ± 2.71 ± 17.63 147.40 ± 3.00 ± 18.69 5–6 261.01 ± 4.05 ± 17.44 242.35 ± 2.86 ± 15.04 211.58 ± 2.50 ± 13.80 176.79 ± 2.43 ± 13.91 118.96 ± 2.68 ± 16.00 6–7 219.98 ± 3.74 ± 13.90 194.56 ± 2.51 ± 12.11 172.49 ± 2.20 ± 11.10 138.96 ± 2.16 ± 11.22 92.48 ± 2.41 ± 12.40 7–8 175.08 ± 3.34 ± 11.48 156.34 ± 2.18 ± 9.76 136.22 ± 1.90 ± 8.62 107.01 ± 1.87 ± 8.15 67.50 ± 2.05 ± 8.26 8–9 134.33 ± 2.86 ± 8.69 119.99 ± 1.86 ± 7.49 103.59 ± 1.58 ± 6.65 79.26 ± 1.57 ± 6.62 51.49 ± 1.85 ± 6.58 9–10 101.78 ± 2.46 ± 6.58 89.18 ± 1.54 ± 5.63 76.04 ± 1.34 ± 4.98 59.62 ± 1.33 ± 5.06 38.61 ± 1.59 ± 5.52 10–11 81.97 ± 2.14 ± 5.57 72.34 ± 1.34 ± 4.54 59.17 ± 1.16 ± 3.92 44.99 ± 1.13 ± 3.88 26.02 ± 1.30 ± 3.16 11–12 60.06 ± 1.78 ± 4.12 53.65 ± 1.14 ± 3.38 44.40 ± 0.99 ± 2.96 34.43 ± 0.97 ± 2.98 21.94 ± 1.17 ± 2.79 12–13 46.88 ± 1.54 ± 3.25 39.55 ± 0.98 ± 2.50 31.71 ± 0.83 ± 2.12 24.76 ± 0.82 ± 2.24 13.07 ± 0.93 ± 1.69 13–14 34.64 ± 1.30 ± 2.44 28.00 ± 0.79 ± 1.78 23.81 ± 0.71 ± 1.61 18.20 ± 0.70 ± 1.67 9.77 ± 0.53 ± 1.24 14–15 26.20 ± 1.10 ± 1.85 22.15 ± 0.68 ± 1.42 17.87 ± 0.61 ± 1.23 14.18 ± 0.60 ± 1.30 15–16 20.81 ± 0.97 ± 1.49 16.20 ± 0.58 ± 1.05 13.14 ± 0.51 ± 0.91 10.07 ± 0.51 ± 1.01 3.48 ± 0.20 ± 0.44 16–17 17.64 ± 0.87 ± 1.27 13.17 ± 0.53 ± 0.87 10.41 ± 0.46 ± 0.75 7.76 ± 0.46 ± 0.81 17–18 12.29 ± 0.65 ± 0.89 10.13 ± 0.45 ± 0.68 8.35 ± 0.41 ± 0.61 5.83 ± 0.39 ± 0.62 18–19 8.50 ± 0.53 ± 0.63 8.33 ± 0.42 ± 0.58 5.82 ± 0.35 ± 0.44 4.88 ± 0.37 ± 0.54 19–20 7.57 ± 0.50 ± 0.58 6.19 ± 0.34 ± 0.43 5.15 ± 0.32 ± 0.39 3.90 ± 0.31 ± 0.43 20–21 5.04 ± 0.29 ± 0.37 4.47 ± 0.21 ± 0.31 3.53 ± 0.18 ± 0.27 1.48 ± 0.09 ± 0.17 0.54 ± 0.06 ± 0.07 21–22 22–23 3.52 ± 0.24 ± 0.27 2.86 ± 0.17 ± 0.21 2.06 ± 0.14 ± 0.17 23–24 24–25 2.06 ± 0.17 ± 0.16 1.60 ± 0.12 ± 0.12 1.49 ± 0.12 ± 0.13 25–26 0.48 ± 0.05 ± 0.06 26–27 1.40 ± 0.10 ± 0.11 1.16 ± 0.10 ± 0.10 0.67 ± 0.06 ± 0.06 27–28 28–29 0.82 ± 0.09 ± 0.07 29–30Table 2. Double-differential cross-sections times dimuon branching fraction in different bins of pTand y for Υ (1S) (in pb). The first uncertainty is statistical and the second is systematic.
–
7
JHEP07(2018)134
pT[GeV/c] 2.0 < y < 2.5 2.5 < y < 3.0 3.0 < y < 3.5 3.5 < y < 4.0 4.0 < y < 4.5 0–1 19.09 ± 1.26 ± 1.29 17.48 ± 0.87 ± 1.11 16.64 ± 0.92 ± 1.14 14.71 ± 0.83 ± 1.26 8.43 ± 0.79 ± 1.02 1–2 51.52 ± 2.06 ± 3.43 47.02 ± 1.45 ± 2.96 40.56 ± 1.42 ± 2.77 36.04 ± 1.33 ± 3.25 25.69 ± 1.38 ± 3.04 2–3 65.75 ± 2.33 ± 4.33 58.61 ± 1.65 ± 3.66 57.16 ± 1.63 ± 3.85 47.30 ± 1.52 ± 4.04 31.50 ± 1.49 ± 4.31 3–4 71.64 ± 2.44 ± 4.76 66.47 ± 1.78 ± 4.14 62.67 ± 1.65 ± 4.06 53.90 ± 1.59 ± 4.38 30.28 ± 1.52 ± 4.01 4–5 68.54 ± 2.36 ± 4.43 64.62 ± 1.75 ± 4.06 57.78 ± 1.53 ± 3.72 48.37 ± 1.50 ± 4.04 35.79 ± 1.65 ± 4.62 5–6 61.05 ± 2.23 ± 4.05 61.03 ± 1.68 ± 3.78 52.15 ± 1.45 ± 3.39 41.41 ± 1.37 ± 3.31 29.36 ± 1.54 ± 3.96 6–7 59.77 ± 2.22 ± 3.78 49.55 ± 1.50 ± 3.08 43.04 ± 1.29 ± 2.76 36.43 ± 1.26 ± 2.98 23.17 ± 1.39 ± 3.17 7–8 46.04 ± 1.94 ± 3.03 42.95 ± 1.32 ± 2.68 37.01 ± 1.12 ± 2.34 29.84 ± 1.14 ± 2.33 19.00 ± 1.25 ± 2.35 8–9 37.33 ± 1.76 ± 2.43 34.72 ± 1.14 ± 2.16 29.41 ± 0.95 ± 1.88 23.17 ± 0.97 ± 1.99 14.44 ± 1.10 ± 1.91 9–10 30.18 ± 1.52 ± 1.98 27.93 ± 0.98 ± 1.76 23.81 ± 0.81 ± 1.57 19.29 ± 0.84 ± 1.64 10.82 ± 0.92 ± 1.57 10–11 23.97 ± 1.32 ± 1.66 21.65 ± 0.83 ± 1.37 18.12 ± 0.71 ± 1.20 14.81 ± 0.71 ± 1.27 10.55 ± 0.91 ± 1.33 11–12 19.99 ± 1.17 ± 1.41 16.51 ± 0.69 ± 1.04 14.06 ± 0.60 ± 0.94 10.44 ± 0.59 ± 0.93 6.32 ± 0.76 ± 0.81 12–13 16.85 ± 1.03 ± 1.19 14.30 ± 0.61 ± 0.90 10.38 ± 0.51 ± 0.71 8.30 ± 0.52 ± 0.75 4.46 ± 0.64 ± 0.57 13–14 12.67 ± 0.94 ± 0.92 10.57 ± 0.53 ± 0.67 7.96 ± 0.44 ± 0.54 6.55 ± 0.44 ± 0.62 4.16 ± 0.40 ± 0.53 14–15 9.61 ± 0.75 ± 0.71 8.29 ± 0.46 ± 0.53 7.27 ± 0.41 ± 0.51 5.07 ± 0.39 ± 0.47 15–16 7.93 ± 0.66 ± 0.58 6.76 ± 0.40 ± 0.44 5.58 ± 0.35 ± 0.39 3.43 ± 0.34 ± 0.35 1.55 ± 0.15 ± 0.19 16–17 5.82 ± 0.55 ± 0.43 4.85 ± 0.34 ± 0.32 4.14 ± 0.31 ± 0.30 2.39 ± 0.27 ± 0.25 17–18 4.77 ± 0.48 ± 0.37 3.43 ± 0.28 ± 0.23 3.26 ± 0.27 ± 0.24 2.44 ± 0.27 ± 0.27 18–19 4.07 ± 0.42 ± 0.31 3.53 ± 0.28 ± 0.24 2.38 ± 0.23 ± 0.18 1.64 ± 0.23 ± 0.18 19–20 3.84 ± 0.39 ± 0.31 2.88 ± 0.25 ± 0.20 1.95 ± 0.22 ± 0.15 1.58 ± 0.20 ± 0.19 20–21 2.05 ± 0.20 ± 0.16 1.89 ± 0.14 ± 0.13 1.65 ± 0.13 ± 0.13 0.83 ± 0.07 ± 0.09 0.27 ± 0.05 ± 0.04 21–22 22–23 1.77 ± 0.18 ± 0.14 1.10 ± 0.11 ± 0.08 0.78 ± 0.09 ± 0.06 23–24 24–25 0.85 ± 0.12 ± 0.07 0.78 ± 0.09 ± 0.06 0.63 ± 0.08 ± 0.05 25–26 0.30 ± 0.05 ± 0.04 26–27 0.47 ± 0.06 ± 0.04 0.61 ± 0.08 ± 0.05 0.31 ± 0.04 ± 0.03 27–28 28–29 0.49 ± 0.07 ± 0.04 29–30Table 3. Double-differential cross-sections times dimuon branching fraction in different bins of pTand y for Υ (2S) (in pb). The first uncertainty is statistical and the second is systematic.
–
8
JHEP07(2018)134
pT[GeV/c] 2.0 < y < 2.5 2.5 < y < 3.0 3.0 < y < 3.5 3.5 < y < 4.0 4.0 < y < 4.5 0–1 7.37 ± 0.91 ± 0.51 7.54 ± 0.66 ± 0.50 7.41 ± 0.78 ± 0.52 6.12 ± 0.64 ± 0.55 4.94 ± 0.67 ± 0.62 1–2 22.47 ± 1.58 ± 1.54 19.32 ± 1.10 ± 1.26 16.34 ± 1.13 ± 1.16 15.91 ± 1.05 ± 1.48 10.74 ± 0.96 ± 1.35 2–3 27.76 ± 1.75 ± 1.90 28.45 ± 1.32 ± 1.84 25.14 ± 1.32 ± 1.74 21.13 ± 1.21 ± 1.85 13.83 ± 1.12 ± 1.92 3–4 29.69 ± 1.81 ± 2.04 32.38 ± 1.42 ± 2.09 27.69 ± 1.31 ± 1.86 22.49 ± 1.24 ± 1.88 15.97 ± 1.22 ± 2.17 4–5 32.80 ± 1.85 ± 2.20 32.05 ± 1.42 ± 2.09 24.71 ± 1.19 ± 1.65 22.72 ± 1.19 ± 1.94 14.63 ± 1.21 ± 1.91 5–6 32.21 ± 1.81 ± 2.21 30.17 ± 1.34 ± 1.94 26.25 ± 1.16 ± 1.77 20.10 ± 1.10 ± 1.69 13.96 ± 1.18 ± 1.96 6–7 27.96 ± 1.74 ± 1.82 26.21 ± 1.23 ± 1.69 22.66 ± 1.06 ± 1.51 18.97 ± 1.03 ± 1.61 13.34 ± 1.16 ± 1.87 7–8 25.34 ± 1.62 ± 1.71 20.59 ± 1.05 ± 1.33 20.17 ± 0.90 ± 1.32 16.09 ± 0.93 ± 1.28 10.90 ± 1.05 ± 1.38 8–9 21.21 ± 1.45 ± 1.42 17.63 ± 0.92 ± 1.14 16.74 ± 0.78 ± 1.11 11.39 ± 0.77 ± 1.01 8.73 ± 0.96 ± 1.14 9–10 18.24 ± 1.27 ± 1.22 15.46 ± 0.81 ± 1.01 13.48 ± 0.67 ± 0.92 9.65 ± 0.65 ± 0.85 6.29 ± 0.86 ± 0.94 10–11 14.77 ± 1.17 ± 1.04 11.39 ± 0.67 ± 0.74 9.99 ± 0.57 ± 0.69 7.96 ± 0.57 ± 0.70 4.96 ± 0.69 ± 0.62 11–12 11.48 ± 0.99 ± 0.82 10.66 ± 0.59 ± 0.70 9.00 ± 0.52 ± 0.62 5.57 ± 0.46 ± 0.49 4.04 ± 0.69 ± 0.52 12–13 8.45 ± 0.84 ± 0.61 8.69 ± 0.53 ± 0.57 7.29 ± 0.44 ± 0.51 5.45 ± 0.43 ± 0.49 3.39 ± 0.59 ± 0.46 13–14 5.67 ± 0.69 ± 0.41 7.15 ± 0.45 ± 0.47 5.63 ± 0.38 ± 0.40 4.55 ± 0.40 ± 0.43 2.03 ± 0.32 ± 0.26 14–15 5.70 ± 0.64 ± 0.42 5.28 ± 0.38 ± 0.35 3.68 ± 0.31 ± 0.26 3.49 ± 0.35 ± 0.34 15–16 5.11 ± 0.57 ± 0.38 4.47 ± 0.35 ± 0.30 3.56 ± 0.30 ± 0.26 2.37 ± 0.29 ± 0.24 0.85 ± 0.14 ± 0.11 16–17 5.17 ± 0.53 ± 0.39 3.08 ± 0.29 ± 0.21 2.87 ± 0.27 ± 0.21 1.82 ± 0.25 ± 0.20 17–18 3.22 ± 0.44 ± 0.25 2.81 ± 0.26 ± 0.19 2.03 ± 0.23 ± 0.15 1.54 ± 0.23 ± 0.16 18–19 3.09 ± 0.38 ± 0.25 2.46 ± 0.24 ± 0.17 1.67 ± 0.21 ± 0.13 1.23 ± 0.22 ± 0.14 19–20 2.34 ± 0.33 ± 0.19 1.65 ± 0.19 ± 0.12 1.34 ± 0.19 ± 0.11 0.85 ± 0.16 ± 0.10 20–21 1.29 ± 0.17 ± 0.10 1.35 ± 0.12 ± 0.09 1.17 ± 0.11 ± 0.09 0.60 ± 0.06 ± 0.07 0.21 ± 0.05 ± 0.03 21–22 22–23 0.89 ± 0.14 ± 0.07 1.06 ± 0.11 ± 0.08 0.83 ± 0.10 ± 0.07 23–24 24–25 0.77 ± 0.11 ± 0.06 0.46 ± 0.07 ± 0.03 0.51 ± 0.07 ± 0.04 25–26 0.16 ± 0.04 ± 0.02 26–27 0.44 ± 0.06 ± 0.04 0.41 ± 0.07 ± 0.03 0.23 ± 0.04 ± 0.02 27–28 28–29 0.32 ± 0.06 ± 0.03 29–30Table 4. Double-differential cross-sections times dimuon branching fraction in different bins of pTand y for Υ (3S) (in pb). The first uncertainty is statistical and the second is systematic.
–
9
JHEP07(2018)134
]
c
)) [GeV/
S
(1
ϒ
(
Tp
0 10 20 30)]
c
[pb/(GeV/
B
×)
y
d
Tp
/(d
σ
2d
10−1 10 3 10 LHCb (a) < 2.5 y 2.0 < < 3.0 y 2.5 < < 3.5 y 3.0 < < 4.0 y 3.5 < < 4.5 y 4.0 <]
c
)) [GeV/
S
(2
ϒ
(
Tp
0 10 20 30)]
c
[pb/(GeV/
B
×)
y
d
Tp
/(d
σ
2d
1 − 10 1 10 2 10 LHCb (b) < 2.5 y 2.0 < < 3.0 y 2.5 < < 3.5 y 3.0 < < 4.0 y 3.5 < < 4.5 y 4.0 <]
c
)) [GeV/
S
(3
ϒ
(
Tp
0 10 20 30)]
c
[pb/(GeV/
B
×)
y
d
Tp
/(d
σ
2d
1 − 10 1 10 2 10 LHCb (c) < 2.5 y 2.0 < < 3.0 y 2.5 < < 3.5 y 3.0 < < 4.0 y 3.5 < < 4.5 y 4.0 <Figure 2. Double-differential cross-sections multiplied by dimuon branching fractions as a function of pTin intervals of y for the (a) Υ (1S), (b) Υ (2S) and (c) Υ (3S) mesons. Statistical and systematic uncertainties are added in quadrature.
JHEP07(2018)134
]
c
) [GeV/
ϒ
(
Tp
0 5 10 15)]
c
[pb/(GeV/
B
×
Tp
/d
σ
d
1 − 10 10 3 10 LHCb< 4.5
y
2.0 <
)
S
(1
ϒ
)
S
(2
ϒ
)
S
(3
ϒ
)
ϒ
(
y
2 2.5 3 3.5 4 4.5[pb/0.5]
B
×
y
/d
σ
d
3 10 4 100 <
p
T< 15 GeV/
c
LHCb)
S
(1
ϒ
)
S
(2
ϒ
)
S
(3
ϒ
Figure 3. Differential cross-sections multiplied by dimuon branching fractions for the Υ (1S) (black solid squares), Υ (2S) (red upward triangles) and Υ (3S) (blue downward triangles) states (top) versus pT integrated over y between 2.0 and 4.5 and (bottom) versus y integrated over pT from 0 to 15 GeV/c. Statistical and systematic uncertainties are added in quadrature. Predictions from NRQCD [24] for the Υ (1S) (black grid shading), Υ (2S) (red grid shading) and Υ (3S) (blue grid shading) states are overlaid in the top plot.
7 TeV and 8 TeV are studied. The measurements show no large transverse or longitudinal
polarisation over the accessible phase-space domain. The cross-sections increase up to 2.8%
for the three Υ states when assuming the transverse polarisation of α = 0.1, where α is the
polarisation parameter in the helicity frame [
45
].
5.2
Cross-section ratios
The ratios of the differential production cross-sections multiplied by dimuon branching
fractions between Υ (2S) and Υ (1S), R
2S/1S, and that between Υ (3S) and Υ (1S), R
3S/1S,
are shown in figure
5
.
In these ratios, the statistical uncertainties of the cross-sections and those due to the
finite size of the simulated samples are assumed to be uncorrelated. The systematic
uncer-tainties related to the signal yields and the efficiencies of the global event requirements, the
trigger and the tracking are assumed to be 100% correlated between the different states.
JHEP07(2018)134
[TeV]
s
0 5 10 15[pb]
ϒ
of
m
×
B
×
σ
0 2000 4000 6000 LHCb= 1
m
),
S
(1
ϒ
= 3
m
),
S
(2
ϒ
= 3
m
),
S
(3
ϒ
Figure 4. The production cross-sections multiplied by dimuon branching fractions integrated over 0 < pT < 15 GeV/c and 2.0 < y < 4.5 versus centre-of-mass energy of pp collisions for the Υ (1S) (black solid squares), Υ (2S) (red upward triangles) and Υ (3S) (blue downward triangles) states. Each set of measurements is offset by a multiplicative factor m, which is shown on the plot. Statistical and systematic uncertainties are added in quadrature.
] c ) [GeV/ ϒ ( T p 0 10 20 30 S /1 S 2 R 0 0.1 0.2 0.3 0.4 0.5 0.6 0.7 0.8 0.9 1 LHCb (a) < 2.5 y 2.0 < < 3.0 y 2.5 < < 3.5 y 3.0 < < 4.0 y 3.5 < < 4.5 y 4.0 < ] c ) [GeV/ ϒ ( T p 0 10 20 30 S /1 S 3 R 0 0.1 0.2 0.3 0.4 0.5 0.6 0.7 0.8 0.9 1 LHCb (b) < 2.5 y 2.0 < < 3.0 y 2.5 < < 3.5 y 3.0 < < 4.0 y 3.5 < < 4.5 y 4.0 < ] c ) [GeV/ ϒ ( T p 0 5 10 S /1 Si R 0 0.2 0.4 LHCb (c) < 4.5 y 2.0 < ) S (1 ϒ )/ S (2 ϒ ) S (1 ϒ )/ S (3 ϒ ) ϒ ( y 2 2.5 3 3.5 4 4.5 S /1 Si R 0 0.2 0.4 LHCb (d) c < 15 GeV/ T p 0 < ) S (1 ϒ )/ S (2 ϒ ) S (1 ϒ )/ S (3 ϒ
Figure 5. Ratios of double-differential cross-sections times dimuon branching fractions for (a) Υ (2S) to Υ (1S) and (b) Υ (3S) to Υ (1S). Ratios of differential cross-sections times dimuon branch-ing fractions (c) versus pT integrated over y and (d) versus y integrated over pT for Υ (2S) to Υ (1S) (black solid squares) and Υ (3S) to Υ (1S) (red upward triangles). Statistical and systematic uncertainties are added in quadrature.
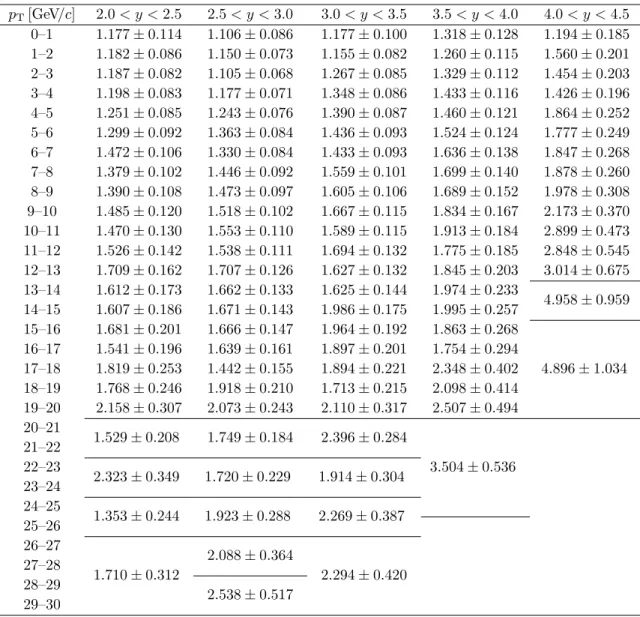
JHEP07(2018)134
The cross-sections times dimuon branching fractions measured at a centre-of-mass
energy of 13 TeV presented in this paper are compared with the measurements at 8 TeV [
18
].
The ratios of double-differential cross-sections between 13 TeV and 8 TeV measurements,
R
13/8, are shown in figure
6
. The corresponding values are listed in tables
5
–
7
. The
cross-section ratios between 13 TeV and 8 TeV versus p
Tintegrated over y, and versus y
integrated over p
Tare shown in figure
7
.
In the ratios, the systematic uncertainties originating from the fit model, global event
requirements and kinematic spectrum are assumed to be uncorrelated. Those from
trig-ger, muon identification, tracking correction and luminosity are partially correlated. The
systematic uncertainty from final-state radiation is assumed to be 100% correlated.
6
Conclusion
A study of the production of Υ (1S), Υ (2S) and Υ (3S) mesons in proton-proton collisions
at the centre-of-mass energy
√
s = 13 TeV is reported. The differential cross-sections times
dimuon branching fractions of Υ mesons are measured as functions of p
Tand y, in the
kinematic range 0 < p
T< 30 GeV/c and 2.0 < y < 4.5. The production cross-section
ratios of Υ (2S) and Υ (3S) mesons with respect to the Υ (1S) meson are given in intervals
of p
Tand y. The ratios of the production cross-sections with respect to those measured at
√
s = 8 TeV are also presented.
The results of differential cross-sections times dimuon branching fractions as a
func-tion of p
Tintegrated over y between 2.0 and 4.5 are compared with predictions based on
NRQCD. These predictions provide a good description of the experimental data at high
p
Tfor all the three Υ states.
Acknowledgments
We thank Kuang-Ta Chao, Yu Feng, Yan-Qing Ma, Hua-Sheng Shao and Jian-Xiong Wang
for frequent and interesting discussions on the production of Υ mesons. We express our
gratitude to our colleagues in the CERN accelerator departments for the excellent
per-formance of the LHC. We thank the technical and administrative staff at the LHCb
in-stitutes. We acknowledge support from CERN and from the national agencies: CAPES,
CNPq, FAPERJ and FINEP (Brazil); MOST and NSFC (China); CNRS/IN2P3 (France);
BMBF, DFG and MPG (Germany); INFN (Italy); NWO (The Netherlands); MNiSW and
NCN (Poland); MEN/IFA (Romania); MinES and FASO (Russia); MinECo (Spain); SNSF
and SER (Switzerland); NASU (Ukraine); STFC (United Kingdom); NSF (U.S.A.). We
acknowledge the computing resources that are provided by CERN, IN2P3 (France), KIT
and DESY (Germany), INFN (Italy), SURF (The Netherlands), PIC (Spain), GridPP
(United Kingdom), RRCKI and Yandex LLC (Russia), CSCS (Switzerland), IFIN-HH
(Romania), CBPF (Brazil), PL-GRID (Poland) and OSC (U.S.A.). We are indebted to
the communities behind the multiple open-source software packages on which we depend.
Individual groups or members have received support from AvH Foundation (Germany),
EPLANET, Marie Sk lodowska-Curie Actions and ERC (European Union), ANR, Labex
JHEP07(2018)134
pT[GeV/c] 2.0 < y < 2.5 2.5 < y < 3.0 3.0 < y < 3.5 3.5 < y < 4.0 4.0 < y < 4.5 0–1 1.231 ± 0.081 1.200 ± 0.071 1.257 ± 0.081 1.346 ± 0.109 1.578 ± 0.188 1–2 1.187 ± 0.072 1.256 ± 0.070 1.330 ± 0.082 1.354 ± 0.113 1.568 ± 0.174 2–3 1.256 ± 0.075 1.241 ± 0.069 1.325 ± 0.080 1.484 ± 0.114 1.575 ± 0.203 3–4 1.299 ± 0.078 1.282 ± 0.070 1.379 ± 0.080 1.512 ± 0.109 1.704 ± 0.211 4–5 1.345 ± 0.079 1.334 ± 0.074 1.420 ± 0.082 1.555 ± 0.116 1.919 ± 0.235 5–6 1.393 ± 0.085 1.368 ± 0.076 1.455 ± 0.085 1.616 ± 0.117 1.894 ± 0.245 6–7 1.484 ± 0.087 1.408 ± 0.078 1.540 ± 0.089 1.654 ± 0.124 1.993 ± 0.258 7–8 1.544 ± 0.095 1.483 ± 0.083 1.591 ± 0.091 1.700 ± 0.120 1.912 ± 0.231 8–9 1.566 ± 0.096 1.504 ± 0.086 1.649 ± 0.096 1.709 ± 0.133 2.171 ± 0.279 9–10 1.561 ± 0.098 1.484 ± 0.086 1.616 ± 0.098 1.822 ± 0.147 2.453 ± 0.353 10–11 1.633 ± 0.112 1.637 ± 0.097 1.723 ± 0.106 1.899 ± 0.160 2.592 ± 0.343 11–12 1.614 ± 0.112 1.644 ± 0.098 1.759 ± 0.113 1.941 ± 0.165 3.396 ± 0.476 12–13 1.702 ± 0.122 1.648 ± 0.102 1.752 ± 0.115 1.959 ± 0.179 2.712 ± 0.421 13–14 1.691 ± 0.130 1.540 ± 0.099 1.777 ± 0.123 2.026 ± 0.194 3.973 ± 0.589 14–15 1.660 ± 0.136 1.651 ± 0.109 1.812 ± 0.130 2.188 ± 0.217 15–16 1.763 ± 0.150 1.573 ± 0.110 1.805 ± 0.136 2.219 ± 0.243 4.978 ± 0.794 16–17 2.018 ± 0.174 1.790 ± 0.132 1.865 ± 0.151 2.168 ± 0.260 17–18 1.834 ± 0.170 1.790 ± 0.138 2.131 ± 0.183 2.332 ± 0.296 18–19 1.529 ± 0.150 1.984 ± 0.166 1.877 ± 0.180 2.679 ± 0.376 19–20 1.874 ± 0.197 1.854 ± 0.164 2.044 ± 0.205 2.598 ± 0.369 20–21 1.853 ± 0.176 1.912 ± 0.157 2.088 ± 0.196 2.865 ± 0.369 21–22 22–23 2.119 ± 0.230 2.071 ± 0.191 2.212 ± 0.244 23–24 24–25 1.664 ± 0.210 1.863 ± 0.216 2.652 ± 0.335 25–26 26–27 2.340 ± 0.274 2.059 ± 0.262 2.205 ± 0.289 27–28 28–29 2.096 ± 0.326 29–30Table 5. The cross-section ratios between 13 TeV and 8 TeV in different bins of pTand y for Υ (1S).
–
14
JHEP07(2018)134
pT[GeV/c] 2.0 < y < 2.5 2.5 < y < 3.0 3.0 < y < 3.5 3.5 < y < 4.0 4.0 < y < 4.5 0–1 1.177 ± 0.114 1.106 ± 0.086 1.177 ± 0.100 1.318 ± 0.128 1.194 ± 0.185 1–2 1.182 ± 0.086 1.150 ± 0.073 1.155 ± 0.082 1.260 ± 0.115 1.560 ± 0.201 2–3 1.187 ± 0.082 1.105 ± 0.068 1.267 ± 0.085 1.329 ± 0.112 1.454 ± 0.203 3–4 1.198 ± 0.083 1.177 ± 0.071 1.348 ± 0.086 1.433 ± 0.116 1.426 ± 0.196 4–5 1.251 ± 0.085 1.243 ± 0.076 1.390 ± 0.087 1.460 ± 0.121 1.864 ± 0.252 5–6 1.299 ± 0.092 1.363 ± 0.084 1.436 ± 0.093 1.524 ± 0.124 1.777 ± 0.249 6–7 1.472 ± 0.106 1.330 ± 0.084 1.433 ± 0.093 1.636 ± 0.138 1.847 ± 0.268 7–8 1.379 ± 0.102 1.446 ± 0.092 1.559 ± 0.101 1.699 ± 0.140 1.878 ± 0.260 8–9 1.390 ± 0.108 1.473 ± 0.097 1.605 ± 0.106 1.689 ± 0.152 1.978 ± 0.308 9–10 1.485 ± 0.120 1.518 ± 0.102 1.667 ± 0.115 1.834 ± 0.167 2.173 ± 0.370 10–11 1.470 ± 0.130 1.553 ± 0.110 1.589 ± 0.115 1.913 ± 0.184 2.899 ± 0.473 11–12 1.526 ± 0.142 1.538 ± 0.111 1.694 ± 0.132 1.775 ± 0.185 2.848 ± 0.545 12–13 1.709 ± 0.162 1.707 ± 0.126 1.627 ± 0.132 1.845 ± 0.203 3.014 ± 0.675 13–14 1.612 ± 0.173 1.662 ± 0.133 1.625 ± 0.144 1.974 ± 0.233 4.958 ± 0.959 14–15 1.607 ± 0.186 1.671 ± 0.143 1.986 ± 0.175 1.995 ± 0.257 15–16 1.681 ± 0.201 1.666 ± 0.147 1.964 ± 0.192 1.863 ± 0.268 4.896 ± 1.034 16–17 1.541 ± 0.196 1.639 ± 0.161 1.897 ± 0.201 1.754 ± 0.294 17–18 1.819 ± 0.253 1.442 ± 0.155 1.894 ± 0.221 2.348 ± 0.402 18–19 1.768 ± 0.246 1.918 ± 0.210 1.713 ± 0.215 2.098 ± 0.414 19–20 2.158 ± 0.307 2.073 ± 0.243 2.110 ± 0.317 2.507 ± 0.494 20–21 1.529 ± 0.208 1.749 ± 0.184 2.396 ± 0.284 3.504 ± 0.536 21–22 22–23 2.323 ± 0.349 1.720 ± 0.229 1.914 ± 0.304 23–24 24–25 1.353 ± 0.244 1.923 ± 0.288 2.269 ± 0.387 25–26 26–27 1.710 ± 0.312 2.088 ± 0.364 2.294 ± 0.420 27–28 28–29 2.538 ± 0.517 29–30Table 6. The cross-section ratios between 13 TeV and 8 TeV in different bins of pTand y for Υ (2S).
–
15
JHEP07(2018)134
pT[GeV/c] 2.0 < y < 2.5 2.5 < y < 3.0 3.0 < y < 3.5 3.5 < y < 4.0 4.0 < y < 4.5 0–1 1.117 ± 0.167 1.145 ± 0.126 1.362 ± 0.174 1.265 ± 0.173 1.681 ± 0.328 1–2 1.372 ± 0.135 1.143 ± 0.095 1.138 ± 0.109 1.364 ± 0.152 1.566 ± 0.251 2–3 1.294 ± 0.119 1.275 ± 0.096 1.389 ± 0.116 1.397 ± 0.139 1.399 ± 0.223 3–4 1.193 ± 0.107 1.349 ± 0.099 1.386 ± 0.108 1.409 ± 0.136 1.702 ± 0.264 4–5 1.443 ± 0.124 1.403 ± 0.103 1.299 ± 0.101 1.475 ± 0.141 1.633 ± 0.260 5–6 1.601 ± 0.139 1.477 ± 0.109 1.539 ± 0.118 1.514 ± 0.148 1.896 ± 0.308 6–7 1.495 ± 0.135 1.524 ± 0.115 1.539 ± 0.119 1.676 ± 0.165 2.131 ± 0.351 7–8 1.618 ± 0.149 1.376 ± 0.108 1.643 ± 0.125 1.680 ± 0.160 2.198 ± 0.355 8–9 1.593 ± 0.152 1.438 ± 0.116 1.704 ± 0.132 1.565 ± 0.169 2.494 ± 0.447 9–10 1.724 ± 0.170 1.607 ± 0.130 1.689 ± 0.138 1.609 ± 0.176 2.538 ± 0.533 10–11 1.797 ± 0.199 1.431 ± 0.125 1.566 ± 0.136 1.645 ± 0.186 2.253 ± 0.474 11–12 1.755 ± 0.210 1.687 ± 0.143 1.808 ± 0.166 1.610 ± 0.196 2.930 ± 0.689 12–13 1.451 ± 0.184 1.639 ± 0.146 1.870 ± 0.172 1.933 ± 0.239 3.684 ± 0.985 13–14 1.177 ± 0.174 1.727 ± 0.158 1.852 ± 0.189 2.167 ± 0.291 3.385 ± 0.851 14–15 1.478 ± 0.218 1.580 ± 0.163 1.574 ± 0.175 2.100 ± 0.311 15–16 1.680 ± 0.245 1.848 ± 0.199 1.980 ± 0.231 1.941 ± 0.328 4.640 ± 1.254 16–17 2.348 ± 0.337 1.587 ± 0.189 1.888 ± 0.232 2.167 ± 0.419 17–18 1.809 ± 0.315 1.824 ± 0.227 1.827 ± 0.262 1.913 ± 0.377 18–19 1.958 ± 0.319 2.109 ± 0.274 1.937 ± 0.304 1.977 ± 0.460 19–20 1.987 ± 0.357 1.696 ± 0.244 2.075 ± 0.369 2.116 ± 0.536 20–21 1.532 ± 0.254 1.846 ± 0.234 2.536 ± 0.348 3.255 ± 0.582 21–22 22–23 1.744 ± 0.346 2.294 ± 0.313 2.580 ± 0.412 23–24 24–25 2.257 ± 0.466 1.510 ± 0.285 2.408 ± 0.461 25–26 26–27 1.700 ± 0.316 2.215 ± 0.459 2.339 ± 0.495 27–28 28–29 2.629 ± 0.654 29–30Table 7. The cross-section ratios between 13 TeV and 8 TeV in different bins of pTand y for Υ (3S).
–
16
JHEP07(2018)134
]
c
)) [GeV/
S
(1
ϒ
(
Tp
0 10 20 30 13/8R
0 5 LHCb (a) < 2.5 y 2.0 < < 3.0 y 2.5 < < 3.5 y 3.0 < < 4.0 y 3.5 < < 4.5 y 4.0 <]
c
)) [GeV/
S
(2
ϒ
(
Tp
0 10 20 30 13/8R
0 5 LHCb (b) < 2.5 y 2.0 < < 3.0 y 2.5 < < 3.5 y 3.0 < < 4.0 y 3.5 < < 4.5 y 4.0 <]
c
)) [GeV/
S
(3
ϒ
(
Tp
0 10 20 30 13/8R
0 5 LHCb (c) < 2.5 y 2.0 < < 3.0 y 2.5 < < 3.5 y 3.0 < < 4.0 y 3.5 < < 4.5 y 4.0 <Figure 6. Ratios of double-differential cross-sections between 13 TeV and 8 TeV measurements versus pT in intervals of y for the (a) Υ (1S), (b) Υ (2S) and (c) Υ (3S) states. Statistical and systematic uncertainties are added in quadrature.
JHEP07(2018)134
]
c
) [GeV/
ϒ
(
Tp
0 5 10 13/8R
1 2 3 LHCb2.0 <
y
< 4.5
)
S
(1
ϒ
)
S
(2
ϒ
)
S
(3
ϒ
)
ϒ
(
y
2 2.5 3 3.5 4 4.5 13/8R
1 2 3 LHCb< 15 GeV/
c
Tp
0 <
)
S
(1
ϒ
)
S
(2
ϒ
)
S
(3
ϒ
Figure 7. Ratios of differential cross-sections between 13 TeV and 8 TeV measurements (top) versus pT integrated over y and (bottom) versus y integrated over pT for the Υ (1S) (black solid squares), Υ (2S) (red upward triangles) and Υ (3S) (blue downward triangles) states. Statistical and systematic uncertainties are added in quadrature.
P2IO and OCEVU, and R´
egion Auvergne-Rhˆ
one-Alpes (France), Key Research Program of
Frontier Sciences of CAS, CAS PIFI, and the Thousand Talents Program (China), RFBR,
RSF and Yandex LLC (Russia), GVA, XuntaGal and GENCAT (Spain), Herchel Smith
Fund, the Royal Society, the English-Speaking Union and the Leverhulme Trust (United
Kingdom).
Open Access.
This article is distributed under the terms of the Creative Commons
Attribution License (
CC-BY 4.0
), which permits any use, distribution and reproduction in
any medium, provided the original author(s) and source are credited.
References
[1] C.E. Carlson and R. Suaya, Hadronic Production of ψ/J Mesons,Phys. Rev. D 14 (1976)
3115[INSPIRE].
[2] A. Donnachie and P.V. Landshoff, Production of Lepton Pairs, J/Ψ and Charm with Hadron Beams,Nucl. Phys. B 112 (1976) 233[INSPIRE].
JHEP07(2018)134
[3] S.D. Ellis, M.B. Einhorn and C. Quigg, Comment on Hadronic Production of Psions,Phys.Rev. Lett. 36 (1976) 1263[INSPIRE].
[4] H. Fritzsch, Producing Heavy Quark Flavors in Hadronic Collisions: A Test of Quantum Chromodynamics,Phys. Lett. B 67 (1977) 217[INSPIRE].
[5] M. Gluck, J.F. Owens and E. Reya, Gluon Contribution to Hadronic J/ψ Production,Phys. Rev. D 17 (1978) 2324[INSPIRE].
[6] C.-H. Chang, Hadronic Production of J/ψ Associated With a Gluon,Nucl. Phys. B 172 (1980) 425[INSPIRE].
[7] R. Baier and R. Ruckl, Hadronic Production of J/ψ and Υ: Transverse Momentum Distributions,Phys. Lett. B 102 (1981) 364[INSPIRE].
[8] G.T. Bodwin, E. Braaten and G.P. Lepage, Rigorous QCD analysis of inclusive annihilation and production of heavy quarkonium,Phys. Rev. D 51 (1995) 1125[Erratum ibid. D 55 (1997) 5853] [hep-ph/9407339] [INSPIRE].
[9] P.L. Cho and A.K. Leibovich, Color octet quarkonia production,Phys. Rev. D 53 (1996) 150
[hep-ph/9505329] [INSPIRE].
[10] P.L. Cho and A.K. Leibovich, Color-octet quarkonia production. II,Phys. Rev. D 53 (1996) 6203[hep-ph/9511315] [INSPIRE].
[11] ATLAS collaboration, Measurement of the Υ(1S) production cross-section in pp collisions at √
s = 7 TeV in ATLAS,Phys. Lett. B 705 (2011) 9[arXiv:1106.5325] [INSPIRE].
[12] ATLAS collaboration, Measurement of upsilon production in 7 TeV pp collisions at ATLAS,
Phys. Rev. D 87 (2013) 052004[arXiv:1211.7255] [INSPIRE].
[13] CMS collaboration, Measurement of the Υ(1S), Υ(2S) and Υ(3S) cross sections in pp collisions at √s = 7 TeV,Phys. Lett. B 727 (2013) 101[arXiv:1303.5900] [INSPIRE]. [14] CMS collaboration, Measurement of quarkonium production cross sections in pp collisions at√
s = 13 TeV,Phys. Lett. B 780 (2018) 251[arXiv:1710.11002] [INSPIRE].
[15] LHCb collaboration, Measurement of Υ production in pp collisions at √s = 2.76 TeV,Eur. Phys. J. C 74 (2014) 2835[arXiv:1402.2539] [INSPIRE].
[16] LHCb collaboration, Measurement of Υ production in pp collisions at √s = 7 TeV,Eur. Phys. J. C 72 (2012) 2025[arXiv:1202.6579] [INSPIRE].
[17] LHCb collaboration, Measurement of the exclusive Υ production cross-section in pp collisions at√s = 7 TeV and 8 TeV,JHEP 09 (2015) 084[arXiv:1505.08139] [INSPIRE].
[18] LHCb collaboration, Forward production of Υ mesons in pp collisions at √s = 7 and 8 TeV,
JHEP 11 (2015) 103[arXiv:1509.02372] [INSPIRE].
[19] LHCb collaboration, Measurement of the Υ(nS) polarizations in pp collisions at√s = 7 and 8 TeV,JHEP 12 (2017) 110[arXiv:1709.01301] [INSPIRE].
[20] LHCb collaboration, Production of J/ψ and Υ mesons in pp collisions at √s = 8 TeV,JHEP 06 (2013) 064[arXiv:1304.6977] [INSPIRE].
[21] H. Han, Y.-Q. Ma, C. Meng, H.-S. Shao, Y.-J. Zhang and K.-T. Chao, Υ(nS) and χb(nP ) production at hadron colliders in nonrelativistic QCD,Phys. Rev. D 94 (2016) 014028
[arXiv:1410.8537] [INSPIRE].
JHEP07(2018)134
[22] L.S. Kisslinger and D. Das, Ψ and Υ Production In pp Collisions at 7.0 TeV,Mod. Phys.Lett. A 28 (2013) 1350120[arXiv:1306.6616] [INSPIRE].
[23] L.S. Kisslinger and D. Das, Ψ and Υ Production In pp Collisions at 8.0 TeV,Mod. Phys. Lett. A 29 (2014) 1450082[arXiv:1403.2271] [INSPIRE].
[24] Y. Feng, B. Gong, L.-P. Wan and J.-X. Wang, An updated study of Υ production and
polarization at the Tevatron and LHC,Chin. Phys. C 39 (2015) 123102[arXiv:1503.08439]
[INSPIRE].
[25] LHCb collaboration, The LHCb Detector at the LHC,2008 JINST 3 S08005[INSPIRE]. [26] LHCb collaboration, LHCb Detector Performance, Int. J. Mod. Phys. A 30 (2015) 1530022
[arXiv:1412.6352] [INSPIRE].
[27] R. Aaij et al., Performance of the LHCb Vertex Locator,2014 JINST 9 P09007
[arXiv:1405.7808] [INSPIRE].
[28] R. Arink et al., Performance of the LHCb Outer Tracker,2014 JINST 9 P01002
[arXiv:1311.3893] [INSPIRE].
[29] M. Adinolfi et al., Performance of the LHCb RICH detector at the LHC, Eur. Phys. J. C 73 (2013) 2431[arXiv:1211.6759] [INSPIRE].
[30] A.A. Alves Jr. et al., Performance of the LHCb muon system,2013 JINST 8 P02022
[arXiv:1211.1346] [INSPIRE].
[31] R. Aaij et al., The LHCb Trigger and its Performance in 2011, 2013 JINST 8 P04022
[arXiv:1211.3055] [INSPIRE].
[32] W.D. Hulsbergen, Decay chain fitting with a Kalman filter,Nucl. Instrum. Meth. A 552 (2005) 566[physics/0503191] [INSPIRE].
[33] G. Dujany and B. Storaci, Real-time alignment and calibration of the LHCb Detector in Run II,J. Phys. Conf. Ser. 664 (2015) 082010 [INSPIRE].
[34] R. Aaij et al., Tesla: an application for real-time data analysis in High Energy Physics,
Comput. Phys. Commun. 208 (2016) 35[arXiv:1604.05596] [INSPIRE].
[35] T. Sj¨ostrand, S. Mrenna and P.Z. Skands, A Brief Introduction to PYTHIA 8.1,Comput. Phys. Commun. 178 (2008) 852[arXiv:0710.3820] [INSPIRE].
[36] LHCb collaboration, Handling of the generation of primary events in Gauss, the LHCb simulation framework,J. Phys. Conf. Ser. 331 (2011) 032047[INSPIRE].
[37] D.J. Lange, The EvtGen particle decay simulation package, Nucl. Instrum. Meth. A 462 (2001) 152[INSPIRE].
[38] P. Golonka and Z. Was, PHOTOS Monte Carlo: A Precision tool for QED corrections in Z and W decays,Eur. Phys. J. C 45 (2006) 97[hep-ph/0506026] [INSPIRE].
[39] Geant4 collaboration, J. Allison et al., Geant4 developments and applications, IEEE Trans. Nucl. Sci. 53 (2006) 270[INSPIRE].
[40] T. Skwarnicki, A study of the radiative CASCADE transitions between the Upsilon-Prime and Upsilon resonances, Ph.D. Thesis, Institute of Nuclear Physics, Krakow Poland (1986), DESY-F31-86-02 [INSPIRE].
[41] Particle Data Group collaboration, C. Patrignani et al., Review of Particle Physics,
Chin. Phys. C 40 (2016) 100001[INSPIRE].
JHEP07(2018)134
[42] LHCb collaboration, Measurement of the track reconstruction efficiency at LHCb,2015JINST 10 P02007[arXiv:1408.1251] [INSPIRE].
[43] LHCb collaboration, Measurement of the b-quark production cross-section in 7 and 13 TeV pp collisions,Phys. Rev. Lett. 118 (2017) 052002[Erratum ibid. 119 (2017) 169901]
[arXiv:1612.05140] [INSPIRE].
[44] LHCb collaboration, Precision luminosity measurements at LHCb,2014 JINST 9 P12005
[arXiv:1410.0149] [INSPIRE].
[45] M. Jacob and G.C. Wick, On the general theory of collisions for particles with spin,Annals Phys. 7 (1959) 404[INSPIRE].
JHEP07(2018)134
The LHCb collaboration
R. Aaij43, B. Adeva39, M. Adinolfi48, Z. Ajaltouni5, S. Akar59, J. Albrecht10, F. Alessio40, M. Alexander53, A. Alfonso Albero38, S. Ali43, G. Alkhazov31, P. Alvarez Cartelle55,
A.A. Alves Jr59, S. Amato2, S. Amerio23, Y. Amhis7, L. An3, L. Anderlini18, G. Andreassi41, M. Andreotti17,g, J.E. Andrews60, R.B. Appleby56, F. Archilli43, P. d’Argent12, J. Arnau Romeu6, A. Artamonov37, M. Artuso61, E. Aslanides6, M. Atzeni42, G. Auriemma26, S. Bachmann12, J.J. Back50, C. Baesso62, S. Baker55, V. Balagura7,b, W. Baldini17, A. Baranov35, R.J. Barlow56, S. Barsuk7, W. Barter56, F. Baryshnikov32, V. Batozskaya29, V. Battista41, A. Bay41,
J. Beddow53, F. Bedeschi24, I. Bediaga1, A. Beiter61, L.J. Bel43, N. Beliy63, V. Bellee41, N. Belloli21,i, K. Belous37, I. Belyaev32,40, E. Ben-Haim8, G. Bencivenni19, S. Benson43, S. Beranek9, A. Berezhnoy33, R. Bernet42, D. Berninghoff12, E. Bertholet8, A. Bertolin23, C. Betancourt42, F. Betti15,40, M.O. Bettler49, M. van Beuzekom43, Ia. Bezshyiko42, S. Bifani47, P. Billoir8, A. Birnkraut10, A. Bizzeti18,u, M. Bjørn57, T. Blake50, F. Blanc41, S. Blusk61, V. Bocci26, T. Boettcher58, A. Bondar36,w, N. Bondar31, S. Borghi56,40, M. Borisyak35,
M. Borsato39, F. Bossu7, M. Boubdir9, T.J.V. Bowcock54, E. Bowen42, C. Bozzi17,40, S. Braun12, M. Brodski40, J. Brodzicka27, D. Brundu16, E. Buchanan48, C. Burr56, A. Bursche16,
J. Buytaert40, W. Byczynski40, S. Cadeddu16, H. Cai64, R. Calabrese17,g, R. Calladine47, M. Calvi21,i, M. Calvo Gomez38,m, A. Camboni38,m, P. Campana19, D.H. Campora Perez40, L. Capriotti56, A. Carbone15,e, G. Carboni25, R. Cardinale20,h, A. Cardini16, P. Carniti21,i, L. Carson52, K. Carvalho Akiba2, G. Casse54, L. Cassina21, M. Cattaneo40, G. Cavallero20,h, R. Cenci24,t, D. Chamont7, M.G. Chapman48, M. Charles8, Ph. Charpentier40,
G. Chatzikonstantinidis47, M. Chefdeville4, S. Chen16, S.-G. Chitic40, V. Chobanova39,
M. Chrzaszcz40, A. Chubykin31, P. Ciambrone19, X. Cid Vidal39, G. Ciezarek40, P.E.L. Clarke52, M. Clemencic40, H.V. Cliff49, J. Closier40, V. Coco40, J. Cogan6, E. Cogneras5, V. Cogoni16,f, L. Cojocariu30, P. Collins40, T. Colombo40, A. Comerma-Montells12, A. Contu16, G. Coombs40, S. Coquereau38, G. Corti40, M. Corvo17,g, C.M. Costa Sobral50, B. Couturier40, G.A. Cowan52, D.C. Craik58, A. Crocombe50, M. Cruz Torres1, R. Currie52, C. D’Ambrosio40,
F. Da Cunha Marinho2, C.L. Da Silva73, E. Dall’Occo43, J. Dalseno48, A. Davis3,
O. De Aguiar Francisco40, K. De Bruyn40, S. De Capua56, M. De Cian12, J.M. De Miranda1, L. De Paula2, M. De Serio14,d, P. De Simone19, C.T. Dean53, D. Decamp4, L. Del Buono8, B. Delaney49, H.-P. Dembinski11, M. Demmer10, A. Dendek28, D. Derkach35, O. Deschamps5, F. Dettori54, B. Dey65, A. Di Canto40, P. Di Nezza19, S. Didenko69, H. Dijkstra40, F. Dordei40, M. Dorigo40, A. Dosil Su´arez39, L. Douglas53, A. Dovbnya45, K. Dreimanis54, L. Dufour43, G. Dujany8, P. Durante40, J.M. Durham73, D. Dutta56, R. Dzhelyadin37, M. Dziewiecki12, A. Dziurda40, A. Dzyuba31, S. Easo51, U. Egede55, V. Egorychev32, S. Eidelman36,w,
S. Eisenhardt52, U. Eitschberger10, R. Ekelhof10, L. Eklund53, S. Ely61, A. Ene30, S. Escher9, S. Esen12, H.M. Evans49, T. Evans57, A. Falabella15, N. Farley47, S. Farry54, D. Fazzini21,40,i, L. Federici25, G. Fernandez38, P. Fernandez Declara40, A. Fernandez Prieto39, F. Ferrari15, L. Ferreira Lopes41, F. Ferreira Rodrigues2, M. Ferro-Luzzi40, S. Filippov34, R.A. Fini14, M. Fiorini17,g, M. Firlej28, C. Fitzpatrick41, T. Fiutowski28, F. Fleuret7,b, M. Fontana16,40, F. Fontanelli20,h, R. Forty40, V. Franco Lima54, M. Frank40, C. Frei40, J. Fu22,q, W. Funk40, C. F¨arber40, E. Gabriel52, A. Gallas Torreira39, D. Galli15,e, S. Gallorini23, S. Gambetta52, M. Gandelman2, P. Gandini22, Y. Gao3, L.M. Garcia Martin71, J. Garc´ıa Pardi˜nas39,
J. Garra Tico49, L. Garrido38, D. Gascon38, C. Gaspar40, L. Gavardi10, G. Gazzoni5, D. Gerick12, E. Gersabeck56, M. Gersabeck56, T. Gershon50, Ph. Ghez4, S. Gian`ı41, V. Gibson49,
O.G. Girard41, L. Giubega30, K. Gizdov52, V.V. Gligorov8, D. Golubkov32, A. Golutvin55,69, A. Gomes1,a, I.V. Gorelov33, C. Gotti21,i, E. Govorkova43, J.P. Grabowski12, R. Graciani Diaz38,
JHEP07(2018)134
L.A. Granado Cardoso40, E. Graug´es38, E. Graverini42, G. Graziani18, A. Grecu30, R. Greim43,P. Griffith16, L. Grillo56, L. Gruber40, B.R. Gruberg Cazon57, O. Gr¨unberg67, E. Gushchin34, Yu. Guz37, T. Gys40, C. G¨obel62, T. Hadavizadeh57, C. Hadjivasiliou5, G. Haefeli41, C. Haen40, S.C. Haines49, B. Hamilton60, X. Han12, T.H. Hancock57, S. Hansmann-Menzemer12,
N. Harnew57, S.T. Harnew48, C. Hasse40, M. Hatch40, J. He63, M. Hecker55, K. Heinicke10, A. Heister9, K. Hennessy54, L. Henry71, E. van Herwijnen40, M. Heß67, A. Hicheur2, D. Hill57, P.H. Hopchev41, W. Hu65, W. Huang63, Z.C. Huard59, W. Hulsbergen43, T. Humair55,
M. Hushchyn35, D. Hutchcroft54, P. Ibis10, M. Idzik28, P. Ilten47, R. Jacobsson40, J. Jalocha57, E. Jans43, A. Jawahery60, F. Jiang3, M. John57, D. Johnson40, C.R. Jones49, C. Joram40, B. Jost40, N. Jurik57, S. Kandybei45, M. Karacson40, J.M. Kariuki48, S. Karodia53, N. Kazeev35, M. Kecke12, F. Keizer49, M. Kelsey61, M. Kenzie49, T. Ketel44, E. Khairullin35, B. Khanji12, C. Khurewathanakul41, K.E. Kim61, T. Kirn9, S. Klaver19, K. Klimaszewski29, T. Klimkovich11, S. Koliiev46, M. Kolpin12, R. Kopecna12, P. Koppenburg43, S. Kotriakhova31, M. Kozeiha5, L. Kravchuk34, M. Kreps50, F. Kress55, P. Krokovny36,w, W. Krupa28, W. Krzemien29,
W. Kucewicz27,l, M. Kucharczyk27, V. Kudryavtsev36,w, A.K. Kuonen41, T. Kvaratskheliya32,40, D. Lacarrere40, G. Lafferty56, A. Lai16, G. Lanfranchi19, C. Langenbruch9, T. Latham50,
C. Lazzeroni47, R. Le Gac6, A. Leflat33,40, J. Lefran¸cois7, R. Lef`evre5, F. Lemaitre40, O. Leroy6, T. Lesiak27, B. Leverington12, P.-R. Li63, T. Li3, Y. Li7, Z. Li61, X. Liang61, T. Likhomanenko68, R. Lindner40, F. Lionetto42, V. Lisovskyi7, X. Liu3, D. Loh50, A. Loi16, I. Longstaff53,
J.H. Lopes2, D. Lucchesi23,o, M. Lucio Martinez39, A. Lupato23, E. Luppi17,g, O. Lupton40, A. Lusiani24, X. Lyu63, F. Machefert7, F. Maciuc30, V. Macko41, P. Mackowiak10,
S. Maddrell-Mander48, O. Maev31,40, K. Maguire56, D. Maisuzenko31, M.W. Majewski28, S. Malde57, B. Malecki27, A. Malinin68, T. Maltsev36,w, G. Manca16,f, G. Mancinelli6, D. Marangotto22,q, J. Maratas5,v, J.F. Marchand4, U. Marconi15, C. Marin Benito38, M. Marinangeli41, P. Marino41, J. Marks12, G. Martellotti26, M. Martin6, M. Martinelli41, D. Martinez Santos39, F. Martinez Vidal71, A. Massafferri1, R. Matev40, A. Mathad50, Z. Mathe40, C. Matteuzzi21, A. Mauri42, E. Maurice7,b, B. Maurin41, A. Mazurov47, M. McCann55,40, A. McNab56, R. McNulty13, J.V. Mead54, B. Meadows59, C. Meaux6, F. Meier10, N. Meinert67, D. Melnychuk29, M. Merk43, A. Merli22,q, E. Michielin23, D.A. Milanes66, E. Millard50, M.-N. Minard4, L. Minzoni17,g, D.S. Mitzel12, A. Mogini8, J. Molina Rodriguez1,y, T. Momb¨acher10, I.A. Monroy66, S. Monteil5, M. Morandin23, G. Morello19, M.J. Morello24,t, O. Morgunova68, J. Moron28, A.B. Morris6, R. Mountain61, F. Muheim52, M. Mulder43, D. M¨uller40, J. M¨uller10, K. M¨uller42, V. M¨uller10, P. Naik48,
T. Nakada41, R. Nandakumar51, A. Nandi57, I. Nasteva2, M. Needham52, N. Neri22, S. Neubert12, N. Neufeld40, M. Neuner12, T.D. Nguyen41, C. Nguyen-Mau41,n, S. Nieswand9, R. Niet10,
N. Nikitin33, A. Nogay68, D.P. O’Hanlon15, A. Oblakowska-Mucha28, V. Obraztsov37, S. Ogilvy19, R. Oldeman16,f, C.J.G. Onderwater72, A. Ossowska27, J.M. Otalora Goicochea2, P. Owen42, A. Oyanguren71, P.R. Pais41, A. Palano14, M. Palutan19,40, G. Panshin70, A. Papanestis51, M. Pappagallo52, L.L. Pappalardo17,g, W. Parker60, C. Parkes56, G. Passaleva18,40, A. Pastore14, M. Patel55, C. Patrignani15,e, A. Pearce40, A. Pellegrino43, G. Penso26, M. Pepe Altarelli40, S. Perazzini40, D. Pereima32, P. Perret5, L. Pescatore41, K. Petridis48, A. Petrolini20,h,
A. Petrov68, M. Petruzzo22,q, B. Pietrzyk4, G. Pietrzyk41, M. Pikies27, D. Pinci26, F. Pisani40, A. Pistone20,h, A. Piucci12, V. Placinta30, S. Playfer52, M. Plo Casasus39, F. Polci8,
M. Poli Lener19, A. Poluektov50, N. Polukhina69, I. Polyakov61, E. Polycarpo2, G.J. Pomery48, S. Ponce40, A. Popov37, D. Popov11,40, S. Poslavskii37, C. Potterat2, E. Price48, J. Prisciandaro39, C. Prouve48, V. Pugatch46, A. Puig Navarro42, H. Pullen57, G. Punzi24,p, W. Qian63, J. Qin63, R. Quagliani8, B. Quintana5, B. Rachwal28, J.H. Rademacker48, M. Rama24, M. Ramos Pernas39, M.S. Rangel2, I. Raniuk45,†, F. Ratnikov35,x, G. Raven44, M. Ravonel Salzgeber40, M. Reboud4,