Orbitally Forced Hyperstrati
fication of the Oligocene
South Atlantic Ocean
Diederik Liebrand1,2 , Isabella Raffi3 , Ángela Fraguas4 , Rémi Laxenaire5 ,
Joyce H. C. Bosmans6 , Frederik J. Hilgen7 , Paul A. Wilson1 , Sietske J. Batenburg8 , Helen M. Beddow7 , Steven M. Bohaty1 , Paul R. Bown9 , Anya J. Crocker1,10 , Claire E. Huck1 , Lucas J. Lourens7 , and Luciana Sabia11
1
National Oceanography Centre Southampton, University of Southampton, Southampton, UK,2MARUM - Center for Marine Environmental Science, University of Bremen, Bremen, Germany,3Dipartimento di Ingegneria e Geologia (InGeo),
Università degli Studi“G. d’Annunzio” di Chieti–Pescara, Chieti Scalo, Italy,4Paleontology Department, University Complutense of Madrid, Madrid, Spain,5Laboratoire de Météorologie Dynamique, École Polytechnique, ENS, CNRS, Paris,
France,6Department of Physical Geography, Faculty of Geosciences, Utrecht University, Utrecht, The Netherlands,
7Department of Earth Sciences, Faculty of Geosciences, Utrecht University, Utrecht, The Netherlands,8Department of Earth
Sciences, University of Oxford, Oxford, UK,9Department of Earth Sciences, University College London, London, UK,
10Department of Animal and Plant Science, University of Sheffield, Sheffield, UK,11Department of Science and
Technologies, University of Naples“Parthenope”, Naples, Italy
Abstract
Pelagic sediments from the subtropical South Atlantic Ocean contain geographically extensive Oligocene ooze and chalk layers that consist almost entirely of the calcareous nannofossil Braarudosphaera. Poor recovery and the lack of precise dating of these horizons in previous studies has limited theunderstanding of the number of acmes, their timing and durations, and therefore their likely cause. Here we present a high-resolution, astronomically tuned stratigraphy of Braarudosphaera oozes (29.5–27.9 Ma) from Ocean Drilling Program Site 1264 in the southeastern Atlantic Ocean. We identify seven episodes with highly abundant Braarudosphaera. Four of these acme events coincide with maxima and three with minima in the ~110 and 405-kyr paced eccentricity cycles. The longest lasting acme event corresponds to a pronounced minimum in the ~2.4-Myr eccentricity cycle. In the modern ocean, Braarudosphaera occurrences are limited to shallow marine and neritic settings, and the calcified coccospheres of Braarudosphaera are probably produced during a resting stage in the algal life cycle. Therefore, we hypothesize that the Oligocene acmes point to extensive and episodic (hyper) stratified surface water conditions, with a shallow pycnocline that may have served as a virtual seafloor and (partially/temporarily) prevented the coccospheres from sinking in the pelagic realm. We speculate that hyperstratification was either extended across large areas of the South Atlantic basin, through the formation of relatively hyposaline surface waters, or eddy contained through strong isopycnals at the base of eddies. Astronomical forcing of atmospheric and/or oceanic circulation could have triggered these conditions through either sustained rainfall over the open ocean and adjacent land masses or increased Agulhas Leakage.
Plain Language Summary
Sediment cores recovered from the South Atlantic Ocean contain several decimeter-thick chalk layers. Scientific study of these recurrent chalk layers shows that 28.5 million years ago an enigmatic alga named Braarudosphaera proliferated in the surface ocean of the subtropical South Atlantic. In the modern day these algae only live in coastal waters, and their presence in the middle of the South Atlantic Ocean (far away from coasts) is a puzzle that oceanographers have attempted to solve for decades. We show that these algal blooms recurred when Earth’s orbit changed seasonal conditions. We suggest that stratification of the South Atlantic surface Ocean in the geological past could have resulted in a density barrier (a“virtual” seafloor) that largely prevented these coastal algae from sinking. This would have enabled their widespread blooms and chalk formation in the open ocean. We speculate that either monsoons or eddies caused regional or local stratification. More research is needed into the life cycle of Braarudosphaera to fully determine whether these microfossil remains indeed signify stratification.1. Introduction
Mid-Oligocene (~30–27 Ma) strata from the subtropical South Atlantic Ocean contain geographically exten-sive ooze and chalk layers that are composed of the calcareous nannofossil Braarudosphaera. These
RESEARCH ARTICLE
10.1002/2017PA003222 Diederik Liebrand and Isabella Raffi contributed equally to this study.
Key Points:
• Seven astronomically forced open ocean Braarudosphaera acmes occurred during the mid-Oligocene in the subtropical South Atlantic Ocean • The exact paleoecologic,
paleoceanographic, and paleoclimatic significance of the mid-Oligocene Braarudosphaera acmes remains unclear
• Recurrent hyperstratification can provide a virtual seafloor, which may be required in Braarudosphaera’s life cycle
Correspondence to: D. Liebrand and I. Raffi, [email protected]; raffi@unich.it
Citation:
Liebrand, D., Raffi, I., Fraguas, Á., Laxenaire, R., Bosmans, J. H. C., Hilgen, F. J., et al. (2018). Orbitally forced hyper-stratification of the Oligocene South Atlantic Ocean. Paleoceanography and Paleoclimatology, 33. https://doi.org/ 10.1002/2017PA003222
Received 24 JUL 2017 Accepted 15 MAR 2018
Accepted article online 24 MAR 2018
©2018. The Authors.
This is an open access article under the terms of the Creative Commons Attribution-NonCommercial-NoDerivs License, which permits use and distri-bution in any medium, provided the original work is properly cited, the use is non-commercial and no modifications or adaptations are made.
Braarudosphaera-rich horizons are reported from Deep Sea Drilling Project (DSDP) Leg 3 (Maxwell et al., 1970), Leg 40 (Bolli et al., 1978), Leg 73 (Hsü et al., 1984), and Leg 74 (Moore et al., 1984), and more recently during Ocean Drilling Program (ODP) Leg 208 (Zachos et al., 2004). They are especially well preserved on bathymetric highs on either side of the Tristan hotspot in areas above the lysocline, which currently lies at ~3,800 m in the South Atlantic Ocean (Boeckel & Baumann, 2004). At abyssal sites, such horizons are thinner or even absent, due to carbonate dissolution below the lysocline (Peleo-Alampay et al., 1999). In the South Atlantic, the Braarudosphaera layers form a belt between ~20° and 30°S (Figure 1; Noël & Melguen, 1978; Parker et al., 1985) that can be traced as a series of (weak) acoustic reflectors for thousands of kilometers across the basin (Maxwell et al., 1970). Braarudosphaera-rich sediments of mid-Oligocene age are also reported from other ocean basins, for instance at sites in the subtropical latitudes of the North Atlantic Ocean (Parker et al., 1985) and the tropical and subtropical latitudes of the Indian Ocean (Roth, 1974; Siesser et al., 1992). However, the abundance of braarudosphaerids in the oozes from the South Atlantic, which are near monospecific, is unequaled in other ocean basins (Parker et al., 1985). The Braarudosphaeraceae appeared in the earliest Cretaceous (ca. 140 Ma) and were particularly diverse and abundant in the Cretaceous and Paleogene (Bown, 2005a; Gartner, 1996; Lamolda et al., 2005). There are two extant species within the Braarudosphaeraceae, and molecular phylogenetic studies place this family within the Class Prymnesiophyceae of the haptophyte eukaryotic algae (Takano et al., 2006). Braarudosphaera bige-lowii is the most well-documented extant species and is found in neritic habitats, such as coastal/shelf set-tings and inland seas (Bukry, 1974; Hagino, 1997; Konno et al., 2007; Proto Decima et al., 1978; Takayama, 1972; Tanaka, 1991). Enrichments of Braarudosphaera spp. in geological records have been linked to environ-mental conditions that mimic those of the neritic realm, such as shallow coastal waters with water depths ≲70 m (Martini, 1967; Takayama, 1972; Tanaka, 1991; Hagino et al., 2013), hyposalinity (Bukry, 1974), Figure 1. Geographic extent of Braarudosphaera-rich layers. Modern geography of the South Atlantic Ocean with the locations of Deep Sea Drilling Project (DSDP) and Ocean Drilling Program (ODP) drill sites (brown areas with chalk pattern) where mid-Oligocene Braarudosphaera-rich layers have been recovered. For South Atlantic Ocean sites information from the relevant DSDP and ODP site reports is recompiled. Blue lines on continents represent modern-day rivers that may have delivered fresh waters to the South Atlantic surface ocean. Light blue areas project the potential mid-Oligocene extent of seasonally recurrent surface ocean stratification caused by increased precipitation over the sea, possibly aided by increased continental runoff closer to the coasts, indicated by a darker blue. According to the eccentricity-tuned age model (Liebrand et al., 2016), the Braarudosphaera oozes are present on oceanic crust≥27.9 Ma. This figure is an adaptation of figures from references: Kelly et al. (2003), O’Connor and Duncan (1990), Parker et al. (1985), and Peleo-Alampay et al. (1999) and combines geographic information and anomaly profiles of www.odsn.de and www.serg.unicam.it, respectively.
eutrophism (Bartol et al., 2008; Cunha & Shimabukuro, 1997;Švábenická, 1999), and/or perhaps a reduced water column transparency. In addition, Braarudosphaera spp. have been associated with climatologic and/or ecologic upheavals and interpreted to be opportunistic (r-strategist), and sporadic bloom-forming taxa that colonize challenging or vacant niches (Bown, 2005b; Bukry, 1974; Minoletti et al., 2005). The neritic ecology of Braarudosphaera spp. is unusual for calcifying prymnesiophytes (coccolithophores), which are more typically adapted to open ocean environments.
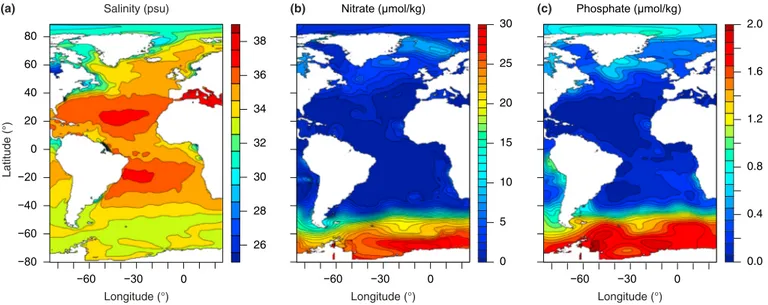
Three factors in particular have made the mid-Oligocene Braarudosphaera acmes an enigma: (i) the stark contrast between the restriction of modern Braarudosphaera to neritic settings, versus the presence of simi-lar taxa in the pelagic realm during the mid-Oligocene (i.e., modern ecology versus paleoecology), (ii) the difference in surface ocean conditions of the modern South Atlantic Ocean (mixed, relatively high salinity and oligotrophic; Figure 2) versus those that prevailed during mid-Oligocene (perhaps more stratified, hypo-saline, and eutrophic), which the Braarudosphaera acmes are thought to reflect (i.e., modern oceanography versus paleoceanography), and (iii) the unknown forcing agents that can explain these ecologic and ocea-nographic contrasts between the present day and the geological past (i.e., modern climatology versus paleoclimatology; Kelly et al., 2003; Peleo-Alampay et al., 1999). One key aspect currently impeding understanding of the mid-Oligocene acmes is the absence of a detailed astrochronological framework for the Braarudosphaera-rich layers. Without a clear chronology, it is not possible to obtain an in-depth under-standing of the cause-and-effect relationships between astronomical climate forcing and the resulting paleoceanographic/paleoecologic conditions that culminated in the Braarudosphaera acmes. Here we pre-sent thefirst continuous and high-resolution stratigraphy across the Braarudosphaera oozes from subtropi-cal South Atlantic Ocean ODP Sites 1264 and 1265, with the aim of investigating the number, duration, timing, and recurrent nature of the acme events.
2. Materials and Methods
2.1. Study Sites
Six sites were drilled along a depth transect on the Walvis Ridge during ODP Leg 208 (Sites 1262-1267; south-eastern Atlantic Ocean), and all but the two deepest sites recovered Oligocene Braarudosphaera-rich strata (Figures 1 and 3; Zachos et al., 2004). For this study, we selected Sites 1264 (2,505 m below sea level [mbsl], ~2,100 paleo-mbsl at 28.5 Ma, 28°31.9550S, 2°50.7300E) and 1265 (3,059 mbsl, ~2,550 paleo-mbsl at 28.5 Ma, 28°50.1010S, 2°38.3540E) that recovered relatively expanded, carbonate-rich Oligocene intervals (Figure 1; Zachos et al., 2004). The sediments are typical for a low- to middle-latitude pelagic setting and are dominated by biogenic carbonates that predominantly consist of calcareous nannofossils, with a smaller contribution of
(a) (b) (c)
Figure 2. Modern sea surface salinity, nitrate concentration, and phosphate concentration. (a) Sea surface salinity, which shows relatively high salinity in the modern South Atlantic Ocean. (b) Sea surface nitrate concentration and (c) sea surface phosphate concentration, which show relatively oligotrophic conditions in the modern South Atlantic Ocean. Data taken from http://www.ewoce.org.
planktonic and benthic foraminifera and almost a complete lack of siliceous microfossils (Zachos et al., 2004). Magnetochron C11 was trans-posed from Site 1266 (3,798 mbsl, ~3,250 paleo-mbsl at 28.5 Ma, 28°32.5500S, 2°20.6100E) to Site 1264 using a detailed correlation between sites (Bowles, 2006; Liebrand et al., 2016). We made a small cor-rection in the adjusted revised meters composite depth (armcd) for an off-splice interval of Core 1264B-29H, to better align it with the revised meters composite depth (rmcd) of the same interval identified on-splice in Core 1264A-29H. One mapping pair for Core 1264B-29H (301.60 rmcd to 301.51 armcd) was replaced with two new mapping pairs (302.06 rmcd to 301.46 armcd and 302.26 rmcd to 301.95 armcd). The composite depth model on the rmcd scale, the splice tie points between Holes 1264A and 1264B, and the age model for Site 1264 remain unaltered from Liebrand et al. (2016).
2.2. Sediment Properties and Stable Isotopes
For stratigraphic and paleoceanographic context, we use previously generated sediment property records (i.e., water content, CaCO3 con-tent, and size fraction weights) and benthic foraminiferal stable oxygen (δ18O) and carbon (δ13C) isotope records (Liebrand et al., 2011, 2016; Zachos et al., 2004), combined with newly generated bulk sediment δ18O andδ13C records and nannofossil abundance records. The CaCO
3 content was estimated from high-resolution X-ray fluorescence core scanning data using the natural logarithm of calcium over iron counts, calibrated to shipboard coulometric CaCO3 measurements ((Zachos et al., 2004); see Liebrand et al., 2016, for details). Bulkδ18O andδ13C iso-tope data were measured at ~5-cm resolution across the entire Site 1264 study interval (286–318 armcd; Figure 4). Bulk isotopes were measured at Utrecht University using a Thermo Finnigan GasBench-II carbonate preparation device coupled to a Thermo Finnigan Delta-V mass spectrometer. Analytical precision was 0.08‰ and 0.03‰ for δ18O and δ13C, respectively. We applied a small (0.20‰) adjustment to the δ18O data that was obtained on the Delta-V to match results of duplicate runs of a small sample set that was measured using a Thermo Finnigan Kiel-III automated preparation system coupled to a Thermo Finnigan MAT 253 mass spectrometer, also at Utrecht University. The ratios for each sample were drift corrected using nine isotopic standard (NBS-19) measurements analyzed within each run.
2.3. Calcareous Nannofossils
Smear slides of bulk sediment were made using standard preparation techniques (Bown & Young, 1998) and were analyzed at Chieti University with a polarizing light microscope at 1250× magnification. Micrographs were taken with a scanning electron microscope (SEM) to visually assess coccolith/pentalith fragmentation, recrystallization, and calcite overgrowth, and to aid species identification (Plate 1). Abundances of the holococcoliths of Zygrhablithus bijugatus, nannoliths of Discoaster spp. (115 samples) and pentaliths of Braarudosphaera spp. (136 samples) were obtained by counting the number of specimens in a defined area of the smear slides (N/mm2, counted in 30fields of view in each sample; Backman & Shackleton, 1983). These counts provide a semiquantitative measure of abundance because the number of specimens in eachfield of view varies due to slight differences in the thickness of sediment on each smear slide. Furthermore, quantify-ing Braarudosphaera spp. was not straightforward because the dodecahedral-shaped coccospheres consist of 12 pentaliths, which, in turn, are composed offive laminated, trapezoidal-shaped segments that easily dis-integrate further into smaller fragments (Plate 1, images [b] and [c]; (Young et al., 2003)). The number of Braarudosphaera pentaliths was derived from counts of segments divided byfive for most samples because complete pentaliths were preserved intact only in a few samples (Plate 1). These calculated abundances may represent an overestimate because of the potential further fragmentation of segments into the composite laminae. Also, the quality of the abundance records presented here may be compromised by the moderate-to-severe recrystallization, as seen in the SEM micrographs (Plate 1).
Figure 3. Core photographs of Braarudosphaera oozes. On-splice and off-splice examples of the lithologic expression of Braarudosphaera Acme Events (BAEs) 3, 5a, and 5b at Site 1264. Strong color variability between and within the acmes can be observed, suggesting higher-frequency precession and/or obliquity forcing. The color contrast of the images is enhanced.
S. ciperoensis S. distentus PMAG WALV. Size fraction (wt%) 0 90 95 100 CaCO 3 est. (%) 90 95 100 Bulk 13 C (‰) 1.0 1.5 2.0 2.5 3.0 Bulk 18 O (‰) 0.5 1.0 1.5 2.0 2.5 3.0
Depth (armcd, Site 1264)
290 295 300 305 310 315 (a) (b) (c) (d) (e) (f) (g) (h) (i) (j) 1264 1265 Core photo W a ter content (%) 15 20 25 Benthic 13 C (‰) 0 0.5 1.0 1.5 Benthic 18 O (‰) 1.0 1.5 2.0 2.5 Braarudosphaera spp. (N/mm 2 ) 0 100 200 300 400 500
Figure 4. Stratigraphy across the Braarudosphaera oozes for Walvis Ridge ODP Leg 208 Sites 1264 and 1265. The data records are presented against stratigraphic depth (armcd = adjusted revised meters composite depth, see Liebrand et al. (2016)). (a) Braarudosphaera spp. abundances. The biohorizons Base Sphenolithus
ciperoensis and Base Sphenolithus distentus are indicated. (b–e) Stable isotope records. (b) Bulk and (c) benthic foraminiferal (Cibicides mundulus) δ18O records. (d) Bulk and (e) benthic foraminiferal (Cibicides mundulus)δ13C records. (f–i) Lithological records. (f) CaCO3estimates for Sites 1264 (dark brown) and 1265 (light brown). Percentages refer to dry weights (i.e., after freeze-drying). (g) Water content of samples. Percentages refer to total sample weights (i.e., before freeze-drying). (h) Size fraction records from Site 1264. Percentages as in panel (f). (i) Core photographs from Site 1264. Apparent cyclicity results from uneven lighting conditions when the photographs were taken. Red crosses and shaded area indicate short recovery gaps at Site 1264. These gaps are covered by data from nearby Site 1265 (both X-rayfluorescence and isotopes). (j) Magnetostratigraphy from Site 1266 transposed to Site 1264 depth (Liebrand et al., 2016). The shaded gray areas indicate that the polarity signal is ambiguous in these intervals.
Plate 1. Micrographs of calcareous nannofossils. (a–c) Scanning electron microscope (SEM) micrographs of Braarudosphaera spp. pentaliths. Specimens show strong overgrowth of calcite and micron-sized crystals and particles. Disintegrated fragments of Braarudosphaera can be seen in the background. (d–f) SEM micrographs of Discoaster specimens show strong calcite overgrowth. (d) Discoaster deflandrei and Zygrhablithus bijugatus. (e) Discoaster deflandrei. (f) Discoaster cf. D. tanii. (g–i) Light microscope micrographs of Braarudosphaera spp., (g and h) Parallel light. (i) Crossed-polarized light. Horizontal bars in all micrographs are 5 μm, apart from panel (a) where the bar represents 50μm. Samples ordered with increasing depth/age: (d and e) 208-1264A-29H-3W, 137.5-138.5 cm, 301.985 armcd, 28.533 Ma. (h) 208-1264A-29H-3W, 150.0-151.0 cm, 302.105 armcd, 28.546 Ma. (a–c, g, and i) 208-1264A-29H-4W, 17.5-18.5 cm, 302.285 armcd, 28.565 Ma. (f) 208-1264A-30H-5W, 12.5-13.5 cm, 314.42 armcd, 29.735 Ma.
Age (Ma) 27 28 29 30 3 2 4 5 1 6 7 b a b c a OLIGOCENE PALEOGENE Chattian Rupelian C11 C10 C9 73 72 71 70 69 74 68 13 12 26 25 24 (a) (b) (c) (d) (e) (f) (g) (h) (i) (j) Eccentricity (-) 0.00 0.02 0.04 0.06 CaCO 3 est. (%) 90 95 100 GTS 2012 18 O (‰) 0.5 1.0 1.5 2.0 2.5 3.0 0 100 200 300 400 500 600 700 Z. bijugatus (N/mm 2 ) Obliquity (°) 22 23 24 25 PMAG WALV. 13 C (‰) 0 0.5 1.0 1.5 2.0 2.5 3.0 0 100 200 300 400 500 0 100 200 300 400 500 Braarudosphaera spp. (N/mm 2 ) Discoaster spp. (N/mm 2 )
Figure 5. Astrochronology for the mid-Oligocene Braarudosphaera acmes. The data records are presented against eccentricity-tuned age (Liebrand et al., 2016). (a–c) Calcareous nannofossil records. (a) Discoaster spp. abundances. (b) Zygrhablithus bijugatus abundances. (c) Braarudosphaera spp. abundances. Vertical gray bars correspond to the Braarudosphaera acmes. The biohorizons Base Sphenolithus ciperoensis and Base Sphenolithus distentus are indicated. (d and e) Stable isotope records. (d) Bulk (light blue) and benthic (dark blue) foraminiferal (Cibicides mundulus)δ18O records. (e) Bulk (light green) and benthic (dark green) foraminiferal (Cibicides
mundulus)δ13C records. (f) CaCO3estimates for Sites 1264 (dark brown) and 1265 (light brown). (g and h) Astronomical solutions. (g) Earth’s obliquity modulation (Laskar et al., 2004). (h) Earth’s orbital eccentricity solution (dark gray, La2011_ecc3L, (Laskar et al., 2011)) and its ~2.4-Myr component (light brown).
2.4. Astronomical Tuning and Statistical Analysis
All data, previously published and newly generated, are presented on a previously published, astronomically tuned age model (Figure 5). This age model is based on the alignment of maxima in CaCO3, interpreted to predominantly reflect productivity maxima, with 95 to 125-kyr minima (i.e., ~110 kyr) in the stable eccentricity solution (Laskar et al., 2011; Liebrand et al., 2016). The Braarudosphaera-rich ooze horizons were excluded during the tuning process because they distort the background cyclicity in CaCO3, which is dominated by ~110-kyr cycles. Higher-frequency astronomical parameters were excluded from the tuning target curve because of (i) the relatively weak expression of obliquity and pre-cession signals in the Site 1264 records, (ii) the unknown phase relation-ship between CaCO3and precession (Liebrand et al., 2016), and (iii) the uncertainty in the stability of the obliquity and precession solutions for ages≳10 Ma (Zeeden et al., 2014). The eccentricity tuning is unaffected by these uncertainties and is precise and accurate at the ~110-kyr level of tuning. To quantify the spectral power of the CaCO3record, we used a multitaper method (Ghil et al., 2002), an evolutive Fast Fourier Transform, and Wavelet analysis (Figure 6; Grinsted et al., 2004). Gaussian filtering of the La2011_ecc3L nominal eccentricity solution and the Braarudosphaera pentalith record was applied to extract their 405-kyr components (Figure 7; Laskar et al., 2011; Paillard et al., 1996).
3. Results
3.1. Stratigraphic Records
We identify seven acmes of varying intensity in the combined lithologic, geochemical and Braarudosphaera spp. abundance records, and we number these from old to young as“Braarudosphaera Acme Events” (BAE-1 to BAE-7; Figures 5 and 7). BAE-3 and BAE-5 are composed of multiple events of shorter duration, which are given a letter as appendix: BAE-3a, BAE-3b, BAE-5a, BAE-5b, and BAE-5c. Core photographs reveal (Figure 3) that BAE-3b and BAE-5b can be subdivided further into “couplet” or “triplet” horizons that probably reflect individual insola-tion peaks of relatively short durainsola-tion (e.g., precession or obliquity maxima/Southern Hemisphere [SH] summer insolation maxima). Similar bundling of Braarudosphaera-rich layers has been observed in sedi-ments recovered from DSDP Site 363 (Kelly et al., 2003). At Site 1264, BAE-7 is only partially recovered because of a short coring gap. Furthermore, the base of BAE-2 and the maxima of BAEs 3a and 5b overlap with core section ends. These artifacts may have affected the quality of the data records in these specific intervals. However, the close agreement between the patterns observed in CaCO3 from Sites 1264 and 1265 suggests that these issues are minor (Liebrand et al., 2016). The thicknesses of the BAEs as recorded in the CaCO3records from Sites 1264 and 1265 vary between ~10 and 35 cm (Figure 4).
The sediment size fraction records, combined with the high CaCO3values (~90–95%) and smear-slide observa-tions, strongly suggest that calcareous nannofossils make up the bulk of the sediments at Site 1264 (Figure 4; Liebrand et al., 2016). Over the Braarudosphaera oozes, the 0–38 μm size fraction increases from typical back-ground values of ~95% to up to 98% of the dry sample weights. The Braarudosphaera-rich samples were dif fi-cult to wash over a sieve, and size fraction weights across these oozes may be affected by poor disaggregation of the more lithified sediments, resulting in lower weights for the smaller size fractions and higher weights for the greater size fractions. Similar difficulties have been reported for Braarudosphaera-rich samples from DSDP Site 362 (Diester-Haass, 1988). The water content of the sediment (expressed as percentages of the total wet-sample weights) decreases sharply from ~25% to 15% across the six most prominent Braarudosphaera oozes. This probably reflects lower porosity of the bulk sediment resulting from a smaller contribution of foraminifera (Figure 4). Absolute values in the CaCO3records agree well between Sites 1264 and 1265 and generally vary
CaCO3 50% 90% 95% 95% 99% 1 10 100 Power Power (a) 40 Frequency (cycles/Myr) 0 10 20 30 40 50 60 Age (Ma) 27.5 28.0 28.5 29.0 29.5 Periodicity (kyr/cycle) ~110 405 19 21 23 (b) Age (Ma) 27.0 28.0 29.0 30.0 1 2 4 8 16 31 125 63 Frequency (cycles/Myr) 40 Periodicity (kyr/cycle) ~110 405 ~20 CaCO3
Figure 6. Spectral analyses on carbonate content. (a) Evolutive spectral ana-lysis and singular spectrum anaana-lysis on the CaCO3record using a multitaper method (Ghil et al., 2002). (b) Wavelet analysis and global spectrum analysis on the CaCO3record. Black lines on the wavelet analysis and red lines on the spectral analyses represent the 95% confidence level. White shaded area in top right corner represents the“cone of influence,” where edge effects become important (Grinsted et al., 2004). For both panels: Blue colors indicate low spectral power and red colors indicate high spectral power.
around ~92% CaCO3of dry sample weight but increase to nearly 100% CaCO3in the Braarudosphaera-rich layers (Figures 4 and 5).
The benthic foraminiferalδ18O andδ13C stratigraphies are characterized by a ~1.0‰ amplitude variability on eccentricity time scales, and the ~110- and 405-kyr cycles are particularly well expressed in the benthic δ18O andδ13C series, respectively (Liebrand et al., 2016). These large amplitude ~110-kyr cycles in benthicδ18O are interpreted to reflect sub-stantial waxing and waning of the Antarctic ice sheets, with the largest glacial maxima reaching sizes equivalent to approximately 85–110% of the modern ice volume on East Antarctica (Liebrand et al., 2017). The bulkδ18O record shows six prominent positive excursions from back-ground values of ~1.5‰ to peak values of ~2.5‰ to 3.0‰ concurrent with BAEs 3a, 3b, 5a, 5b, 6, and 7. Similar isotopic shifts across Braarudosphaera oozes have previously been noted in bulk records from the South Atlantic and Indian Ocean (Kelly et al., 2003; Peleo-Alampay et al., 1999; Siesser et al., 1992). The absence of strong bulkδ18O excur-sions during BAEs 1, 2, and 4 indicates a smaller contribution of Braarudosphaera to the bulk sediment. The largestfluctuations in the bulk δ18O record can be explained by disequilibrium “vital effects” and/or preferential seafloor diagenetic alteration of bulk calcite δ18O in the BAEs. The exact biochemical mechanisms causing strong isotopic fractionation are currently unknown because culturing of B. bigelowii has not been successful to date (Hagino et al., 2013, 2016), but it is a common feature seen in coccolithophores (Bolton et al., 2012; Hermoso et al., 2014; Stoll & Ziveri, 2004). However, diagenesis could also explain the increase in bulk carbonateδ18O toward higher values, because both bulk calcite and benthic foraminiferalδ18O values reach maximum values of ~2.5‰ to 3.0‰ after the benthic values are adjusted to isotopic equilibrium with bottom waters (note that uncor-rectedδ18O values are depicted in Figures 4 and 5; Bukry, 1981). The bulkδ13C record varies between 1.5‰ and 2.5‰ and shows no similarly prominent excursions during the mid-Oligocene (Figures 4 and 5).
3.2. Eccentricity Tuned Age Model and Time Series Analysis
The BAEs at Site 1264 occur within a 1.6-Myr time interval that spans from 29.5 to 27.9 Ma on the eccentricity-tuned age model (Liebrand et al., 2016). The acmes occur within 405-kyr eccentricity Cycles 73–69 of the Rupelian (early Oligocene) and Chattian (late Oligocene) stages of the 2012 Geologic Time Scale (GTS2012, (Vandenberghe et al., 2012)). The Oligocene nannofossil biohorizons Base (i.e., lowest orfirst occurrence) Sphenolithus distentus (315.14 armcd) and Base Sphenolithus ciperoensis (289.66 armcd) have been identified in the studied interval (Figure 4) and are astronomically dated at ~29.81 and ~27.02 Ma, respectively (Figure 5). The tuned ages for these bioevents at Site 1264 are 190 and 120 kyr younger, respectively, than the calibrated ages in the most recent Paleogene nannofossil biochronology (i.e., 30.00 and 27.14 Ma, respectively; (Agnini et al., 2014)). A direct comparison to the GTS2012, which for the Oligocene Epoch follows the manually tuned ages for equatorial Pacific ODP Site 1218 (Pälike et al., 2006), indicates that all BAEs identified at Sites 1264 and 1265 fall within magnetochrons C10n.1n–C11n.1r (Liebrand et al., 2016; Vandenberghe et al., 2012). This finding is supported by the only reliable reversal identified at Site 1266, namely, the top of Chron C11n, which is transferred to Site 1264 via detailed correlation of physical property records (i.e., magnetic susceptibility and color reflectance). The independently tuned age for this reversal (29.170 Ma) is in excellent agreement with the tuned Site 1218 age and the GTS2012 (Liebrand et al., 2016; Pälike et al., 2006; Vandenberghe et al., 2012). Time-evolutive spectral analysis of the CaCO3record from Site 1264 shows that high spectral power is present in a frequency range of ~10.0–25.0 cycles/Myr, which corresponds to periodicities of ~110–40 kyr/cycle (Figure 6a). Weaker spectral peaks can be identified at the ~2.5, ~5.0, and ~32.0 cycles/Myr frequencies (corresponding to ~405, ~200, and ~31-kyr periodicities). In contrast, wavelet analysis on the CaCO3record
Eccentricity (-) mid-latitude insolation threshold 0.00 0.02 0.04 0.06 Braarudosphaera spp. (N/mm 2 ) 0 100 200 300 400 500 Age (Ma) 27 28 29 30 73 72 71 70 69 74 68 (a) (b) (c) (d) 3 2 4 5 1 6 7 b a b c a
Figure 7. Eccentricity pacing of Braarudosphaera acme events. (a) Gaussian filter of the Braarudosphaera spp. abundance record centered around the 405-kyr periodicity (i.e., frequency = 2.5, bandwidth = 0.5, (Paillard et al., 1996)). (b) Braarudosphaera spp. abundance record. (c) Gaussianfilter of the 405-kyr eccentricity periodicity. (d) Earth’s orbital eccentricity (Laskar et al., 2011). Vertical red lines correspond to Braarudosphaera acmes that occurred during 405 and ~110-kyr eccentricity maxima. Vertical blue lines show those acmes that correspond to 405- and ~110-kyr eccentricity minima.
from Site 1264 reveals significant spectral power near the precession frequencies (Figure 6b; Liebrand et al., 2016). A filter of the 405-kyr periodicity present within the Braarudosphaera spp. abundance record shows a very strong response during the ~2.4-Myr eccentricity minimum at ~28.5 Ma. During ~2.4-Myr minima, the 405-kyr component of eccentricity is most strongly expressed and this appears to be highly amplified in the abundance record.
3.3. Calcareous Nannofossil Abundance
Variability in the amplitude of the BAEs is apparent in the Braarudosphaera spp. abundance record, and, apart from peak values during BAE-5 (~490/mm2), a general trend of increasing amplitude is observed through the succession of Braarudosphaera oozes (BAE-1 ~140 to BAE-7 ~370 N/mm2; Figures 4 and 5). The Braarudosphaera abundance record generally confirms the number of BAEs observed in the CaCO3 and bulk δ18O records. It also shows that not all acmes were of the same magnitude and that some of them lack a clear lithological/geochemical expression. Both Discoaster spp. and Z. bijugatus are strongly anticorrelated with Braarudosphaera spp. abundance (Figure 5). These patterns suggest that Braarudosphaera spp. outcompeted and/or diluted Z. bijugatus and Discoaster spp. during the acmes.
3.4. Taxonomy and Species Concepts
The SEM images show that Braarudosphaera and Discoaster specimens were more adversely affected by recrys-tallization and calcite overgrowth than other nannofossil taxa, and for many Discoaster specimens the over-growth was so severe that an unambiguous visual identification to species level was not possible (Plate 1). However, very few Discoaster species are present in the Oligocene (Bukry, 1978b) and it is likely that the domi-nant six-rayed discoasterids are Discoaster deflandrei and scarce five-rayed specimens are Discoaster tanii. The abundance record combines all Discoaster species encountered, and we refer to these as Discoaster spp. Similarly, identification of Braarudosphaera specimens remained ambiguous. The Oligocene specimens appear too large to belong to the extant species B. bigelowii and resemble the extinct species B. perampla (Bown, 2010; Raffi et al., 2016). We therefore refer to these Oligocene Braarudosphaera specimens as Braarudosphaera spp., but they are most probably extinct close relatives of the living B. bigelowii species complex.
4. Astrochronology
4.1. Durations of the Acmes
The eccentricity-tuned age model for Site 1264 is constructed using linearly interpolated ages between tun-ing tie points every ~125 kyr (Liebrand et al., 2016). To obtain approximate durations of the BAEs, we assume that the effect of bioturbation was limited to ~10 cm vertically. During deposition of the Braarudosphaera oozes, sedimentation rates likely increased sharply, complicating the estimation of their duration. Despite these uncertainties, wefind that the BAEs at Site 1264 show large variability in durations (Table 1). BAE-3 and BAE-5 both consist of several closely spaced, hence shorter-lived, acme events, which combined have durations of ~160 and ~210 kyr, respectively (Table 1). BAE-5, which has the longest duration and highest amplitude, thus persisted for the greater part of 405-kyr Eccentricity Cycle 71 (Figures 5 and 7). The acmes identified in the Braarudosphaera abundance record (i.e., BAEs 1, 2, 3a, 3b, 4, 5a, 5b, 5c, 6, and 7) have dura-tions ranging from ~20 to 80 kyr (~55 kyr on average). These duradura-tions broadly correspond to the insolation periodicities and may represent single or multiple precession or obliquity cycles. Superimposed on BAE-3b and BAE-5b, three relatively brief events (~20 kyr each, not numbered) are identified (Figures 3, 4, 5 and Table 1). These relatively short-lived events are expressed in the lithological record as individual ooze layers and are probably paced by the precession cycle (Figure 3). Lithologically similar Braarudosphaera layers from DSDP Site 363 were estimated to have been deposited over a period of 1 to 2 kyr each, based on a linear inter-polation between magnetostratigraphic reversal ages (Kelly et al., 2003). These very short durations contrast with the estimates based on the record from Site 1264, which suggest that deposition of individual Table 1
Durations of Braarudosphaera Acme Events
Event Base age (Ma) Top age (Ma) BAE duration (kyr) Sub-event duration (kyr) BAE-1 29.513 29.462 50 N/A BAE-2 29.347 29.292 55 N/A BAE-3 29.058 28.899 159 N/A BAE-3a 29.058 28.985 72 N/A BAE-3b 28.971 28.899 72 24 BAE-4 28.809 28.786 23 N/A BAE-5 28.619 28.407 212 N/A BAE-5a 28.619 28.572 47 N/A BAE-5b 28.572 28.508 65 22 BAE-5c 28.487 28.407 80 N/A BAE-6 28.151 28.103 48 N/A BAE-7 27.919 27.878 41 N/A
Note. Duration estimates are based on the Braarudosphaera spp.
abun-dance record and the eccentricity tuned age model for Site 1264. BAE-3b and 5b consist of three shorter lasting acmes each, which average duration estimates are given in the last column. N/A = not applicable.
Braarudosphaera oozes lasted up to a (phase of a) ~20-kyr precession cycle (or, possibly, up to a phase of a 40-kyr obliquity cycle) and that the entire BAE-5 had a duration of>210 kyr.
4.2. Astronomical Pacing of the Acmes
The Braarudosphaera event with the longest duration on the eccentricity-tuned age model is BAE-5, and it is contemporaneous with a very pronounced minimum in the ~2.4-Myr eccentricity cycle at ~28.5 Ma, which coin-cides with the high-amplitude 405-kyr Eccentricity Cycle 71 that is characterized by low amplitude ~110-kyr cycles (Figure 5; Liebrand et al., 2016). A strong expression of the ~405-kyr beat is present in the Braarudosphaera abundance record (Figure 7). BAEs 2, 3, and 6 concur with ~110-kyr eccentricity maxima which, apart from during BAE-2, have a relatively subdued amplitude because of the ~2.4-Myr eccentricity minimum. However, BAE-1 (weak), BAE-4 (weak), and BAE-7 (strong) are concurrent with ~110-kyr eccentricity minima. The opposite phase relationships between most BAEs and different eccentricity periodicities (i.e., they are concur-rent with a ~2.4 Myr eccentricity minimum, and most BAEs also with 405- and ~110-kyr eccentricity maxima) indicate a complex forcing mechanism. Three lines of evidence suggest that obliquity and precession cycles paced the BAEs, despite the uncertainty in the exact phase relationships. First, BAEs 2, 3, 5, and 6 occur during 405-kyr eccentricity maxima (Figure 7), suggesting a pacing of these acmes by (eccentricity modulated) preces-sion. Second, two of the acmes (BAE-3b and BAE-5b) each comprise multiple prominent Braarudosphaera-rich layers that are separated by brief intervals of lower Braarudosphaera abundance (Figures 3, 4, 5). This is indica-tive of a bundling of lithological cycles and probably reflects groups of precession-paced events (Table 1). Third, the CaCO3record across the Braarudosphaera acmes contains the highest-frequency spectral power associated with the obliquity and precession cycles according to the evolutive and wavelet analyses, respectively (Figure 6). Both the precession- and obliquity-dominated pacing of the acmes is in agreement with independent estimates for interbed periods of 100 kyr or less for the Braarudosphaera-rich layers recorded at Site 362 (Bukry, 1978a). No clear relationship is observed between ~175-kyr amplitude modulations of obliquity and the acmes, despite strong spectral power near a ~200-kyr periodicity (Figure 5).
5. Discussion
The high-resolution records from Sites 1264 and 1265 convincingly show, for thefirst time, that astronomical climate forcing was a key contributing factor to the formation of the South Atlantic Braarudosphaera acmes. Yet, the exact paleoceanographic, and paleoclimatologic significance of the BAEs remains elusive because of the poor constraints on the paleoecology of this group of calcareous nannoplankton. In this discussion, we will briefly summarize the current understanding of the life cycle of the extant species B. bigelowii and then speculate on two mechanisms that can link astronomical forcing to aberrant, climatologic, and oceano-graphic conditions potentially conducive to Braarudosphaera production and proliferation.
5.1. The Life Cycle of B. bigelowii
To date, the extant B. bigelowii has not been cultured successfully, nor has its life cycle been directly observed, and its exact ecologic preferences thus remain unclear (Hagino et al., 2013, 2016). Two observations, how-ever, provide some constraints on the life process of B. bigelowii, namely, (i) this taxon most probably has alternating life cycle stages that correspond to the number of chromosomes in the cell: one stage is motile, noncalcifying and probably haploid; the other is nonmotile, calcifying and probably diploid (Billard & Inouye, 2004; Hagino et al., 2013; Thompson et al., 2012), and (ii) the species belonging to the genus Braarudosphaera have no coccosphere perforations and thus likely reflect a (nonreproductive) resting stage or “cyst” (Billard & Inouye, 2004). If we accept these constraints on the life cycle of Braarudosphaera and combine this informa-tion with the modern-day biogeographical distribuinforma-tion, which shows that B. bigelowii is limited to neritic set-tings (Martini, 1967; Takayama, 1972; Tanaka, 1991), we can tentatively infer that Braarudosphaera spp. may require a seafloor during its nonmotile, calcifying resting stage, that prevents the cysts from sinking. Similar to previous authors, we speculate that the mid-Oligocene acmes may indicate phases of increased encyst-ment, and perhaps increased unfavorable paleoecologic conditions for Braarudosphaera to thrive in its motile noncalcifying stage (Bown, 2005b; Bukry, 1978a; Bybell & Gartner, 1972; Fischer et al., 1967).
5.2. Toward a Mechanistic Understanding of the Oligocene Acmes
Two observations are key to unraveling the main causes of the mid-Oligocene BAEs. First, the most geogra-phically extensive occurrences of Braarudosphaera are in both the North and the South Atlantic, broadly
around 30°N and 30°S, respectively (Figure 8; Parker et al., 1985). Second, the oozes from Sites 1264 and 1265 are astronomically paced (Figures 5–7 and Table 1). Both of these observations, the biogeography and timing of events, can be explained by astronomical forcing of the mid-Oligocene climate system and the responses of the atmosphere and surface ocean. We propose two different chains of events that link astronomical forcing of the climate system to latitudinal migrations of atmospheric and/or oceanic fronts, pycnocline and/or thermocline shallowing, hyperstratification, and recurrent Braarudosphaera acmes in the South Atlantic Ocean. Thefirst mechanism is basin-wide hyperstratification through increased moisture transport to the South Atlantic Ocean (i.e., the Monsoon Hypothesis). The second mechanism is eddy-contained hyperstratification through strong isopycnals at the base of the eddies and increased eddy formation by either the proto-Benguela Current, Agulhas leakage, or both (i.e., the Eddy Hypothesis).
5.2.1. Insolation Forcing of the BAEs
The concurrence of the most prominent acmes with a very pronounced minimum in the ~2.4-Myr eccentri-city cycle (Figures 5 and 7) suggests that the oceanographic mechanism that facilitated the BAEs was enhanced as a result of the prolonged absence of insolation“extremes” in the low-to-middle southern lati-tudes. In this interpretation the anomalous occurrence of BAEs 2 and 6 in conjunction with ~110-kyr eccen-tricity maxima can be explained by interference between obliquity and precession that operated to cancel out their effects on low-to-middle southern latitude insolation. Such interference, during (at least) these two events, brings all BAEs in agreement with a hypothetical (regional) insolation-threshold (Figure 7), below which conditions were suitable for acmes to develop. However, we cannot be certain about interference Figure 8. Links between atmospheric circulation, hyperstratification, and Braarudosphaera acmes. Atmospheric circulation and areal extent of the Braarudosphaera acmes drawn on a paleogeographic reconstruction for the mid-Oligocene (~28.5 Ma, www.odsn.de). ITCZ stands for intertropical convergence zone. SHPB stands for subtropical high-pressure belt, PCZ stands for polar convergence zone. H = area of generally high air pressure. L = area of generally low air pressure. Thisfigure is based on those by Parker et al. (1985) and Peleo-Alampay et al. (1999).
between obliquity and precession at these times because the astronomical solution for these parameters is not stable for ages>10 Ma (Zeeden et al., 2014).
5.2.2. Monsoon Hypothesis: Atmospheric Circulation and the Hydrological Cycle
We propose that sustained wet monsoon conditions increased the annually averaged oceanic rainfall over the subtropical South Atlantic Ocean and caused a reduction of surface ocean salinity (Bukry, 1974). This hypothesis is based on the concurrence of the BAEs with a ~2.4-Myr eccentricity minimum, when the amplitude of precession is reduced. We assume that dry and/or stormy winter monsoons were limiting Braarudosphaera acmes during times with relatively higher amplitude precession cycles (i.e., ~2.4-Myr eccen-tricity maxima), through insufficient buildup of relatively “fresher” surface waters and/or through too much surface ocean mixing, respectively. The hypothesized sustained wet monsoon conditions, during the ~2.4-Myr eccentricity minimum, were amplified on astronomical time scales during more favorable precession and obliquity paced insolation conditions. Increases in oceanic rainfall at ~30°S could have been caused by a weakening of the Hadley Circulation (Figure 8), for example, or by a very significant southward shift of the low pressure systems that are generally associated with the intertropical convergence zone (ITCZ; see section 5.3; Figures 9a and 9b).
5.2.3. Eddy Hypothesis: Atmospheric Circulation and Eddy Formation
In this alternative hypothesis, we propose that increased eddy formation was caused by intensification of the proto-Benguela Current through the strengthening of the Easterlies or by increased Agulhas leakage due to the southward migration of the SH subtropical (oceanic) front (Bard & Rickaby, 2009; Peeters et al., 2004). Similar to the mechanism proposed in the Monsoon Hypothesis, one phase of the precession cycle must have prevented enhanced eddy formation in earlier and later time periods when the amplitude of eccentricity was greater. We speculate that warm SH summers during high-amplitude eccentricity-modulated precession cycles weakened the Easterlies and reduced the formation of proto-Benguela upwelling eddies (both cyclo-nic and anticyclocyclo-nic). Alternatively, cold SH winters during these orbits moved the subtropical front north-ward too much for sufficient Agulhas rings (predominantly anticyclonic) to enter and cross the South Atlantic Ocean (see section 5.4; Figure 9c).
5.2.4. Hyperstratification and Braarudosphaera Acmes
In conjunction with the Monsoon Hypothesis, we propose that the cumulative buildup of fresher (i.e., rela-tively hyposaline) surface waters during a prolonged interval of wetter winters in combination with reduced winter mixing caused the buildup of a lower-salinity surface water lens, as is depicted in Figure 1. In contrast, in the Eddy Hypothesis, increased proto-Benguela upwelling eddies and/or Agulhas leakage changed the physicochemical properties of the South Atlantic surface ocean. In this hypothesis, we propose that consecu-tive summers (though not of maximum amplitude) during the ~2.4-Myr eccentricity minimum, in combina-tion with a sufficient shedding of eddies during the relatively weak winters, caused the more frequent traversing of eddy-contained surface waters across the basin (Figure 9c). The proposed mechanisms of both the Monsoon and Eddy hypotheses could have resulted in a relatively shallow pycnocline or thermocline and regional (ocean-basin-wide) or localized (eddy contained) salinity/temperature stratification of the surface ocean—conditions we refer to as “hyperstratification” (Reichart et al., 2004). This regional or local shallowly situated pycnocline/thermocline could have served as a virtual seafloor (Reichart et al., 2004) capable of con-centrating Braarudosphaera in the water column.
We note that these chains of events are distinct from that previously proposed for hyperstratified conditions in the northern Arabian Sea, during the Pleistocene (Reichart et al., 2004). There, the formation of a strong density gradient followed glacial overturning events (i.e., Heinrich events). Such a mechanism was invoked to explain the presence of a lagoonal dinoflagellate species in the open ocean, and the hyperstratified con-ditions were postulated to simulate a shallow seafloor that is needed for the germination of the dinoflagellate cysts (Reichart et al., 2004). A similar link to glacial overturning events for hyperstratification of the Oligocene South Atlantic Ocean is unlikely because we do notfind a strong correlation between benthic δ18O values and the BAEs (Figures 4 and 5).
5.3. Atmospheric Circulation
If we accept astronomically forced changes in hydroclimate as the forcing factor responsible for the BAEs (i.e., the Monsoon Hypothesis), then we need to identify the atmospheric circulation changes that could have caused the monsoonally driven increases in rainfall over the surface ocean (and adjacent continents) needed for hyperstratification. Potential mechanisms include the following: (i) a weakening of the Hadley circulation
causing a slowdown of moisture transport away from the subtropical high-pressure belt, where relatively cold and dry air of the Hadley and Ferrel cells sinks underneath theflow of the subtropical jet (Figure 8) and (ii) a significant southward migration of the ITCZ and associated low pressure system, where warm and wet air of the Hadley cells rises (Figure 8). Both of these mechanisms could increase the freshwater budget in the subtropical South Atlantic Ocean.
Support for a sustained southward shift of low air-pressure systems can be found in climate modeling studies of the Pleistocene (Figures 9a and 9b). Computed precipitation anomalies between precession minima and maxima, using an atmospheric circulation model and present-day geography, show that precession forcing exerts the strongest control on the redistribution of moisture at low-to-middle latitudes by modulating the amplitude of seasonal monsoons (Figures 9a and 9b; Bosmans, Drijfhout, Tuenter, Hilgen, & Lourens, 2015; Mohtadi et al., 2016). In addition, this model supports a smaller contribution of obliquity forcing to monsoon intensity (Bosmans, Hilgen, et al., 2015). A different modeling study, comparing moisture transport between the Last Glacial Maximum and Heinrich Stadial 1, using modern-day geography and including changes in radiative forcing (i.e., isolation and greenhouse gasses), shows an increase in rainfall over the South Atlantic Ocean at tropical to subtropical latitudes between these two time periods (Figure 9b; Liu et al., 2009; Mohtadi et al., 2016; Otto-Bliesner et al., 2014). These two studies of the Pleistocene are driven by dif-ferent mechanisms than the one we propose for the Oligocene. However, they show that a basin-wide rain Figure 9. Monsoon Hypothesis (a and b) and Eddy Hypothesis (c). (a) EC-Earth modeling output shows the influence of precession extremes on precipitation redistribution across the globe using modern-day geography (Bosmans, Hilgen, et al., 2015; Bosmans, Drijfhout, Tuenter, Hilgen, & Lourens, 2015). P stands for precession. (b) Modeling output of a transient simulation of climate evolution of the past 21 kyr using a fully coupled global climate model (i.e., CCSM3) that includes radiative forcing. It shows that during the last glaciation meridional overturning circulation has the largest control on tropical moisture distribution (Liu et al., 2009; Otto-Bliesner et al., 2014). HS1 stands for Heinrich Stadial 1. LGM stands for Last Glacial Maximum. The relevance of these models to the Oligocene is that they both show a latitudinal rainfall band across the South Atlantic Ocean. Panels a and b are adapted from Mohtadi et al. (2016). (c) Approximate pathways of Benguela Current-derived cyclonic and anticyclonic eddies (purple) and Agulhas rings (teal), which are almost all anticyclonic in the modern. This panel is loosely based on satellite altimetry data presented in Chelton et al. (2011), Pegliasco et al. (2015), Schouten et al. (2000), Souza et al. (2011), and Wang et al. (2015).
belt can develop and persist on astronomical time scales over the South Atlantic Ocean along a ~10°S latitudinal band.
No similar modeling of atmospheric circulation and precipitation changes has been performed for the mid-Oligocene time interval, but given these modeling examples for the Pleistocene, we deem larger changes in hydroclimate during the Oligocene a possibility, especially considering the different paleoclimatic and paleo-geographic boundary conditions. The ITCZ in the Pacific is suggested to have migrated northward in response to extratropical cooling associated with Antarctic glaciation across the Eocene-Oligocene transition (Hyeong et al., 2016), but a much greater latitudinal shift in the ITCZ of the opposite sign (southward) is required to explain the mid-Oligocene BAEs through overhead precipitation. This observation raises feasibil-ity questions from the perspective of atmospheric heat transport (Donohoe et al., 2013) and perhaps points to the importance of freshwater delivery by large African and South American river systems with headwaters in lower latitudes (Figure 1). Regardless, from a physical oceanographic perspective, it is hard to conceive a stagnant South Atlantic surface ocean to persist for long periods of time (e.g., several months per year, annually recurring for thousands of years), thought to be needed for the BAEs to occur and form laminated (see section 5.5), laterally extensive, decimeter-thick ooze packages.
5.4. Dynamics at the Oceanic Mesoscale
Eddies in the modern ocean are characterized by complex and dynamic behavior, including“eddy trapping” and“eddy pumping” (McGillicuddy Jr., 2016). Eddy trapping refers to the pinching off of fluid rings (approxi-mately 40–280 km in diameter, with cores of ~50 km (Wang et al., 2015) and life times of a few days to 2 years) that can transport associated planktonic ecosystems from, for example, the Indian Ocean to the South Atlantic Ocean (Villar et al., 2015). In the modern, both the Benguela Current and the Agulhas retro-flection produce rings (eddies) that can propagate far into the interior of the South Atlantic Ocean and thereby provide lateral fluxes of physical, chemical, and biological properties (Figure 9c; Lehahn et al., 2011; McGillicuddy Jr., 2016; Villar et al., 2015). Many of the modern Agulhas retroflection-derived eddies have at least ~30% of their contents transported from the Indian Ocean and are found to travel across the subtropical gyre, before disintegrating (Wang et al., 2015). Eddy pumping is the dynamic process of upwelling or downwelling within cyclonic (SH clockwise) and anticyclonic (SH anticlockwise) eddies that dome or depress the seasonal and mean pycnoclines, respectively (McGillicuddy Jr., 2016). For cyclonic eddies this results in density surfaces that coincide with the base of the euphotic zone (~500 m water depth), which could constitute the virtual seafloor potentially important for Braarudosphaera during its resting stage.
We speculate that a greater number of proto-Benguela Current-derived eddies, or rings shedding from the Agulhas retroflection, resulted from astronomically forced intensifications of the Easterlies, or a southward shift of the (oceanic) subtropical front, respectively. This process may provide an explanation for the increase in calcification and export productivity associated with the BAEs, in an otherwise oligotrophic central gyre. However, the near-monospecific nature of the Braarudosphaera oozes is difficult to explain if eddy occur-rence alternated with gyre conditions that were host to normal planktonic populations. Another potential problem with the Eddy Hypothesis could be the gradual subduction of eddies, in the present day, to ~600-m water depth upon leaving the Cape Basin (Figure 9c; Arhan et al., 1999; Garzoli et al., 1999; Herbette et al., 2004). Subduction would not necessarily limit the habitable environment for Braarudosphaera to the eastern South Atlantic because, similar to the base of eddies, the boundary between the tops of the subducted eddies and the overlying surface waters are characterized by a strong pycnocline and thermocline (Pegliasco et al., 2015). This surface could potentially serve as a physical barrier that partially/temporarily pre-vents biota from sinking.
The Eddy Hypothesis does not explain why Braarudosphaera are not found in earlier and later episodes with similar, but hypothesized, weaker, dynamics at the oceanic mesoscale in the South Atlantic. However, the geographic overlap between the modern-day Benguela eddy and Agulhas ring corridors, and the Oligocene Braarudosphaera belt is striking (Figure 9c; Chelton et al., 2011; Pegliasco et al., 2015), despite poor constraints on the exact latitudinal extent of the South Atlantic Braarudosphaera belt due to a scarcity of drill sites between ~0° and 25°S and between 35° and 50°S (Figure 1; Peleo-Alampay et al., 1999). Nevertheless, acoustic horizons linked to Braarudosphaera oozes can be traced to Site 360 in the southern Cape Basin (near Cape Town, (Bolli et al., 1978)), making the geographic match with the modern
eddy pathways even more compelling. The greater contribution of Braarudosphaera fragments to the bulk sediment in the South Atlantic compared to the North Atlantic matches the greater longevity of eddies in the former basin (Chelton et al., 2011).
5.5. Recurrence of the Acmes
The BAEs identified at Sites 1264 and 1265 were recurrent on eccentricity to precession time scales and were sustained phenomena that persisted for several thousands up to hundreds of thousands of years. In addition to this evidence for astronomical forcing of the Oligocene BAEs through the latitudinal migrations of atmo-spheric fronts, two observations shed further light on climatic/oceanographic mechanisms. First, greater numbers of acmes are described at sites near the continental margins than at pelagic sites (e.g., at least 34 cyclical Braarudosphaera oozes at Site 362 (Bukry, 1978a)). Second, the best-developed ooze at Site 20, located in the western part of the South Atlantic Ocean, shows laminae (Figure 1; Maxwell et al., 1970). The greater number of acmes in drill cores from the African continental margin suggests that these surface waters were more frequently stratified than those overlying open ocean sites. According to the Monsoon Hypothesis, we speculate that the ~34 layers at Site 363 reflect precession-paced runoff events, similar in ori-gin perhaps to the precession-paced sapropels of the Miocene-Pleistocene Mediterranean. Hyperstratification (and sapropel formation) of the Mediterranean occurred more readily due to the greater influx of freshwater during the wet summer monsoon, both from increased runoff and directly through oceanic rainfall (Bosmans, Drijfhout, Tuenter, Hilgen, & Lourens, 2015; Bosmans, Drijfhout, Tuenter, Hilgen, Lourens, & Rohling, 2015). However, the absence of organic rich sediments in the South Atlantic during the mid-Oligocene indicates that bottom waters remained well oxygenated throughout the BAEs, and that stratification must thus have been a surface ocean phenomenon. The laminae at Site 20 suggest that individual BAEs consist of annual layers that could reflect a seasonal amplification of the sustained moderately wet monsoon conditions that were already prevailing throughout the year. The laminae represent recurring blooms of Braarudosphaera that probably coincided with the annual wet summer monsoons.
In the Eddy Hypothesis, the greater number of BAEs preserved at Site 362 and 363 would reflect a greater number and more continuous stream of eddies and/or Agulhas rings forming and passing over this region of the subtropical South Atlantic, despite the fact that the Benguela Current, responsible for many eddies in this region in the modern, did not develop or fully intensify until the middle Miocene (Diester-Haass, 1988; Diester-Haass et al., 1990) and that present-day Agulhas rings do not travel so far to the northeast (Figure 9c). The laminae found at Site 20 would in this hypothesis reflect productivity increases associated with eddies moving over the site, alternated with relative brief intervals of no deposition, until the next Braarudosphaera-laden eddy arrived.
5.6. Oligocene Climatic Boundary Conditions
The Braarudosphaera oozes at Sites 1264 and 1265 are restricted to a 1.6-Myr interval (~29.5 to 27.9 Ma) and have not yet been identified during earlier or later ~2.4-Myr eccentricity minima. This suggests that boundary conditions other than astronomical configuration, such as climate and tectonic evolution during the mid-Oligocene, caused the South Atlantic basin to become sensitive to seasonal hyperstratification under favorable insolation conditions. Long-term climate evolution during the Oligocene is characterized by a cool-ing trend/Antarctic ice sheet expansion durcool-ing the early Oligocene (~33.9 to 28.0 Ma), a generally cold mid-Oligocene glacial interval (~28.0 to 26.3 Ma) that is characterized by a generally large, but highly unstable, Antarctic ice sheet, and a late Oligocene phase of global warming/reduction in Antarctic ice volume (~26.3 to 23.7 Ma; (Liebrand et al., 2017; Pälike et al., 2006; Wade & Pälike, 2004)). The BAEs coincide with the latest part of the early Oligocene cooling trend, suggesting that hyperstratification in the South Atlantic Ocean occurred during relatively colder conditions globally. In addition to climatic boundary conditions, tectonic processes, such as the opening of the Drake Passage, may have affected the timing of the BAEs on multi-Myr time scales (Kelly et al., 2003; Peleo-Alampay et al., 1999).
6. Conclusions
We identify strong ~2.4-Myr and 405-kyr eccentricity pacing of Braarudosphaera acme events at Walvis Ridge, which broadly correlate to other similar events reported at midlatitude South Atlantic sites. We interpret the underlying mechanism of the acmes to be insolation-controlled (predominantly precession) latitudinal
migrations of atmospheric and oceanic fronts. We further interpret that these migrations caused changes in the hydrological cycle and circum-Atlantic rainfall and runoff (i.e., the Monsoon Hypothesis) or the amount of eddies derived from the proto-Benguela Current and/or the Agulhas retroflection (i.e., the Eddy Hypothesis). Both mechanisms link astronomical forcing of the mid-Oligocene climate system to regional or local pycno-cline (thermopycno-cline) shallowing, surface ocean hyperstratification, and the unusual increase in calcification and export productivity of the prymnesiophyte alga Braarudosphaera. We infer that the BAEs are associated with a ~2.4-Myr eccentricity minimum when the amplitude of precession is reduced (and the ~1.2-Myr obliquity cycle has a maximum amplitude). Winter monsoon conditions likely limited Braarudosphaera acmes during times with relatively higher amplitude precession cycles (i.e., ~2.4-Myr eccentricity maxima) through insuf fi-cient oceanic rainfall and/or too much surface ocean mixing (Monsoon Hypothesis) or through limited forma-tion of proto-Benguela upwelling eddies and/or limited number of Agulhas rings making it into the South Atlantic (Eddy Hypothesis). In these hypotheses, the acmes were annually amplified during the relatively wet-ter summer monsoons or when most eddies were shed, as is suggested by laminae preserved in some Braarudosphaera oozes. Hyperstratification and the development of a shallow pycnocline/thermocline that may have served as a virtual seafloor are supported by modern biogeographical distribution of Braarudosphaera and by its alternating life cycle stages. The likely need of Braarudosphaera for a real or virtual seafloor to prevent sinking during its nonmotile calcifying life cycle stage would reconcile the contrasting dis-tribution patterns of Braarudosphaera in the modern ocean (shallow water coastal settings) compared to their relatively brief and expanded oceanic distribution in the past. However, further constraints on Braarudosphaera’s life cycle are needed to be certain about a potential benthic resting stage. Until such data become available, we tentatively interpret Braarudosphaera as a hyperstratification indicator—a potential finding that may apply to other regions in the global ocean that have Braarudosphaera-rich deposits.
References
Agnini, C., Fornaciari, E., Raffi, I., Catanzariti, R., Pälike, H., Backman, J., & Rio, D. (2014). Biozonation and biochronology of Paleogene calcareous nannofossils from low and middle latitudes. Newsletters on Stratigraphy, 47(2), 131–181. https://doi.org/10.1127/0078-0421/ 2014/0042
Arhan, M., Mercier, H., & Lutjeharms, J. R. E. (1999). The disparate evolution of three Agulhas rings in the South Atlantic Ocean. Journal of
Geophysical Research, 104(C9), 20,987–21,005. https://doi.org/10.1029/1998JC900047
Backman, J., & Shackleton, N. J. (1983). Quantitative biochronology of Pliocene and early Pleistocene calcareous nannofossils from the Atlantic, Indian and Pacific Oceans. Marine Micropaleontology, 8(2), 141–170. https://doi.org/10.1016/0377-8398(83)90009-9
Bard, E., & Rickaby, R. E. M. (2009). Migration of the subtropical front as a modulator of glacial climate. Nature, 460(7253), 380–383. https://doi. org/10.1038/nature08189
Bartol, M., Pavšič, J., Dobnikar, M., & Bernasconi, S. M. (2008). Unusual Braarudosphaera bigelowii and Micrantholithus vesper enrichment in the Early Miocene sediments from the Slovenian Corridor, a seaway linking the Central Paratethys and the Mediterranean. Palaeogeography,
Palaeoclimatology, Palaeoecology, 267(1-2), 77–88. https://doi.org/10.1016/j.palaeo.2008.06.005
Billard, C., & Inouye, I. (2004). What is new in coccolithophore biology? In H. R. Thierstein & J. R. Young (Eds.), Coccolithophores–From molecular
processes to global impact (pp. 1–29). Berlin: Springer.
Boeckel, B., & Baumann, K.-H. (2004). Distribution of coccoliths in surface sediments of the south-eastern South Atlantic Ocean: Ecology, preservation and carbonate contribution. Marine Micropaleontology, 51(3-4), 301–320. https://doi.org/10.1016/j.marmicro.2004.01.001 Bolli, H. M., Ryan, W. B. F., Foresman, J. B., Hottman, W. E., Kagami, H., Langoria, J. F., et al. (1978). Initial Reports: Leg 40. In Proceedings of the
Deep Sea Drilling Project. Washington, DC: U.S. Government Printing Office.
Bolton, C. T., Stoll, H. M., & Mendez-Vicente, A. (2012). Vital effects in coccolith calcite: Cenozoic climate-pCO(2) drove the diversity of carbon
acquisition strategies in coccolithophores? Paleoceanography, 27, PA4204. https://doi.org/10.1029/2012PA002339
Bosmans, J. H. C., Drijfhout, S. S., Tuenter, E., Hilgen, F. J., & Lourens, L. J. (2015). Response of the North African summer monsoon to precession and obliquity forcings in the EC-Earth GCM. Climate Dynamics, 44(1–2), 279–297. https://doi.org/10.1007/ s00382-014-2260-z
Bosmans, J. H. C., Drijfhout, S. S., Tuenter, E., Hilgen, F. J., Lourens, L. J., & Rohling, E. J. (2015). Precession and obliquity forcing of the freshwater budget over the Mediterranean. Quaternary Science Reviews, 123, 16–30. https://doi.org/10.1016/j.quascirev.2015.06.008 Bosmans, J. H. C., Hilgen, F. J., Tuenter, E., & Lourens, L. J. (2015). Obliquity forcing of low-latitude climate. Climate of the Past, 11(10),
1335–1346. https://doi.org/10.5194/cp-11-1335-2015
Bowles, J. (2006). Data report: Revised magnetostratigraphy and magnetic mineralogy of sediments from Walvis Ridge, Leg 208 Rep. Ocean Drilling Program, College Station, TX.
Bown, P. R. (2005a). Calcareous nannoplankton evolution: A tale of two oceans. Micropaleontology, 51(4), 299–308. https://doi.org/10.2113/ gsmicropal.51.4.299
Bown, P. R. (2005b). Selective calcareous nannoplankton survivorship at the Cretaceous-Tertiary boundary. Geology, 33(8), 653–656. https:// doi.org/10.1130/G21566
Bown, P. R. (2010). Calcareous nannofossils from the Paleocene/Eocene Thermal Maximum interval of southern Tanzania (TDP Site 14).
Journal of Nannoplankton Research, 31(1), 11–38.
Bown, P. R., & Young, J. R. (1998). Techniques. In P. R. Bown (Ed.), Calcareous nannoplankton biostratigraphy (pp. 16–28). London: Kluwer Academic Publishers. https://doi.org/10.1007/978-94-011-4902-0_2
Bukry, D. (1974). Coccoliths as paleosalinity indicators—Evidence from the Black Sea. Tulsa, OK: The American Association of Petroleum Geologists.
Acknowledgments
We are grateful for the help, advice, and support we received from Richard Pearce and Wilma Wessels when taking micrographs, Linda Hinnov by provid-ing her evolutive analysis MATLAB script, Tom Chalk with plotting the sea surface salinity and nutrient data, and Arnold van Dijk with bulk stable isotope mass spectrometry. We thank Clay Kelly for providing samples and Kyoko Hagino for commenting on an early version of this manuscript. We thank Jan Backman, Kyoko Hagino, Clay Kelly, and Alyssa Peleo-Alampay for their constructive reviews, and Ellen Thomas for the editorial handling of this manu-script. We used samples provided by the Ocean Drilling Program, sponsored by the U.S. National Science Foundation and participating countries under the management of the Joint Oceanographic Institutions. We are greatly indebted to the scientists and supporting staff of ODP Leg 208. This research has been made possible through funding of NWO grant 865.10.001 (Utrecht), NERC grant NE/K014137/1 (Southampton), and European Research Council grant 617462 (Bremen). This work was carried out under the program of the Netherlands Earth System Science Centre, which isfinancially supported by the Ministry of Education, Culture and Science. All data presented in this paper are available online (www.pan-gaea.de). For the previously published benthic stable isotope records, CaCO3 estimate record, and size fraction records follow this link: https://doi.pan-gaea.de/10.1594/PANGAEA.862589. For the newly published water content record, bulk stable isotope records, and calcareous nannofossil abundance records follow this link: https://doi.pan-gaea.de/10.1594/PANGAEA.878110.