ReseaRch papeR
How common is truly benign MS in a UK population?
emma clare Tallantyre,
1,2paula c Major,
2Michael J atherton,
2W adam Davies,
2Fady Joseph,
3Valentina Tomassini,
1,2Trevor p pickersgill,
2Katharine elizabeth harding,
1,2Mark Douglas Willis,
1,2Mia Winter,
4Neil p Robertson
1,2To cite: Tallantyre ec, Major pc, atherton MJ, et al. J Neurol Neurosurg Psychiatry 2019;90:522–528. 1Division of psychological Medicine and clinical Neurosciences, cardiff University school of Medicine, cardiff, UK 2helen Durham centre for Neuroinflammation, University hospital of Wales, cardiff, UK 3Department of Neurology, Royal Gwent hospital, Newport, UK
4Department of clinical Neuropsychology, University hospital of Wales, cardiff, UK Correspondence to Dr emma clare Tallantyre, Division of psychological Medicine and clinical Neurosciences, cardiff University school of Medicine, cardiff, UK; Tallantyreec@ cardiff. ac. uk Received 11 May 2018 Revised 5 July 2018 accepted 22 July 2018 published Online First 3 september 2018
© author(s) (or their employer(s)) 2019. Re-use permitted under cc BY-Nc. No commercial re-use. see rights and permissions. published by BMJ.
AbsTrACT
Objectives The prevalence and definition of benign
multiple sclerosis (BMs) remain controversial. Most definitions are based on the expanded Disability status scale (eDss), not encompassing the wider impact of disease. The explanation for favourable outcomes remains unclear. We aim to provide a detailed characterisation of patients with low eDss scores at long disease durations.
Methods We screened a population-based registry
containing 3062 people with Ms to identify individuals with unlimited walking ability at disease durations >15 years. a representative cohort underwent detailed clinical assessment and classified as having BMs according to eDss score <3, no significant fatigue, mood disturbance, cognitive impairment or disrupted employment, and had not received a disease-modifying therapy. We determined patient-reported perceptions of Ms status and made comparisons with eDss-based definitions.
results Of 1049 patients with disease duration of
>15 years, 200 (19.1%) had most recent eDss score <4.0. Detailed contemporary clinical assessment of a representative sample of 60 of these patients revealed 48 (80%) had an eDss score of <4.0, 35 (58%) <3.0 and 16 (27%) <2.0. Only nine (15%) fulfilled our criteria for BMs; impaired cognition (57%) and effects on employment (52%) the most common causes for exclusion. Meanwhile, 33/60 (69%) patients considered their disease benign. population frequency for BMs was estimated at 2.9% (95% cI 2.0 to 4.1).
Conclusions comprehensive assessment reveals a
small minority of people with Ms who appear genuinely benign after 15 years. study of such individuals may uncover insights about disease pathogenesis. however, discrepancy between patient perception and clinician perception of BMs undermines use of the term ’benign’ in clinical settings.
bACkgrOund
Long-term epidemiological studies have consis-tently identified a modest proportion of patients for whom the impact of multiple sclerosis (MS) remains relatively small over many years, but the existence, population prevalence and patholog-ical substrate of benign MS remain controversial.1
The study of individuals with benign MS has the potential to uncover clues to mechanisms under-lying favourable outcomes in MS, provide insights into new therapeutic targets and have implica-tions for patient counselling, individual patient
management and the construct of clinical trials. Estimates of the frequency of benign MS vary widely according to the definition used. One commonly cited definition has been an Expanded Disability Status Scale (EDSS) score of ≤3 at 10 years from symptom onset, but around one quarter of patients meeting this definition accumulated further disability when followed up to 20 years.2–8
Recent studies have suggested that a low EDSS status after 15 years of MS may be a more reliable marker of benign status.6 9
Defining benign MS solely based on EDSS is also likely to be flawed. The limitations of the EDSS have been well described,10 and include a heavy
reliance on motor outcomes, and relative insensi-tivity to fatigue and cognitive or mood disturbance. Clinician-derived measurements of ability may also fail to recognise impaired social functioning such as employment status, which can be a useful surrogate functional capacity reflecting quality of life in MS, even when controlling for physical ability.11
In this study, we explore the detailed phenotype of individuals with benign MS in a population-based cohort, according to a composite definition of minimal physical disability, no significant fatigue, mood disturbance, cognitive impairment or disrup-tion to employment, in the absence of disease-mod-ifying therapy (DMT), at least 15 years after symptom onset. We compare this rigorous clinical definition with patients’ own perception of their MS and use these data to estimate population prev-alence for truly benign MS.
MeThOds data collection
The neuroinflammatory service of the Univer-sity Hospital of Wales is a tertiary referral service, supported by a network of community-based, nurse-led and primary care clinics. It serves the urban populations of Cardiff and Newport and surrounding areas of the South Wales valleys; a total population of 1.37 million.12Data on the prevalence
of MS in this population were initially collected in a cross-sectional study, ascertaining cases from primary care, community, third sector and hospital records in 1985, 1988 and 2005.13–15Clinical data
have been collected longitudinally in a systematic manner since 2002. Patients are seen by a specialist neurologist at first referral, followed up every 12 months where possible and sent an annual ques-tionnaire.16At initial assessment, data are collected
on demographic features, details of presenting symptoms and results of investigations. At all subsequent appointments, data are collected on relapses, current symptoms, disease course, therapeutic interventions and effects. Level of disability is also collected and measured by the EDSS score.17When full
neuro-logical examination is not possible, EDSS score is recorded according to patient report of walking ability and need for assis-tance, which has been shown to be highly valid for EDSS scores of 4 and above.16For the purposes of this study, any individual
who lacked recent clinical data was contacted by postal ques-tionnaire or telephone to determine relapse history and current walking ability. Data were censored on 1 January 2017.
Clinical data are stored on a secure National Health Service database.
Participants
The cohort was initially screened for individuals with MS who were recorded as having preserved ability to walk (EDSS score <4) at last clinical encounter and at least 15 years after symptom onset. Any EDSS data recorded during relapse were excluded. The criteria of EDSS score <4 was used for screening as data are reliably recorded at every patient contact, whereas lower EDSS scores are only assigned when a patient is seen in person by a clinician. Individuals who had received DMT at any time were also excluded, to allow us to identify individuals with a benign rather than treatment-modified disease profile. All of the 200 individuals who satisfied our screening criteria, except for 10 who had previously expressed a preference not to be contacted for research purposes, were considered for inclusion. The first 60 individuals to respond were invited to attend for a detailed clinical assessment. Groups assessed in person and not assessed in person were compared for any significant differences in age, sex, disease duration or last recorded EDSS score.
Clinical assessment
A structured interview was used to document relapse history, comorbid medical and psychiatric diagnoses, marital status, childbearing status and employment history. Socioeconomic status was derived from the patient’s current address using the Welsh Index of Multiple Deprivation (WIMD).18 Review of
the medical records was used to confirm the diagnosis of MS according to contemporary internationally accepted diagnostic criteria.19 Neurological examination was used to measure EDSS
score according to Neurostatus scoring.20 The Fatigue
Assess-ment InstruAssess-ment (FAI) was used to quantify fatigue.21 The Beck
Depression Index (BDI)22 was used to measure symptoms of
depression. The overactive bladder symptom and health-related quality of life questionnaire (OABq)23 was used to detect
symp-toms of bladder overactivity. MS-impact scale 29 (MSIS-29)24
was used to quantify the physical and psychological impact of disease. The nine-hole peg test (9-HPT) was used to assess arm function.25 Timed 25-foot walk, 9-HPT and Paced
Audi-tory Serial Addition Test (PASAT) were used to derive the MS functional composite using normative data from the National MS Society (NMSS) Task Force database according to published protocol.26
In order to gauge cognitive status, a battery of tests sampling the following areas was administered: perception (Visual Object and Space Perception Battery subtests 1–3 and 5–7; Birmingham Object Recognition Battery Overlapping Figures and Object Decision), estimated level of ability (Test of Premorbid Function-ing-UK; WAIS IV Similarities and Matrix Reasoning), working memory (Wechsler Adult Intelligence Scale (WAIS) IV Digit
Span and Letter–Number Sequencing), learning and memory (Brain Injury Rehabillitation Trust (BIRT) Memory and Informa-tion Processing Battery (BMIPB)), informaInforma-tion processing effi-cacy (PASAT; BMIPB), psychomotor speed (WAIS IV Coding), executive function (Delis-Kaplan Executive Function System Verbal Fluency and Color–Word Interference), language (Verbal Naming Test27; Boston Naming Test; Wide Range Achievement
Test 4 (WRAT4) Spelling) and calculation (WRAT4 Maths). A brief praxis screen was administered to gauge ideomotor and ideational apraxia.
Participants were also asked to report their own perception of their MS status (benign or non-benign) according to the following lay definition: “When referring to illness, ‘benign’
usually means a condition which has little or no harmful effects on a person. There are no complications and there is a good outcome or prognosis”.
Analysis
Employment was said to have been affected by MS when an individual retired early on ill-health grounds, worked less-than-full-time hours or changed employment as a direct result of MS. Instances where individuals chose to retire or work less than full time for other reasons were excluded. Clinically significant fatigue was defined as a FAI severity subscore >4, according to previously validated methodology.21 A BDI score
>14 was used to indicate the presence of depressive features in keeping with accepted practice.28 The OABq symptom-bother
and health-related quality of life (HRQOL) subscores were transformed into a 0–100 scale.23 Higher transformed scores on
the symptom bother scale are indicative of increasing symptom bother while higher scores on the HRQOL scale indicate better HRQOL. Data from a large sample of population controls, who had similar demographic features to our cohort (n=1434, mean age 54 years, 65% women), were used to calculate Z-scores for symptom-severity and quality-of-life scores. Either of an OABq symptom bother Z-score >1.6 or an OABq HRQOL Z-score <−1.6 was taken to indicate significant bladder overactivity. Cognitive test scores were converted to standard scores and age-corrected where possible with the exception of the PASAT, which was corrected for years in education as it is suggested that maths ability influences scores to a greater effect than age.29
Cognitive impairment was defined as two or more scores at or below the 5% percentile when compared with normative data.
There is currently no agreed EDSS cut-off for the definition of benign MS. We chose to describe the characteristics of partici-pants with EDSS scores <2, 3 and <4. Clinical and demographic variables were compared for each EDSS cut-off with respect to their more disabled counterparts using t-tests and the Mann-Whitney U statistic where parametric assumptions were violated. The χ2 statistic (with Yates continuity correction) was used to
examine associations in classifications in the group analyses for self-reported benign/not benign status. Additionally, Spear-man’s correlation was used to examine the association between self-reported benign status and EDSS. Level of significance was considered to be p ≤0.01 owing to multiple comparisons. Cohen’s kappa statistic was used to measure agreement between patient-derived and clinician-derived measures of benign MS status.
The following definition for truly benign MS was used:Dura-tion of at least 15 years from symptom onset.
► EDSS score <3.
► Has never received disease-modifying drugs.
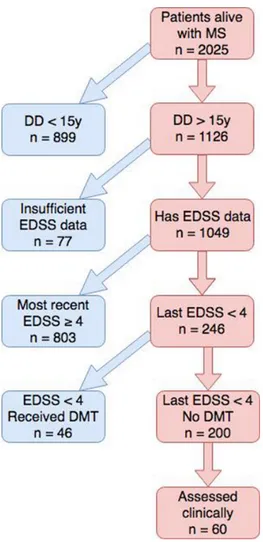
Figure 1 Flow chart illustrating cohort screening and selection. DD, disease duration; DMT, disease-modifying therapy; eDss, expanded Disability status scale; Ms, multiple sclerosis.
Table 1 Characteristics of participants according to EDSS
edss score <4 edss score <3 edss score <2 No of participants 48 35 16 Age, years 58 (9.4) 57 (9.3) 55 (9.9) Sex, n (%) female 36 (75%) 28 (80%) 13 (81%)
Disease duration, years 28 28 28
Social deprivation (WIMD rank) 1499 1490 1667
Years in education 15 15 15 Predicted IQ 108 107 109 Employment affected by MS (%) 25 (52%) 14 (40%) 5 (31%) Marital divorce (%) 18 (38%) 12 (34%) 6 (38%) Parented a child (%) 40 (83%) 27 (77%) 12 (75%) BDI score 7.7 6.4* 5.1*
FAI severity score 3.2 2.8* 2.9
MSIS-29 score 45 40* 35*
OABq symptom bother standard score 23 20 12* Number cognitively impaired (%) 27 (57%) 21 (60%) 7 (44%) Self-reported benign 33 (69%) 28 (80%)* 15 (94%)* Truly benign, n (%) 9 (19%) 9 (26%) 9 (56%) BDI >13: clinically significant depression. FAI >4 indicates clinically significant fatigue. MSIS-29: normal range, 29–145; lower scores indicate less impact. OABq: higher symptom bother score indicates more symptom bother. WIMD: 1, most deprived; 1909, least deprived.
*Statistically significant difference compared with remainder of those assessed (p<0.01).
BDI, Beck Depression Index; EDSS, Expanded Disability Status Scale; FAI, Fatigue Assessment Instrument; MS, multiple sclerosis; MSIS-29, Multiple Sclerosis Impact Scale;OABq, Overactive Bladder Questionnaire;WIMD, Welsh Index of Mass Deprivation;9-HPT, nine-hole peg test.
► No clinically significant fatigue.
► No depressive symptoms (according to BDI).
► No cognitive impairment according to our criteria.
Bladder symptoms were not included in the definition as significant bladder dysfunction was expected to contribute to the EDSS score. Data on the prevalence of truly benign MS within the individuals assessed were used to estimate prevalence within the entire South East Wales MS population.
resulTs
Records from 3062 patients registered with the regional neuroin-flammatory services since 1985 were examined. On the data censor date, 2526 patients fulfilled diagnostic criteria, had been reviewed by a study clinician, followed prospectively and had complete datasets from disease onset (figure 1). Of these cases, 2025 were alive and resident in the catchment. A total of 1126 had disease duration exceeding 15 years, of whom 1049 (93%) had relevant EDSS data. Forty-six individuals with EDSS score recorded as <4 after at least 15 years had previously received disease-modifying therapy (mean duration 3.2 years, SD 3.1). Overall, 200 individuals had an EDSS score <4 at most recent clinical encounter at least 15 years from disease onset and had not previously received a DMT. The mean interval between the most recent clinical encounter and the screening censor date was 5.0 years (SD 5.9). The 60 individuals assessed in person were 45 women and 15 men, mean age 57 years (range 39–78)
and mean disease duration 28 years (range 15–49). There were no significant differences in age, sex, disease duration or last recorded EDSS in those 60 individuals assessed in person and the 140 individuals who did not attend for clinical assessment.
benign Ms according to edss milestones after 15 years
Although the clinical cohort was selected on the basis of unlim-ited walking ability at their most recent clinical encounter, 12 out of 60 had reached an EDSS score ≥4 by the time of clinical review. Of the remaining 48 individuals, 35 had an EDSS score <3 and 16 had an EDSS score <2. Demographic and clinical features according to EDSS cut-offs are shown in table 1. There were no significant differences in sociodemographic variables between those in the EDSS score <2 or EDSS score <3 group compared with their more disabled counterparts. Less social deprivation was observed in the group with EDSS score <2 compared with those with higher EDSS, but this did not reach statistical significance at our cut-off (median WIMD rank 1667 vs 1397; p=0.04). All groups had levels of social deprivation that were below the population average (table 1).
Employment
Employment had been affected by MS in 40% of those with EDSS score <3 and 31% of those with EDSS score <2 (table 1), most commonly by the need to retire early, followed by the need to work fewer hours. Anecdotally, 10 individuals also reported that MS had directly influenced their career choice, for example, they had chosen to follow careers that they perceived to be less stressful or more flexible. Two of these individuals had EDSS score <2 and employment had otherwise been unaffected by MS.
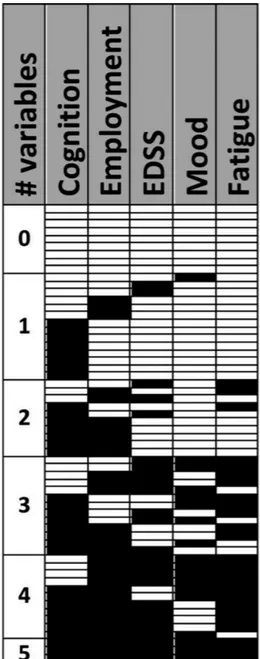
Figure 2 a representation of the clinical cohort (n=60, selected based on disease duration >15 years and no history of DMT), according to whether an individual fulfilled (white) or failed to fulfil (black) each additional criterion for truly benign Ms. cognition: no cognitive impairment according to our criteria. employment: no significant impact of Ms on employment. eDss: eDss <3. Mood: no depressive symptoms (according to BDI). Fatigue: no clinically significant fatigue. eDss, expanded Disability status scale.
Depression and fatigue
The prevalence of depressive symptoms was 6% among those with EDSS score <2 and 17% in those with EDSS score <3 (all cases were of mild or moderate depression). Scores of depression using BDI were lower in those with EDSS <2 and EDSS <3 compared with individuals who had higher disability (table 1). The rates of clinically significant fatigue were 19% for EDSS score <2 and 23% for EDSS score <3. Fatigue severity scores were also lower in those with EDSS <3 compared with more disabled counterparts (EDSS ≥3), whereas scores between EDSS <2 participants and their more disabled counterparts (EDSS ≥2), did not reach statistical significance (p=0.02, table 1). The prevalence of clinically significant bladder symptoms was 6% among those with EDSS <2% and 26% for those with EDSS <3. Overactive bladder symptom scores were lower in those with EDSS <2 vs their more disabled counterparts (p<0.001).
Cognition
The groups with EDSS scores<2 and<3 were well educated (mean 15 years in education) and were estimated to be of average range ability (table 1). Of those with EDSS score <2, 44% were deemed to have cognitive impairment; the same was true for 60% of those with EDSS score <3 (table 1). The cognitive domains that were found to be significantly weaker in those with EDSS score <3 versus normative controls were speed of processing (PASAT, p=0.007) and visual recall following distraction (p=0.003). The difference in visual learning was of borderline significance using our cut-off (p=0.011). Normative comparisons were not made for the EDSS score <2 group due to its small size.
Truly benign Ms
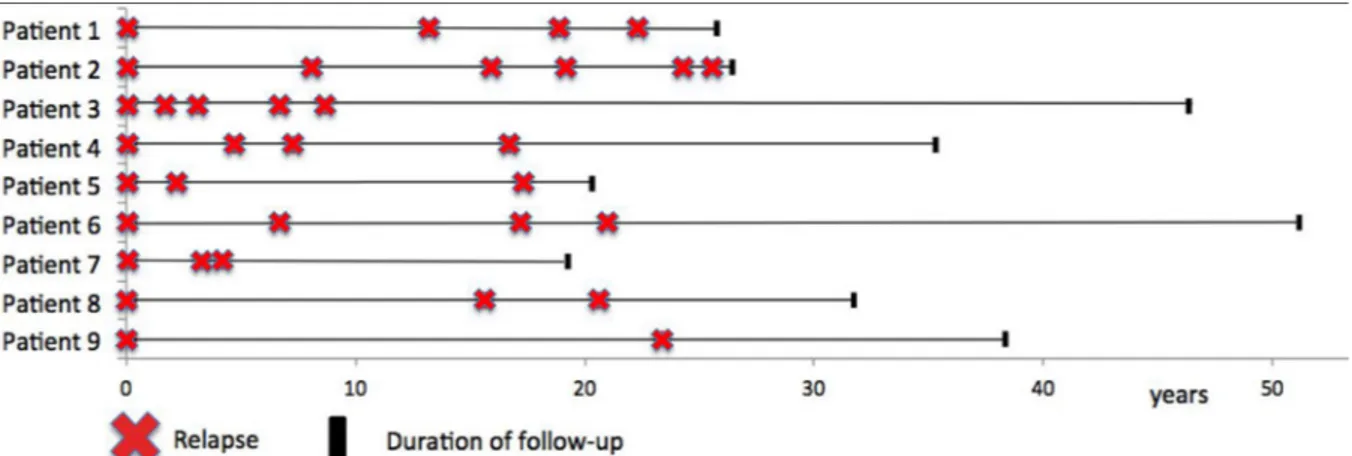
Overall, nine individuals were found to meet the criteria for truly benign MS (1M:8F). Mean age at symptom onset was 27 years (range 16–39), median EDSS score 1.5 (range 1–1.5) and mean disease duration 31 years (range 18–49). Two out of nine (22%) individuals reported comorbidity that interfered with normal activities (vs 9 out of 51 (18%) individuals who did not fulfil criteria for truly benign MS). Reasons for failing to fulfil the criteria of truly benign MS are given in figure 2. The nature of the first relapse was optic neuritis in two cases, pure sensory limb symptoms in two cases, pure motor limb symptoms in one case, brainstem syndrome in two cases and mixed motor and sensory symptoms in two cases. Eight cases experienced complete recovery from their first relapse, while one experienced residual disability. Eight out of nine patients tested had unpaired oligo-clonal bands in their cerebrospinal fluid at presentation. The relapse frequency for these nine individuals is shown in figure 3.
estimated prevalence of truly benign Ms
The prevalence of truly benign MS within the cohort individuals assessed in person in was 15% (9 out of 60). Extrapolating this figure to the cohort of eligible individuals who satisfied screening criteria (n=200, figure 1) gives an estimate of 30 people with truly benign MS out of 1049 with sufficient disease duration (2.9%; 95% CI 2.0 to 4.1).
self-reported benign Ms
Thirty-nine out of 60 (65%) individuals who underwent assess-ment reported their MS to be benign according to the lay defini-tion provided (table 2). There were no significant differences in age, disease duration, years in education, estimated ability or in number of impaired cognitive scores between those who reported
their MS was benign and those who reported their MS to be non-benign. However, self-reported benign MS was significantly associated with lower EDSS scores (p=0.001), fewer depressive symptoms (p=0.008), lower fatigue severity (p<0.0005) and lower reported MS impact (p<0.0005). Self-reported benign MS status showed poor agreement with our composite definition of benign MS status (Kappa 0.17, 95% CI 0.056 to 0.291), and only fair agreement with EDSS-based definitions of benign MS status (EDSS <3, Kappa 0.37, 95% CI 0.130 to 0.607; EDSS <2, Kappa 0.27, 95% CI 0.104 to 0.434).
disCussiOn
In this study of a population-based cohort of individuals with MS, using comprehensive clinical assessment, we identified a small
Figure 3 schematic diagram representing relapse history of 9 patients classified as having benign Ms.
Table 2 Characteristics of participants according to self-reported disease status (benign or not benign)
self-reported to be ‘benign’ Ms n=39 self-reported to be ‘not benign’ Ms n=21
Age (mean, years) 57 58
Sex 28 female (72%) 17 female (81%)
Disease duration (mean, years) 28 28
WIMD 1407 1194
No cognitively impaired 21 (54%) 12 (57%) Employment affected by MS 16 (41%) 15 (71%) Comorbidity affecting normal
activities
7 (18%) 4 (19%)
FAI severity score 3 5*
OABq symptom bother standard score
19 40*
BDI score 7 16*
EDSS (median, range) 2.0 (1.0–6.0) 3.0 (1.5–6.0)* Timed 25 foot walk (mean, s) 4.6 5.3 9-HPT dominant hand (mean, s) 21.1 22.7 MS functional composite 0.3 0.0
MSIS-29 42 69*
BDI >13: clinically significant depression. FAI >4 indicates clinically significant fatigue. MSIS-29: normal range, 29–145; lower scores indicate less impact. OABq: higher symptom bother score indicates more symptom bother; WIMD: 1, most deprived; 1909, least deprived.
*Statistically significant difference (p<0.01).
BDI, Beck Depression Index; EDSS, Expanded Disability Status Scale; FAI, Fatigue Assessment Instrument; MS, multiple sclerosis; MSIS-29, Multiple Sclerosis Impact Scale–29;OABq, Overactive Bladder Questionnaire;WIMD, Welsh Index of Mass Deprivation;9-HPT, nine-hole peg test.
proportion (estimated at 2.9%) for whom morbidity remains low at disease durations of more than 15 years. The EDSS-based definitions of benign MS significantly underestimated morbidity including fatigue, cognitive impairment and bladder symptoms. We also showed that agreement between patients and clinicians on benign MS status was lacking.
Reported rates of benign MS vary widely in the literature from 6% to 64%, depending on the definition used and popu-lation studied.2 4 30 31 EDSS-based definitions are convenient to
apply but can be relatively insensitive to morbidity. In our study, EDSS score <2 was associated with higher rates of employment, less morbidity and a more favourable patient perception of MS than EDSS score <3. We also found that all nine individuals who fulfilled the definition of truly benign MS had EDSS scores
lower than 2 (even though we had set the cut-off at EDSS <3). However, even among those with EDSS score <2 at 15 years, we observed 44% with significant cognitive dysfunction and 19% with clinically significant fatigue.
Data derived from two Italian clinic-based cohorts highlighted the insensitivity of EDSS-based definitions of benign MS to cognitive impairment, depression and fatigue.32 However, clinic
cohorts may not be representative of the wider population of patients with MS. In this study, we chose to explore benign MS in a population-based cohort, which should reduce ascertain-ment bias towards more severe cases. Over half of the patients in the Italian cohort were receiving DMT.32 We chose not to study
those who had received disease-modifying drugs, as it becomes impossible to decipher treatment effects from the natural history of the disease.
EDSS-based definitions also lack any measure of functional capacity. Of those with EDSS score <2 after 15 years, 31% reported that MS had negatively affected their ability to work. Previous studies have demonstrated high rates of early retirement from work in individuals with MS, and that many of those who remain in work require temporary absence, changes in working hours or changes in responsibilities.33–35 Fatigue, depression and
cognitive impairment appear to contribute, independently from physical disability, to employment status.35 A high proportion
of individuals with MS who are unemployed would prefer to be in work,36 and unemployment is known to be associated with
lower quality of life.37 We chose to exclude reports that MS
had adversely affected career choice on the grounds that this statement was rather subjective. However, it is worth noting that two out of the nine individuals who met our definition of truly benign MS made this assertion. This reminds us that the retrospective identification of benign MS serves no benefit in allowing people to plan their lives during the early stages of MS.
Patients’ own perception of their illness is relevant to the label of benign MS. In this study, the patient-reported rate of benign MS considerably exceeded and showed poor agreement with the rate of truly benign MS. There is no accepted definition to offer patients when exploring whether they feel their MS is benign; the definition we chose incorporates the fundamental princi-ples of low impact on a person, absence of complications and a favourable outcome and is in line with definitions provided by third-party support groups.38 39 The factors underlying the
discrepancy between clinician-reported and patient-reported disease status deserves further study. In our study, patients’ report of disease status did align with their reports of disease impact (MSIS-29) and to some extent with EDSS, but patients’
perception of their disease status appeared to be driven as much by mood, fatigue and bladder function as by physical ability.
Despite the pitfalls of defining benign MS, studying those people with extremely favourable long-term outcomes may nevertheless offer insights into MS pathogenesis. Those nine individuals with truly benign MS all remained in a relapsing– remitting state after at mean disease duration of 31 years. However, only two out of nine showed disease arrest within the first decade; the remainder all continued to experience relapses well into their second or third decade of MS. Over the entire course of their illness, their relapse rates appear low, but several experienced annualised relapse rates in the first decade that would warrant DMT in a modern-day MS clinic. Future work using MRI may help to reveal the pathological substrate of the preserved ability, whether it be low lesion load, preserved brain volume or sparing of eloquent regions such as the spinal cord.
We recognise that this study has some limitations. This is not an incident cohort in the truest sense. However, detailed studies in 1985 and 2005 used a wide range of sources to identify all prevalent cases of MS, including those who had only one clinical attack.14 40 All cases identified since 2002 have had prospective
data collection, although individuals with a clinically isolated syndrome (CIS) have not been serially imaged over the entire duration of the follow-up. We, therefore, accept that a small number of individuals with CIS may have achieved late radiolog-ical evidence of dissemination in time in the absence of a second clinical attack after 15 years of follow-up.41 It is also possible that
some individuals with mild attacks may not have sought medical attention, which may lead to underestimation of the prevalence of benign MS. The 60 participants who underwent detailed clin-ical assessment did not differ significantly from the 140 indi-viduals who did not, according to several domains known to influence outcome, but it remains possible that the groups may have differed according to an untested domain. When devel-oping our definition of truly benign MS, we selected domains that are well recognised to be of relevance and importance to individuals with MS but recognise that weighting the relative importance of different domains is problematic. It is impossible to exclude an effect of comorbidity on generic symptoms such as depression or fatigue, although our data suggest that comor-bidity is not the primary driver of fatigue or depression in this cohort.
In conclusion, after detailed clinical assessment, a small minority of people with MS appear genuinely unaffected by symptoms after 15 years. The study of the individuals with extremely favourable outcomes may uncover insights about disease pathogenesis or repair. However, the insensitivity of EDSS-based definitions of benign MS and the discrepancy between patient and clinician perception of benign MS under-mine use of the term ‘benign’ in the clinical setting.
Acknowledgements The authors would like to acknowledge the participation of our patients in this study. pcM undertook this work while affiliated to cardiff University but is now affiliated to primary Mental health support services, cardiff and Vale University health Board.
Contributor ecT contributed to the conception or design of the work, the acquisition, analysis and interpretation of the data, drafting of the manuscript and provided final approval of the version published. pcM contributed to the acquisition of the data and drafting of the manuscript. MJa contributed to the acquisition of the data and drafting of the manuscript. WaD contributed to the acquisition of the data and drafting of the manuscript. FJ contributed to the acquisition of the data and drafting of the manuscript. VT contributed to the acquisition of the data and drafting of the manuscript. Tpp contributed to the acquisition of the data and drafting of the manuscript. Keh contributed to the conception or design of the work, the acquisition of the data and drafting of the manuscript. MDW contributed to the acquisition of the data and drafting of the manuscript. MW contributed to the conception or
design of the work, the acquisition, analysis and interpretation of the data, and drafting of the manuscript. NpR contributed to the conception or design of the work, the acquisition and interpretation of data, and drafting of the manuscript.
Funding This research was conducted while ecT was a Biogen Idec postdoctoral Fellow.
Competing interests None declared. Patient consent Obtained.
ethics approval This study has been approved by the south east Wales ethics committee (ref no. 05/Wse03/111).
Provenance and peer review Not commissioned; externally peer reviewed. Open access This is an Open access article distributed in accordance with the creative commons attribution Non commercial (cc BY-Nc 4.0) license, which permits others to distribute, remix, adapt, build upon this work non-commercially, and license their derivative works on different terms, provided the original work is properly cited and the use is non-commercial. see: http:// creativecommons. org/ licenses/ by- nc/ 4.0
RefeRences
1 skoog B, Runmarker B, Winblad s, et al. a representative cohort of patients with non-progressive multiple sclerosis at the age of normal life expectancy. Brain
2012;135:900–11.
2 Ramsaransing Gs, De Keyser J. Benign course in multiple sclerosis: a review. Acta Neurol Scand 2006;113:359–69.
3 hirst c, Ingram G, swingler R, et al. change in disability in patients with multiple sclerosis: a 20-year prospective population-based analysis. J Neurol Neurosurg Psychiatry 2008;79:1137–43.
4 Leray e, coustans M, Le page e, et al. ’clinically definite benign multiple sclerosis’, an unwarranted conceptual hodgepodge: evidence from a 30-year observational study.
Mult Scler 2013;19:458–65.
5 Thompson aJ, hutchinson M, Brazil J, et al. a clinical and laboratory study of benign multiple sclerosis. Q J Med 1986;58:69–80.
6 sartori a, abdoli M, Freedman Ms. can we predict benign multiple sclerosis? Results of a 20-year long-term follow-up study. J Neurol 2017;264:1068–75.
7 hawkins sa, McDonnell GV. Benign multiple sclerosis? clinical course, long term follow up, and assessment of prognostic factors. J Neurol Neurosurg Psychiatry
1999;67:148–52.
8 sayao aL, Devonshire V, Tremlett h. Longitudinal follow-up of "benign" multiple sclerosis at 20 years. Neurology 2007;68:496–500.
9 calabrese M, Favaretto a, poretto V, et al. Low degree of cortical pathology is associated with benign course of multiple sclerosis. Mult Scler 2013;19:904–11. 10 Meyer-Moock s, Feng Ys, Maeurer M, et al. systematic literature review and validity
evaluation of the expanded disability status scale (eDss) and the multiple sclerosis functional composite (MsFc) in patients with multiple sclerosis. BMC Neurol
2014;14:58.
11 Miller a, Dishon s. health-related quality of life in multiple sclerosis: the impact of disability, gender and employment status. Qual Life Res 2006;15:259–71. 12 statsWales. population estimates by local health boards and year. https:// statswales.
gov. wales/ catalogue/ population- and- Migration/ population/ estimates/ Local- health- Boards/ populationestimates- by- welshhealthboard- year (accessed 20 Jul 2006). 13 swingler RJ, compston Da. The prevalence of multiple sclerosis in south east Wales. J
Neurol Neurosurg Psychiatry 1988;51:1520–4.
14 poser cM, paty DW, scheinberg L, et al. New diagnostic criteria for multiple sclerosis: guidelines for research protocols. Ann Neurol 1983;13:227–31.
15 hirst c, Ingram G, pickersgill T, et al. Increasing prevalence and incidence of multiple sclerosis in south east Wales. J Neurol Neurosurg Psychiatry 2009;80:386–91. 16 Ingram G, colley e, Ben-shlomo Y, et al. Validity of patient-derived disability and
clinical data in multiple sclerosis. Mult Scler 2010;16:472–9.
17 Kurtzke JF. Rating neurologic impairment in multiple sclerosis: an expanded disability status scale (eDss). Neurology 1983;33:1444–52.
18 Welsh Index of Multiple Deprivation. http:// gov. wales/ statistics- and- research/ welsh- index- multiple- deprivation/? lang= en (accessed 1 Jun 2017).
19 polman ch, Reingold sc, Banwell B, et al. Diagnostic criteria for multiple sclerosis: 2010 revisions to the McDonald criteria. Ann Neurol 2011;69:292–302.
20 Kappos L, D’souza M, Lechner-scott J, et al. On the origin of Neurostatus. Mult Scler Relat Disord 2015;4:182–5.
21 schwartz Je, Jandorf L, Krupp LB. The measurement of fatigue: a new instrument. J Psychosom Res 1993;37:753–62.
22 Beck aT. Beck Depression Inventory. san antonio: psychological corporation, 1993. 23 coyne K, Revicki D, hunt T, et al. psychometric validation of an overactive bladder
symptom and health-related quality of life questionnaire: the OaB-q. Qual Life Res
2002;11:563–74.
24 hobart J, Lamping D, Fitzpatrick R, et al. The multiple sclerosis impact scale (MsIs-29): a new patient-based outcome measure. Brain 2001;124(pt 5):962–73.
25 Mathiowetz V, Weber K, Kashman N, et al. adult norms for a commercially available Nine hole peg Test for finger dexterity. Am J Occup Ther 1985;5:24–38.
26 Fischer Js, Jak aJ, Rudick Ra. MsFc scoring manual. http:// main. nationalmssociety. org/ docs/ hOM/ MsFc_ Manual_ and_ Forms. pdf (accessed 10 aug 2016).
27 Yochim Bp, Beaudreau sa, Kaci Fairchild J, et al. Verbal naming test for use with older adults: development and initial validation. J Int Neuropsychol Soc 2015;21:239–48. 28 Beck aT, steer Ra, Ball R, et al. comparison of Beck Depression Inventories-Ia and -II
in psychiatric outpatients. J Pers Assess 1996;67:588–97.
29 Tombaugh TN. a comprehensive review of the paced auditory serial addition test (pasaT). Arch Clin Neuropsychol 2006;21:53–76.
30 Glad sB, aarseth Jh, Nyland h, et al. Benign multiple sclerosis: a need for a consensus.
Acta Neurol Scand Suppl 2010;122:44–50.
31 costelloe L, Thompson a, Walsh c, et al. Long-term clinical relevance of criteria for designating multiple sclerosis as benign after 10 years of disease. J Neurol Neurosurg Psychiatry 2008;79:1245–8.
32 amato Mp, Zipoli V, Goretti B, et al. Benign multiple sclerosis: cognitive, psychological and social aspects in a clinical cohort. J Neurol 2006;253:1054–9.
33 sundström p, Nyström L, svenningsson a, et al. sick leave and professional assistance for multiple sclerosis individuals in Västerbotten county, northern sweden. Mult Scler
2003;9:515–20.
34 Moore p, harding Ke, clarkson h, et al. Demographic and clinical factors associated with changes in employment in multiple sclerosis. Mult Scler 2013;19:1647–54. 35 Ruet a, Deloire M, hamel D, et al. cognitive impairment, health-related quality of life
and vocational status at early stages of multiple sclerosis: a 7-year longitudinal study.
J Neurol 2013;260:776–84.
36 Johnson K, amtmann D, Verrall a. symptoms and quality of life of adults with multiple sclerosis by employment status. Mult Scler J 2012;18:339–40.
37 Wahl aK, Rustøen T, hanestad BR, et al. Quality of life in the general Norwegian population, measured by the Quality of Life scale (QOLs-N). Qual Life Res
2004;13:1001–9.
38 Ms society. Benign Ms. 2018. https://www. mssociety. org. uk/ what- is- ms/ types- of- ms/ benign- ms (accessed 20 Jan 2018).
39 National Ms society. Benign Ms. 2018. https://www. nationalmssociety. org/ For- professionals/ clinical- care/ about- Ms/ Disease- courses (accessed 20 Jan 2018). 40 McDonald WI, compston a, edan G, et al. Recommended diagnostic criteria for
multiple sclerosis: guidelines from the International panel on the diagnosis of multiple sclerosis. Ann Neurol 2001;50:121–7.
41 chard DT, Dalton cM, swanton J, et al. MRI only conversion to multiple sclerosis following a clinically isolated syndrome. J Neurol Neurosurg Psychiatry