ORIGINAL ARTICLE
Pathobiological implications of the d16HER2 splice variant
for stemness and aggressiveness of HER2-positive
breast cancer
L Castagnoli1,7, GC Ghedini1,7, A Koschorke1, T Triulzi1, M Dugo2, P Gasparini3, P Casalini1, A Palladini4, M Iezzi5, A Lamolinara5, PL Lollini4, P Nanni4, C Chiodoni6, E Tagliabue1and SM Pupa1
We have previously shown that the d16HER2 splice variant is linked to HER2-positive breast cancer (BC) tumorigenesis, progression and response to Trastuzumab. However, the mechanisms by which d16HER2 contributes to HER2-driven aggressiveness and targeted therapy susceptibility remain uncertain. Here, we report that the d16HER2-positive mammary tumor cell lines MI6 and MI7, derived from spontaneous lesions of d16HER2 transgenic (tg) mice and resembling the aggressive features of primary lesions, are enriched in the expression of Wnt, Notch and epithelial–mesenchymal transition pathways related genes compared with full-length wild-type (WT) HER2-positive cells (WTHER2_1 and WTHER2_2) derived from spontaneous tumors arising in WTHER2 tg mice. MI6 cells exhibited increased resistance to anoikis and significantly higher mammosphere-forming efficiency (MFE) and self-renewal capability than the WTHER2-positive counterpart. Furthermore, d16HER2-positive tumor cells expressed a higher fraction of CD29High/CD24+/SCA1Lowcells and displayed greater in vivo tumor engraftment in serial dilution conditions than WTHER2_1 cells. Accordingly, NOTCH inhibitors impaired mammosphere formation only in MI6 cells. A comparative analysis of stemness-related features driven by d16HER2 and WTHER2 in ad hoc engineered human BC cells (MCF7 and T47D) revealed a higher MFE and aldehyde dehydrogenase-positive staining in d16HER2- vs WTHER2-infected cells, sustaining consistent BC-initiating cell
enrichment in the human setting. Moreover, marked CD44 expression was found in MCF7_d16 and T47D_d16 cells vs their WTHER2 and Mock counterparts. Clinically, BC cases from two distinct HER2-positive cohorts characterized by high levels of expression of the activated-d16HER2 metagene were significantly enriched in the Notch family and signal transducer genes vs those with low levels of the metagene.
Oncogene (2017)36, 1721–1732; doi:10.1038/onc.2016.338; published online 19 September 2016
INTRODUCTION
HER2 overexpression or amplification delineates a HER2-positive breast cancer (BC) subgroup characterized by a high mitotic index and an elevated metastatic potential and is considered intrinsically heterogeneous, both biologically and genetically.1,2 Indeed, emerging evidence suggests that the co-existence of the full-length/wild-type (WT) HER2 oncoprotein (WTHER2) with altered forms of HER2, such as carboxy-terminal truncated fragments,3 activating mutations4 or alternative splice variants,5 significantly increases the heterogeneity of HER2-positive disease, affecting its biology, clinical course and treatment response.6It is well known that alternative splicing affords a significant evolutionary advan-tage by providing a large source of proteomic diversity and can be aberrantly regulated by cancer cells to their advantage, with aberrant splicing of proto-oncogenes producing constitutively active or even gain-of-function variants that confer survival or proliferative abilities.5,6
Along with others, we have reported that BC patients and HER2-positive human cancer cell lines constitutively express a splice variant of the HER2 gene characterized by the lack of exon 16 (d16HER2).7–9 This deletion promotes the generation of a particularly aggressive HER2 isoform that forms stable and constitutively activated d16HER2 homodimers (pd16HER2D) on the tumor cell surface and couples with activated SRC (pSRC) kinase.10–14 Our comparison of the tumorigenic potential of
human d16HER211and WTHER215in the corresponding transgenic (tg) mouse models clearly pointed to the candidacy of d16HER2 as a ‘driver’ of human HER2-positive BC,13 a finding very recently
supported by others in different d16HER2 and full-length HER2 tg mouse models.14 Furthermore, we provided insights into the functional relationship between pd16HER2D and pSRC in pre-clinical and pre-clinical settings. Human HER2-positive BCs expressing significantly higher levels of d16HER2 and pSRC, defined as cases with high ‘activated-d16HER2 metagene’ expression, were sig-nificantly enriched in hypoxia, tumor metastasis and cell motility
1
Molecular Targeting Unit, Department of Experimental Oncology and Molecular Medicine, Fondazione IRCCS Istituto Nazionale dei Tumori, Milan, Italy;2Functional Genomics and Bioinformatics Core Facility, Department of Experimental Oncology and Molecular Medicine, Fondazione IRCCS Istituto Nazionale dei Tumori, Milan, Italy;3
Tumor Genomics Unit, Department of Experimental Oncology and Molecular Medicine, Fondazione IRCCS Istituto Nazionale dei Tumori, Milan, Italy;4Laboratory of Immunology and Biology of Metastases, Department of Experimental, Diagnostic and Specialty Medicine, University of Bologna, Bologna, Italy;5
CESI Aging Research Center, Department of Medicine and Aging Sciences, G D'Annunzio University, Via Colle dell'Ara, Chieti Scalo, Chieti, Italy and6
Molecular Immunology Unit, Department of Experimental Oncology and Molecular Medicine, Fondazione IRCCS Istituto Nazionale dei Tumori, Milan, Italy. Correspondence: Dr SM Pupa, Molecular Targeting Unit, Department of Experimental Oncology and Molecular Medicine, AmadeoLab, Fondazione IRCCS Istituto Nazionale dei Tumori, Via Venezian 1, Via Amadeo 42, Milan 20133, Italy.
E-mail: [email protected]
7
These authors contributed equally to this work.
Received 24 June 2016; accepted 5 August 2016; published online 19 September 2016
pathways, suggesting more epithelial–mesenchymal transition (EMT) and tumor stemness features than in BCs with low levels of the ‘activated-d16HER2 metagene’.13 In this context, previously reported in vitro evidence showed that the ectopic expression of d16HER2 in human engineered cellular models significantly favors both migration/invasion and proliferation compared with WTHER2-positive cellular counterparts10,12 and the upregulated expression of mesenchymal markers.12,14
Emerging data suggest that the clinical efficacy of molecularly targeted therapies is related to their ability to target BC-initiating cells (BCICs), a population that is not only self-sustaining but that also contributes to tumor growth, aggressiveness and metastasis.16Current
evidence indicates that HER2 is an important regulator of BCICs in HER2-positive BCs and that anti-HER2 therapies effectively target BCICs.16–19From this perspective, we reported that HER2-positive BCs expressing an‘activated-d16HER2 metagene’ were found to derive the greatest benefit from Trastuzumab treatment in the adjuvant setting,13in which targeting BCICs is crucial. To examine the possibility that expression/activation of the d16HER2 variant is increased/ predominant in BCICs of HER2-positive tumors, we tested whether the constitutive and ectopic expression of the d16HER2 splice variant sustains/favors stemness and aggressiveness/EMT programs vs the WT full-length HER2 molecule in HER2-positive BC.
Overall, the presentfindings point to a role for the d16HER2 variant in governing the EMT program and maintenance/expansion of BCICs in HER2-positive BCs. Moreover, the inhibition of mammosphere formation observed in d16HER2-positive cells upon treatment with two specific Notch inhibitors and the clinical evidence of Notch pathway enrichment in HER2-positive BC patients whose tumors are enriched in the ‘activated-d16HER2 metagene’ suggest that the reported cross-talk between HER2 and NOTCH pathways19–22is mainly driven by activation of the pd16HER2D and pSRC signaling axis as the mechanism supporting/regulating stemness.
Taken together, these observations suggest that the d16HER2 variant guides a key oncogenic signal that has a significant impact in HER2-driven BC stemness and tumorigenesis vs its full-length form.
RESULTS
Characterization of d16HER2-positive (MI6 and MI7) and WTHER2-positive (WTHER2_1 and WTHER2_2) tumor cell lines
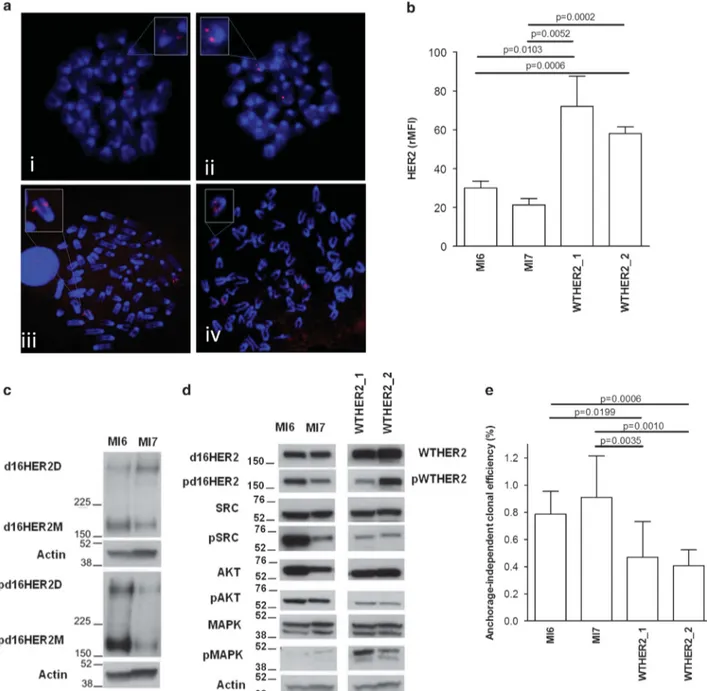
To better understand the pathobiological role of the d16HER2 variant vs the WTHER2 form in HER2-positive BC, we generated cellular models named MI6, MI7, WTHER2_1 and WTHER2_2 from spontaneous primary mammary lesions that developed in the corresponding tg animals.13 Fluorescence in situ hybridization analysis of HER2 genetic status in MI6, MI7, WTHER2_1 and WTHER2_2 tumor cells revealed a single signal from both metaphase and interphase nuclei on 2 chromosomes in both d16HER2-positive cell lines (Figure 1a, i and ii, magnified insets), whereas clusters of amplified signals were identified within 2–3 chromosomes in both WTHER2-positive cell lines (Figure 1a, iii and iv, magnified insets). Cytogenetic analysis revealed diploid karyotypes (40 chromosomes) in d16HER2-positive cells compared with the near-tetraploid karyotypes (76–88 chromosomes) observed in WTHER2 cells, consistent with previous observations in spontaneous tumors.13 Fluorescence-activated cell sorting (FACS) analysis confirmed that the relative median fluorescence intensity of MI6 and MI7 cells indicated significantly lower levels of HER2 than in WTHER2_1 and WTHER2_2 cells (Figure 1b). Western blot analysis of MI6, MI7, WTHER2_1 and WTHER2_2 cell protein extracts showed that basal d16HER2 homodimers (d16HER2D) were expressed and phosphorylated (p) (pd16HER2D) in d16HER2 cells13 (Figure 1c). In WTHER2_1 and WTHER2_2 cells, the signal transduction of pWTHER2 was mainly coupled to elevated levels of the p-mitogen-activated protein kinases (pMAPK) and, to a lesser
extent, to pAKT and pSRC (Figure 1d, right), which, conversely, were found to be mostly functional in MI6 and MI7 cells (Figure 1d, left). Analyses of anchorage-independent clonal efficiency indicated the significantly greater ability of d16HER2 cells to grow in three-dimensional (3D) culture conditions (Figure 1e). Overall, these distinctive cellular properties confirmed the suitability of the isolated d16HER2- and WTHER2-positive cell lines to mirror the in vivo aggressiveness of the two models.13
Molecular analyses of d16HER2- and WTHER2-positive tumor cell lines
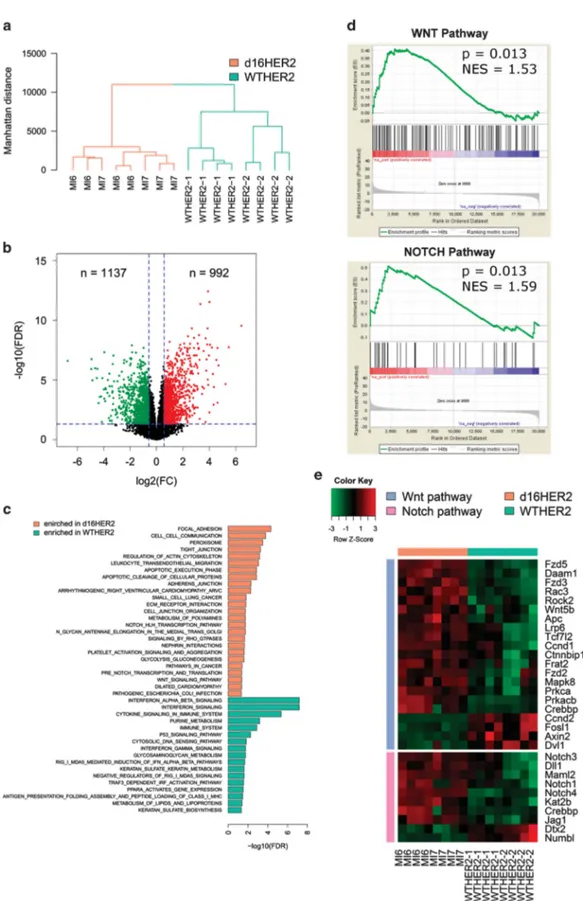
To investigate the molecular mechanism underlying the higher d16HER2- vs WTHER2-driven aggressiveness, we examined whole-gene expression profiles of d16HER2- and WTHER2-positive cell lines. Unsupervised hierarchical clustering using the top 5000 most variable genes showed that d16HER2 and WTHER2 cells clustered in two well-discrete branches, indicating distinct transcriptional profiles between the two classes (Figure 2a). Differential expression analysis highlighted 992 and 1137 genes significantly up- and downregulated in d16HER2 cells compared with WTHER2 samples, respectively (Figure 2b). Functional annotation revealed that genes upregulated in MI6 and MI7 cells were significantly enriched (false discovery rate o0.05) for pathways related to stemness, EMT, migration and invasion (Figure 2c and Supplementary Table S2A). Pathways including genes associated with p53 signaling, inflammation and the immune response were enriched in WTHER2_1 and WTHER2_2 cells (Figure 2c and Supplementary Table S2B). Based on these and previous 13 molecular results, we tested whether d16HER2-positive cells were further enriched in tumor-initiating genes compared with WTHER2-positive cells. To this aim, we applied Gene Set Enrichment Analysis (GSEA) using four ad hoc gene sets, including genes of the Wnt, mTOR, Notch and Hedgehog pathways, known to govern normal and cancer stemness23(Supplementary Table S1). We found a significant positive enrichment of Wnt and Notch gene sets in d16HER2 vs WTHER2 counterparts (Figure 2d). Indeed, several genes belonging to these two gene sets were differentially expressed between the two cell types, and the majority was upregulated in d16HER2 cells (Figure 2e).
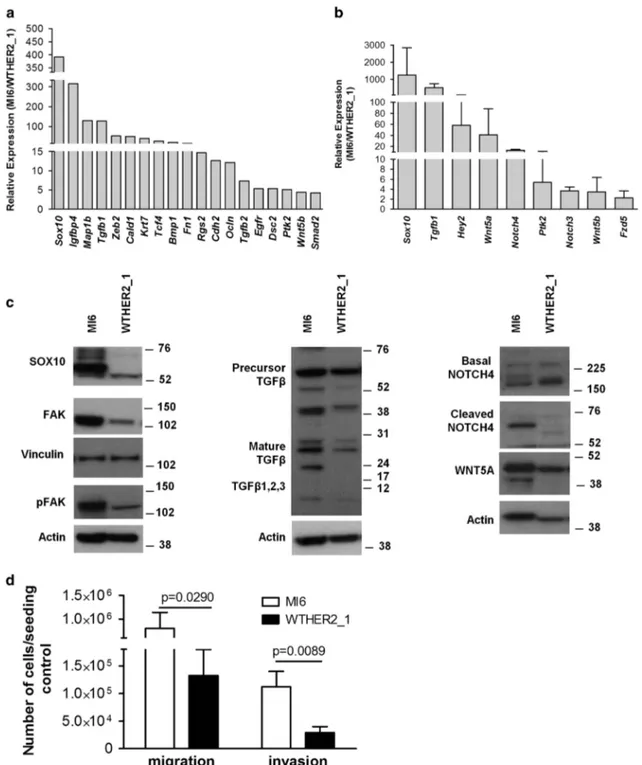
In light of the significant biological and molecular similarity occurring between MI6 and MI7 cells vs WTHER2_1 and WTHER2_2 cells and based on the highest in vitro stability of MI6 vs MI7 cells and WTHER2_1 vs WTHER2_2 cells, we validated previousfindings using MI6 and WTHER2_1 tumor cells as the best representative in vitro models of the corresponding in vivo tg animals.13Thus, based on evidence that the Wnt and Notch pathways are also involved in the EMT program,24 we used a commercial array to analyze the expression of EMT-related genes in MI6 and WTHER2_1 cells. Of 84 genes included in the platform, 19 were expressed in MI6 cells at levels44-fold those in WTHER2_1 cells (Figure 3a), whereas only 6 transcripts (Vim, Bmp7, Fgfbp1, Tmeff1, Wnt11 and Gsc) were upregulated in WTHER2_1 cells (data not shown). To validate the identity of the potential gene pathways contributing to the highly aggressive d16HER2-driven tumor phenotype, we used quantitative reverse transcriptase–PCR analysis to analyze the expression of several EMT and stemness-related transcripts, such as Sox10, Tgfb1, Hey2, Wnt5a, Notch4, Ptk2, Notch3, Wnt5b and Fzd5, which were found to be upregulated either in the gene expression profile or in the EMT array assay (Figure 3b). Furthermore, we validated microarray and EMT array results at the protein level and found higher levels of SOX10, TGFβ1, WNT5A, FAK (Ptk2) and pFAK, NOTCH4 and its cleaved form in MI6 cells than WTHER2_1 cells (Figure 3c). As the EMT/stemness programs are reportedly associated with cancer cell motility,25we compared the invasive ability of MI6 vs
WTHER2_1 cells and found that d16HER2-positive cells migrated and invaded significantly more efficiently than WTHER2_1 cells (Figure 3d).
d16HER2 sustains breast tumor stemness L Castagnoli et al
Analysis of the stemness of d16HER2- and WTHER2-positive tumor cells
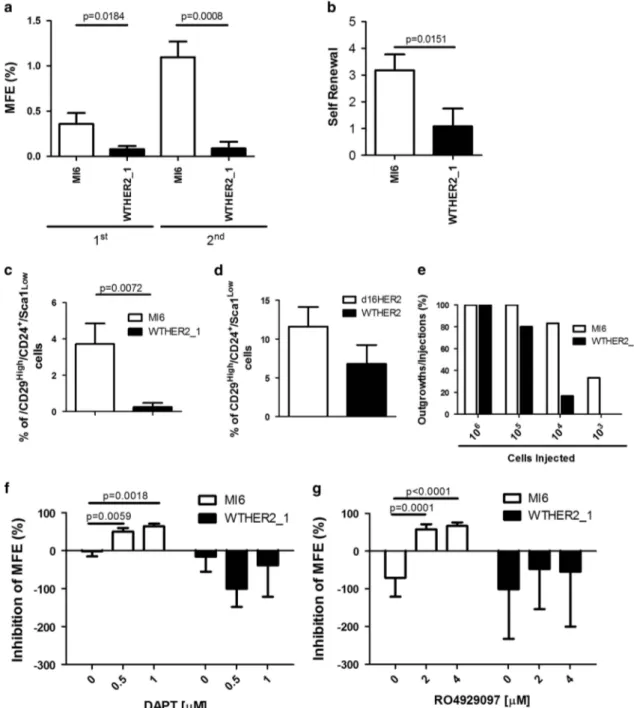
To further test the potential role of d16HER2 in sustaining stemness of HER2-positive BC, wefirst evaluated the mammosphere-forming efficiency (MFE) of MI6 vs WTHER2_1 cells. We found that the MFE of MI6 cells was significantly higher in both the first (1st) and second (2nd) mammosphere generation passages compared with WTHER2_1 cells (Figure 4a), allowing MI6 cells to undergo
self-renewal more efficiently than WTHER2_1 cells (Figure 4b). Moreover, MI6 cells were differentially enriched in BCICs compared with WTHER2_1 cells, as demonstrated by multiparametricflow cytometry analysis to assess the relative frequency of CD29High/CD24+/SCA1Low
cells, a subset reportedly enriched in murine mammary stem cells.26 The results from three independent experiments revealed that the frequency of CD29High/CD24+/Sca1Lowcells was 3.7% ± 0.6% in MI6 cells and 0.2% ± 0.2% in WTHER2_1 cells (Figure 4c). We also tested
Figure 1. Characterization of d16HER2- and WTHER2-positive cell lines. (a) Fluorescence in situ hybridization (FISH) analyses of metaphases spreads obtained from MI6 (i), MI7 (ii), WTHER2_1 (iii) and WTHER2_2 (iv) tumor cell lines. (b) FACS analysis of MI6, MI7, WTHER2_1 and WTHER2_2 tumor cells stained with the PE-conjugated anti-HER2 antibody CD340. The results are the mean± s.d. (n = 3). (c, d) Western blotting analyses of the signal transduction axis downstream of d16HER2 (c, d, left) and WTHER2 (d, right) forms. (c) Protein extracts from MI6 and MI7 cell lines were separated by 3–8% gradient SDS–PAGE under non-reducing conditions and probed with anti-HER2 (d16HER2M and D) and anti-phosphoHER2 (pd16HER2M and D) antibodies. (d) Left, the same protein extracts were separated by 4–12% gradient SDS–PAGE under reducing conditions to evaluate the basal and activation status (p) of d16HER2M, SRC, AKT and MAPK. (d) Right, protein extracts from WTHER2_1 and WTHER2_2 cells were separated by 4–12% gradient SDS–PAGE under reducing conditions to evaluate the basal and activation status (p) of WTHER2, SRC, AKT and MAPK. Actin was used to normalize protein loading. Autoradiographs of the left and right panels were acquired at different exposure times to obtain optimal image resolution. (e) Anchorage-independent clonal efficiency (%) of MI6 (n = 6), MI7 (n= 9), WTHER2_1 (n = 10) and WTHER2_2 (n = 7) cells after 15 days of 3D cell culture. The results are the mean ± s.d. Significance was calculated by a two-tailed unpaired t-test.
Figure 2. Molecular analyses of d16HER2- and WTHER2-positive cell lines. (a) Dendrogram obtained from hierarchical clustering of MI6, MI7, WTHER2_1 and WTHER2_2 tumor cell lines based on the expression of the top 5000 most variable genes. (b) Volcano plot of log2fold changes vs–log10false discovery rate (FDR) showing transcriptional differences between d16HER2 and WTHER2 cells. Vertical dashed lines represent the 1.5-fold change cut-off and the horizontal dashed line denotes the 0.05 FDR cut-off. Up- and downregulated genes are highlighted in red and green, respectively. (c) Bar plot showing significantly enriched KEGG and REACTOME pathways in genes upregulated in MI6 and MI7 (orange bars) or WTHER2_1 and WTHER2_2 cells (green bars). (d) GSEA enrichment plots of Wnt and Notch gene sets in d16HER2 cells compared with WTHER2. NES, normalized enrichment score. (e) Heatmap showing the expression in d16HER2 and WTHER2 cells of differentially expressed genes included in the Wnt and Notch gene sets.
d16HER2 sustains breast tumor stemness L Castagnoli et al
the frequency of CD29High/CD24+/SCA1Low cells in the HER2-positive-gated fraction of d16HER2 (n = 4) and WTHER2 (n = 3) disaggregated spontaneous tg primary lesions (Supplementary Figure S1) and found a mean frequency of 11.6% ± 1.3% and 6.8% ± 2.4%, respectively, supporting a role for d16HER2 in sustaining HER2 BC stemness ‘in vivo’ (Figure 4d). In addition,
analysis of the tumor-forming ability of both cell lines in syngeneic FVB mice injected with MI6 or WTHER2_1 cells at different multiplicities showed a significantly increased MI6 in vivo tumor uptake vs WTHER2_1 cells (Figure 4e and Supplementary Table S3). In particular, we observed that as few as 103MI6 cells were able to grow in 33% of injected mice, whereas WTHER2_1 cells
Figure 3. Differential expression of EMT- and stemness-related genes and proteins in MI6 and WTHER2_1 cells and invasiveness properties. (a) Analysis of EMT and stem cell-related genes differentially expressed (fold) in MI6 vs WTHER2_1 cells as shown by the Mouse EMT RT22Profiler PCR Array. Changes in gene expression were analyzed by SABioscience software (SABiosciences, Qiagen, Hilden, Germany) using GAPDH for normalization. (b) Quantitative reverse transcriptase (qRT)–PCR validation of the differential expression of genes involved in EMT and stemness. The data are the mean± s.d. (n = 2) and given as fold increase of relative expression in MI6 vs WTHER2_1 cells (MI6/WTHER2_1). (c) Western blot analyses of MI6 and WTHER2_1 protein extracts separated by 4–12% gradient SDS–PAGE under reducing conditions to evaluate SOX10, basal and activated FAK (pFAK), TGFβ, basal and cleaved NOTCH4 and WNT5A proteins. Vinculin and Actin were used to normalize protein loading. Autoradiographs were acquired at different exposure times to obtain optimal image resolution. (d) Migration and invasion capability of MI6 and WTHER2_1 cells. The results are the mean± s.d. (n = 3). Significance was calculated by a two-tailed unpaired t-test.
developed tumors in 17% of injected mice only at a higher (104) cell multiplicity (Supplementary Table S3). In addition, the extreme limiting dilution assay estimated a 410-fold increase in BCICs frequency in MI6 (1/4,601) vs WTHER2_1 cells (1/61,573) (Supplementary Table S3), providing further evidence for enrich-ment of a BCIC sub-population in d16HER2-positive cells. In keeping with the sharp evidence of NOTCH4 activation in MI6 vs WTHER2_1 cells cultured in adhesion conditions (Figure 3c), we evaluated the potential role of the Notch pathway in the
increased ability of MI6 vs WTHER2_1 cells to form mammo-spheres. We treated MI6 and WTHER2_1 spheres with DAPT (N-{N-(3,5-difluorophenacetyl)-L-alanyl}-S-phenylglycine t-butyl ester)
(Figure 4f) or RO4929097 (Figure 4g), two different γ-secretase inhibitors that specifically block the cleavage of NOTCH family members and thereby inhibit generation of the active intracellular domain.27Both agents significantly reduced the MFE only in MI6
cells (Figures 4f and g).
Figure 4. Comparison of stemness features in MI6 and WTHER2_1 cells and in spontaneous primary mammary lesions. (a) First and second mammosphere generation by MI6 and WTHER2_1 cells evaluated as MFE (%). (b) Self-renewal in MI6 and WTHER2_1 cells. The results in a and b are the mean± s.d. (n = 3). (c, d) Multiparametric FACS analysis of the CD29High/CD24+/SCA1Lowstem cell subset in MI6 and WTHER2_1 cells and in spontaneous primary mammary lesions from tg d16HER2 (n= 4) and WTHER2 (n = 3) mice. All analyses were performed after gating live cells according to SSC and FSC parameters only in the HER2-positive tumor cell subset. (e) Tumor-forming ability (outgrowths/injections %) of MI6 and WTHER2_1 cells injected at different serial dilutions starting from 106to 10 cells into the mammary fat pad of parental FVB mice (n= 12 for each animal group except for 105and 103 WTHER2_1 cell dilutions, n= 10). (f, g) MFE inhibition (%) in MI6 and WTHER2_1 mammospheres treated with DAPT (0.5 and 1μM) (e) and RO4929097 (2 and 4μM) (f). The results are the mean± s.d. (n = 3). Significance was calculated by a two-tailed unpaired t-test.
d16HER2 sustains breast tumor stemness L Castagnoli et al
Analysis of the stemness of d16HER2- and WTHER2-engineered human BC cells
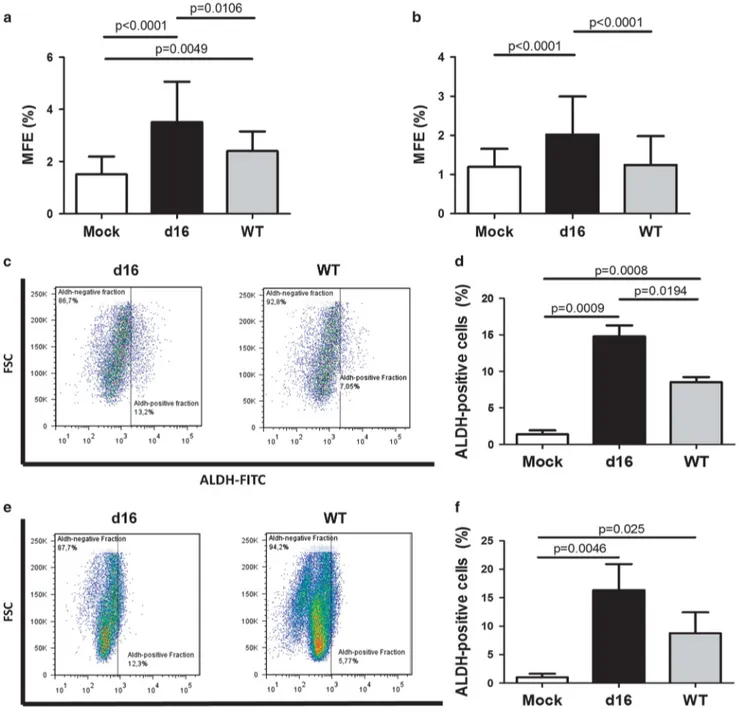
To address the candidacy of d16HER2 as the main factor of HER2-driven stemness vs the full-length receptor, we compared their effects in the enrichment of human BCIC frequency and infected MCF7 and T47D cells with viral vectors encoding d16HER2 or WTHER2 genes. We generated bulk cell populations named MCF7_d16, T47D_d16 and MCF7_WT, T47D_WT to express higher levels of d16HER2 and/or WTHER2 transcripts/proteins, respectively, vs their basal levels expressed in the Mock counterparts (MCF7-Mock and T47D-(MCF7-Mock) infected with the empty viral vector (Supplementary Figures S2A and B left and right). First, we measured the relative expression of d16HER2 and WTHER2 genes in transduced cell lines (Supplementary Figure S2A, left and right). The increased mRNA levels coupled to the corresponding upregulation of the d16HER2 and WTHER2 proteins in all infected cell models vs their Mock counterparts (Supplementary Figure S2B, left and right). Interestingly, cytogenetic analyses revealed the same triploid karyotypes in all tested tumor cell lines independent of the transgene inserted (Supplementary Figure S2C). To evaluate stem cell enrichment in human cell models, we tested their ability to generate mammospheres (Figures 5a and b) and stained the cells for aldehyde dehydrogenase (ALDH) (Figures 5c–f) using the diethylaminobenzaldehyde, a specific inhibitor of ALDH, to control the backgroundfluorescence (Supplementary Figures S3A and B). The MFE of d16HER2- and WTHER2-engineered MCF7 (Figure 5a) and T47D (Figure 5b) cells was always significantly higher in d16HER2 cells vs their WTHER2- and Mock-engineered cell counterparts, supporting that the d16HER2 variant sustains a more consistent BCIC enrichment vs the WTHER2 receptor in the human setting. A comparative analysis of the percentage (%) of ALDH-positive cells, a cell subset that displays features of stem cells,28in MCF7-d16 (Figure 5c, left) vs MCF7-WT cells (Figure 5c, right) and in T47D_d16 (Figure 5e, left) vs T47D_WT cells (Figure 5e, right), provided a clear evidence of an enrichment of ALDH-positive cells in d16HER2-engineered models vs WTHER2-positive and Mock cells (Figures 5d and f).
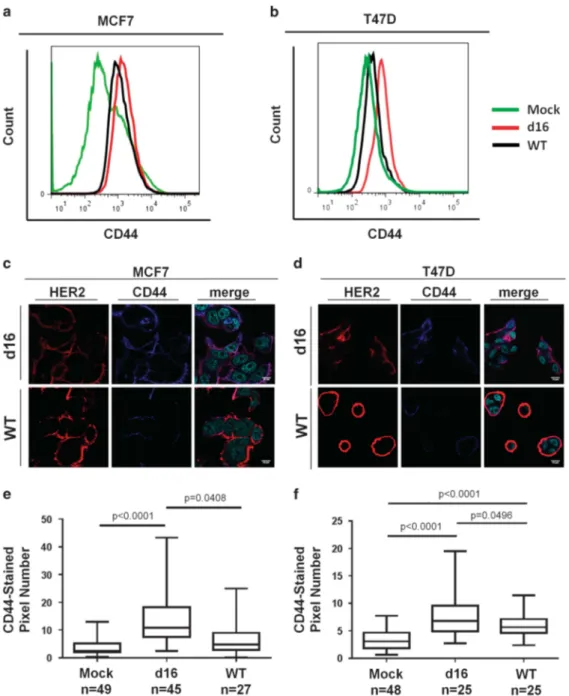
Using multiparametric FACS analyses, we also tested the expression of the membrane protein CD44 (Figures 6a and b), a specific marker of mesenchymal CIC fraction.29 In the HER2-positive cell subsets of all transduced cell models, we observed marked CD44 staining in d16HER2-positive cells compared with WTHER2-positive cells and their corresponding Mock cells (Figures 6a and b). Confocal microscopy analyses showed a higher co-expression of CD44 with d16HER2 in MCF7 and T47D cells (Figures 6c and d, upper) vs their WT-infected counterparts (Figures 6c and d, lower). In addition, we quantified the fluorescence intensity of CD44 staining in HER2-positive cell fractions of infected MCF7_d16 and T47D_d16 cells vs their corresponding WT and Mock counterparts (Figures 6e and f). The results showed significantly higher expression of CD44 in d16HER2-expressing cells vs WTHER2-positive and Mock cells.
Association of d16HER2 expression/activation with the NOTCH signaling pathway
To examine the impact of d16HER2 expression on the stemness of HER2-positive BC patients and investigate the stem cell-related signaling pathway involved in d16HER2-driven stemness, we analyzed BC cases from two distinct HER2-positive cohorts according to the levels of the ‘activated-d16HER2 metagene’.13
In particular, we studied the gene expression profile of 53 primary HER2-positive cases30 included in the GHEA study31 and 52
profiled HER2-positive cases derived from the NKI study.32
GSEA analysis using the Notch, Wnt, Hedgehog and mTOR gene lists (Supplementary Table S1) showed that Notch pathway-related genes were significantly enriched (P = 0.056, NES = 1.48 for the GHEA data set and P = 0.015, NES = 1.68 for the NKI data set; data
not shown) and highly expressed in HER2-positive BC character-ized by high levels of ‘activated-d16HER2 metagene’, compared with those with low metagene expression in the GHEA (Figure 7a) and NKI (Figure 7b) BC series. The analysis of genes described as downstream signal transducers of NOTCH receptors whose expression is indicative of pathway activation33 revealed signi fi-cantly higher levels of HEY1, HES5 and HES6 genes in cases from the GHEA cohort with elevated expression of the ‘activated-d16HER2-metagene’ vs those with low expression (Figure 7c). In the NKI cohort, HEY1, HEY2 and HES4 were highly expressed in tumors with highly ‘activated-d16HER2 metagene’ expression (Figure 7d), strongly implicating the expression/activation of the d16HER2 variant in human HER2-positive BCICs.
DISCUSSION
In this study, we provide evidence that d16HER2 variant constitutes an important HER2 isoform that sustains both the EMT program and maintenance/expansion of BCICs in HER2-positive pre-clinical and clinical BC settings. Our molecular comparison of d16HER2- and WTHER2-positive cell profiles indicates that the d16HER2 variant rather than WTHER2 receptor contributes significantly to EMT and stemness, two hallmarks of tumor initiation and progression. This finding supports the relevance of d16HER2 in the development/progression of HER2-positive BC, as also very recently observed in novel ad hoc engineered murine models.14The greater ability of d16HER2- than WTHER2-positive cells to actively proliferate in an anchorage-independent growth milieu rests in the better capacity of d16HER2 cells to confer resistance to anoikis, a physiological programmed cell death of cells detached from the extracellular matrix.34 This ability may rest, in part, in the dynamic cross-talk between d16HER2 and pSRC kinase,10–14 a signaling node that facilitates HER2-dependent soft-agar colony formation.35It is well
known that cancer cells exploit resistance to anoikis, as well as EMT and stemness,34 in disseminating and colonizing distant
organs.36 Indeed, our KEGG and REACTOME pathway analyses
revealed a significant enrichment of many cellular pathways, including those of the tight junction,37adherens junction,38focal adhesion,38Wnt39and Notch signaling,40which are all involved in tumor aggressiveness in d16HER2 cells, underscoring the power of the spliced isoform rather than full-length HER2 in regulating tumor progression and stemness. In fact, our GSEA analysis of the d16HER2 transcriptome revealed a significant enrichment of Wnt and Notch pathway-related genes, known to be aberrantly activated and to cooperate in a synchronized manner in BCICs and to contribute to activation and progression of the EMT program.25,41–43Very recently, Turpin et al.14 reported that their murine d16HER2-engineered models, referred to as ErbB2ΔEx16-expressing tumors, have several unique pathological features, including the activation of transcription factors such as Stat3, Smad2, YB-1 and HIF1α, which are known to be heavily implicated in regulating the EMT process that is involved in BC stem cell renewal. In addition, ourfindings showing a significantly higher in vitro MFE and self-renewal ability in MI6 vs WTHER2_1 cells, combined with an enrichment of cells with the CD29High/CD24+ /Sca1Low phenotype,26 support an active role for the d16HER2 variant in HER2-positive BC stemness. In keeping, in vivo self-renewal of MI6 and WTHER2_1 cells, as measured by the gold-standard limiting dilution in vivo assay,44 was significantly increased in the d16HER2-positive model. To validate these data, we showed that the ectopic expression of d16 vs WTHER2 was both necessary and sufficient to significantly increase not only the MFE but also the fraction of ALDH-positive cells in both engineered MCF7 and T47D tumor cells, thus unveiling a direct action of d16HER2 in human HER2-positive BCICs. In addition, a comparative analysis of WTHER2-infected human BC cells and their Mock counterparts showed both an increased percentage of
ALDH-positive cells and a significantly greater capability to form mammospheres in MCF7_WT cells, thus demonstrating that the full-length HER2 receptor regulates BCICs in human BC,18but to a
lesser extent than the d16HER2 splice variant. In light of reported data29indicating the co-existence of two distinct BCIC compart-ments characterized by epithelial-like (ALDH-positive) or mesenchymal-like (CD44+/CD24–) cells, we also analyzed the expression of CD44 in the HER2-positive fractions of the engineered cell lines and found a higher expression of CD44 in
d16- vs WT- and Mock-infected cells, suggesting that d16HER2 sustains two stem cell compartments. The increased expression of CD44 guided by the ectopic expression of d16HER2 provides additional evidence of the potent stemness signaling driven by d16HER2 and supports a biological explanation of the findings reported by Alajati et al.12who observed an increased expression
of mesenchymal-related proteins. In support of our current hypothesis suggesting that d16HER2 is the key HER2 isoform regulating HER2-driven stemness, clinical verification of our
pre-Figure 5. Comparison of stemness-related features driven by d16HER2 and WTHER2 in engineered human BC cells. (a) First mammosphere generation by MCF7-Mock, MCF7_d16 and MCF7_WT and of (b) T47D-Mock, T47D_d16 and T47D_WT evaluated as MFE (%). The results are the mean± s.d. (n = 6). Significance was calculated by a two-tailed paired t-test. (c) Representative plots and (d) summary of the data showing the % of ALDH-positive cells in the HER2-positive cell subset of MCF7_d16 and MCF7_WT cells and in bulk MCF7-Mock cells. The results are the mean± s.d. (n = 3). (e) Representative plots and (f) summary showing the % of ALDH-positive cells in the HER2-positive cell subset of T47D_d16 and T47D_WT cells and T47D-Mock cells. The results are the mean± s.d. (n = 3). Significance was calculated by a two-tailed unpaired t-test. The basal expression of HER2 in MCF7-Mock and T47D-Mock cells was established as the threshold to identify d16 and WT-positive cellular subsets in the bulk MCF7_d16, MCF7_WT, T47D-d16 and T47D-WT engineered cell lines.
d16HER2 sustains breast tumor stemness L Castagnoli et al
clinical data performed on two independent gene expression data sets of HER2-positive BC patients evidenced a significant enrichment of Notch genes and several related target genes in HER2-positive BC expressing high levels of ‘activated-d16HER2 metagene’; that is, those exhibiting a high level of tumor metastasis, cell motility and hypoxia pathways and a high responsiveness to Trastuzumab.13The functional evidence that a dynamic cross-talk occurs between the pd16HER2D/pSRC signal-ing axis and NOTCH molecules comes from the efficiency of the γ-secretase inhibitors DAPT- and/or RO4929097 to significantly inhibit mammosphere formation in MI6 vs WTHER2_1 cells. Based on a well-established literature demonstrating a strict relation
between HER2 and NOTCH signaling,19–22 our pre-clinical and
clinicalfindings suggest that d16HER2 rather than WTHER2 is the real driver of the link between these two pathways. Finally, it was reported that one of the molecular mechanisms that may account for the clinical efficacy of Trastuzumab in women with HER2 BC may be explained by the cancer stem cell model.16In this context, we recently showed that HER2-positive BCs expressing high levels of activated d16HER2 derive the greatest benefit from Trastuzumab,13 supporting that in these tumors Trastuzumab can target cancer stem cells responsible for tumor progression.
In summary, our studies directed toward understanding the role of the d16HER2 variant in development and tumorigenesis of
Figure 6. Differential expression of CD44 in engineered human BC cell lines. (a, b) Representative FACS analysis of CD44 expression levels in HER2-positive cell subsets of MCF7_d16 and MCF7_WT and in bulk MCF-Mock (a) and in T47D_d16, and T47D_WT and in bulk T47D-Mock-infected cells (b). (c, d) Representative immunofluorescence of expression and co-expression (merged) of HER2 (red) and CD44 (blue) markers in the HER2-positive cell subsets of MCF_d16 and MCF_WT cells (c) and of T47D_d16 and T47D_WT-infected cells (d) were evaluated by confocal microscopy. The nuclei were counterstained with DAPI-Prolong (cyan). (e, f) Box plot showing CD44fluorescence intensity in HER2-positive cell subsets of MCF7_d16, MCF7_WT and in bulk MCF7-Mock (e) and in T47D_d16, T47D_WT and in bulk T47D-Mock-infected cells (f). Significance was calculated by a two-tailed unpaired t-test.
HER2-positive BC shed preliminary insights into the importance of this isoform in governing aggressiveness/progression of HER2-positive BC.
MATERIALS AND METHODS Tumor cell lines
MI6 and WTHER2_1, previously known as WTHER2, primary mammary tumor cell lines have been described previously.13,45 The MI7 and
WTHER2_2 cell lines, which express the d16HER2 and WTHER2 transgenes, respectively, were established from spontaneous primary mammary carcinomas of FVB-d16HER2 tg female mouse in 2012, (Molecular Targeting Unit, Department of Experimental Oncology and Molecular Medicine, Fondazione IRCCS Istituto Nazionale dei Tumori, Milan, Italy) and FVB-huHER2 tg female mouse in 2009 (Laboratory of Immunology and Biology of Metastases, Department of Experimental, Diagnostic and Specialty Medicine, University of Bologna, Bologna, Italy). All tumor cell lines were maintained in complete MammoCult medium (StemCell Technologies, Vancouver, Canada) supplemented with 1% fetal bovine serum (Sigma-Aldrich, St Louis, MO, USA) and penicillin–streptomycin (Sigma-Aldrich). Human luminal BC cell lines MCF7 and T47D that express basal/very low levels of HER2 were obtained from ATCC (Rockville, MD, USA) and grown as monolayer cultures in RPMI 1640 (EuroClone, Pero, Milan, Italy) with 10% fetal bovine serum and gentamycin (40μg/ml). Human cell lines were obtained between 2000 and 2010 and authenti-cated by short tandem repeat DNA fingerprinting using the AmpFISTR identifier PCR Amplification Kit (Thermo Fisher, Waltham, MA, USA) yearly (last verification, November 2015). All tumor cell lines were cultured at 37 °C in a humidified 5% CO2 atmosphere and routinely tested for
mycoplasma contamination.
Generation of human engineered cell lines
Lentiviral vectors coding for d16HER2 and WTHER2 were constructed using a third-generation self-inactivating lentiviral system that, being based on
four different plasmids, offers maximal biosafety. The backbone consisted of pRRL-sin-cPPt.CMV-GFP.WPRE (kindly provided by Dr Ferrari, HSR, Milan) in which the GFP sequence was replaced by either d16HER2 or WTHER2 transgenes. For details, view Supplementary Methods. MCF7 and T47D cells infected with pRRL-SIN-CMV-d16HER2 and pRRL-SIN-CMV-WTHER2 were, respectively, named MCF7_d16, T47D_d16, MCF7_WT and T47D_WT and were always tested in parallel with corresponding mock cells as control. Human transduced cell lines were enriched for d16HER2 and WTHER2 expression by an immune-based cytofluorimetric cell sorting performed under sterile conditions before each bioassay, except for the MFE evaluation. Briefly, d16HER2- and WTHER2-positive cells were incubated for 30 min at 0 °C with anti PE-anti-human CD340 (erbB2/ HER2) antibody (BioLegend, San Diego, CA, USA), washed twice with PBS 1X and sorted using a FACS Aria cytometer (BD Bioscience, San Jose, CA, USA). The HER2-positive engineered cells were identified using the basal expression of HER2 in MCF7-Mock and T47D-Mock cells as threshold.
RNA isolation and gene expression profiles of mammary tumor cell lines
Total RNA from MI6, MI7, WTHER2_1 and WTHER2_2 mammary tumor cells was extracted using Qiazol (Qiagen, Valencia, CA, USA). After sample cleanup using the RNAeasy kit (Qiagen) following the manufacturer’s recommendations and using RNase-free DNase to remove contaminating genomic DNA, RNA quantity and purity were evaluated using the Qubit 2.0 Fluorometer (LifeTechnologies, Carlsbad, CA, USA) and Agilent 2100 Bioanalyzer (Agilent Technologies, Palo Alto, CA, USA), respectively. Gene expression profiles were generated using the Illumina MouseWG-6 v2.0 Expression BeadChip (Illumina, Inc., San Diego, CA, USA), according to Illumina protocol. Gene expression data were deposited in the National Center for Biotechnology Information Gene Expression Omnibus (GEO) with accession number GSE67300. For details, view Supplementary Methods. Unsupervised hierarchical clustering was based on the top 5000 genes with the greatest variation according to the inter quartile range. Manhattan distance and Ward’s linkage were used as clustering parameters. Differentially expressed genes between d16HER2 and WTHER2 Figure 7. Association of ‘activated-d16HER2 metagene’ levels with the NOTCH pathway in human HER2-positive BCs. (a, b) Notch pathway expression in human HER2-positive BCs of GSE55348(ref. 30)(a) and NKI data sets32(b) according to the ‘activated-d16HER2 metagene’ classification. The data are shown as the mean of log2 expression of genes belonging to the Notch gene list (Supplementary Table S1). (c, d) Expression levels of Notch-downstream genes in human HER2-positive BCs of GSE55348 (c) or NKI (d) data sets with high or low expression of‘activated-d16HER2 metagene’. Significance was calculated by a two-tailed unpaired t-test.
d16HER2 sustains breast tumor stemness L Castagnoli et al
cells were identified using the limma package (16646809). Multiple-testing correction was performed using the Benjamini–Hochberg false discovery rate. For functional annotation of differentially expressed genes, we performed over-representation analysis using gene sets from KEGG and Reactome gene sets from the MSigDB website (http://software.broad institute.org/gsea/msigdb). The statistical significance of overlap was calculated through the hypergeometric test followed by false discovery rate calculation. To assess the association of ad hoc gene sets (Supplementary Table S1) with the d16HER2 or WTHER2 phenotype, we applied GSEA version 2.2.0 (16199517). GSEA was run using a pre-ranked gene list according to the t-statistic obtained from differential expression analysis with limma. Enrichment was considered significant at Po0.05.
Statistical analyses
Associations among categorical variables were tested by Fisher’s exact test. Differences between groups for continuous variables were tested using a two-tailed unpaired or paired Student’s t-test when appropriate. Differ-ences were considered significant at Po0.05. All analyses were performed using GraphPad Prism version (5.02; GraphPad Software, Inc., La Jolla, CA, USA).
CONFLICT OF INTEREST
The authors declare no conflict of interest.
ACKNOWLEDGEMENTS
We thank Mrs Ghirelli and Mrs Ratti for technical assistance, the Functional Genomics Core Facility and the Flow Cytometry and Cell Sorting Facility of the Fondazione IRCCS Istituto Nazionale dei Tumori, Milan for their support in gene expression profile analyses and in the multiparametric cytofluorimetric analyses, and Mrs Mameli for secretarial assistance. This work was funded by grants from the Associazione Italiana Ricerca Cancro (AIRC) 10352 and 16918 to SM Pupa and AIRC 15324 to PL Lollini; Fellowship 15002 to L Castagnoli; and Ministero Italiano della Salute RF-2009-1532281 to SM Pupa.
AVAILABILITY OF DATA AND MATERIALS
The data sets supporting the conclusions of this article are available at the National Center for Biotechnology Information’s Gene Expression Omnibus (GEO) and are accessible through GEO Series accession numbers GSE67300 and GSE55348 (http://www. ncbi.nlm.nih.gov/geo/query/acc.cgi?acc = GSE55348).
REFERENCES
1 Prat A, Carey LA, Adamo B, Vidal M, Tabernero J, Cortes J et al. Molecular features and survival outcomes of the intrinsic subtypes within HER2-positive breast cancer. J Natl Cancer Inst 2014;106: dju152.
2 Shiu KK, Wetterskog D, Mackay A, Natrajan R, Lambros M, Sims D et al. Integrative molecular and functional profiling of ERBB2-amplified breast cancers identifies new genetic dependencies. Oncogene 2014;33: 619–631.
3 Zagozdzon R, Gallagher WM, Crown J. Truncated HER2: implications for HER2-targeted therapeutics. Drug Discov Today 2011;16: 810–816.
4 Weigelt B, Reis-Filho JS. Activating mutations in HER2: neu opportunities and neu challenges. Cancer Discov 2013;3: 145–147.
5 Jackson C, Browell D, Gautrey H, Tyson-Capper A. Clinical significance of HER-2 splice variants in breast cancer progression and drug resistance. Int J Cell Biol 2013;2013: 973584.
6 Chen J, Weiss WA. Alternative splicing in cancer: implications for biology and therapy. Oncogene 2015;34: 1–14.
7 Kwong KY, Hung MC. A novel splice variant of HER2 with increased transformation activity. Mol Carcinog 1998;23: 62–68.
8 Siegel PM, Ryan ED, Cardiff RD, Muller WJ. Elevated expression of activated forms of Neu/ErbB-2 and Erb-3 are involved in the induction of mammary tumors in transgenic mice: implications for human breast cancer. EMBO J 1999; 18: 2149–2164.
9 Castiglioni F, Tagliabue E, Campiglio M, Pupa SM, Balsari A, Ménard S. Role of exon-16-deleted HER2 in breast carcinomas. Endocr Relat Cancer 2006; 13: 221–232.
10 Mitra D, Brumlik MJ, Okamgba SU, Zhu Y, Duplessis TT, Parvani JG et al. An oncogenic isoform of HER2 associated with locally disseminated breast cancer and trastuzumab resistance. Mol Cancer Ther 2009;8: 2152–2162.
11 Marchini C, Gabrielli F, Iezzi M, Zanobi S, Montani M, Pietrella L et al. The human splice variant delta16HER2 induces rapid tumor onset in a reporter transgenic mouse. PLoS One 2011;6: e18727.
12 Alajati A, Sausgruber N, Aceto N, Duss S, Sarret S, Voshol H et al. Mammary tumor formation and metastasis evoked by a HER2 splice variant. Cancer Res 2013; 73: 5320–5327.
13 Castagnoli L, Iezzi M, Ghedini GC, Ciravolo V, Marzano G, Lamolinara A et al. Activated d16HER2 homodimers and Src kinase mediate optimal efficacy for trastuzumab. Cancer Res 2014;74: 6248–6259.
14 Turpin J, Ling C, Crosby EJ, Hartman ZC, Simond AM, Chodosh LA et al. The ErbB2DeltaEx16 splice variant is a major oncogenic driver in breast cancer that promotes a pro-metastatic tumor microenvironment. Oncogene 2016;35: 6053–6064.
15 Finkle D, Quan ZR, Asghari V, Kloss J, Ghaboosi N, Mai E et al. HER2-targeted therapy reduces incidence and progression of midlife mammary tumors in female murine mammary tumor virus huHER2-transgenic mice. Clin Cancer Res 2004;10: 2499–2511.
16 Korkaya H, Wicha MS. HER2 and breast cancer stem cells: more than meets the eye. Cancer Res 2013;73: 3489–3493.
17 Farnie G, Johnson RL, Williams KE, Clarke RB, Bundred NJ. Lapatinib inhibits stem/progenitor proliferation in preclinical in vitro models of ductal carcinoma in situ (DCIS). Cell Cycle 2014;13: 418–425.
18 Korkaya H, Paulson A, Iovino F, Wicha MS. HER2 regulates the mammary stem/progenitor cell population driving tumorigenesis and invasion. Oncogene 2008;27: 6120–6130.
19 Magnifico A, Albano L, Campaner S, Delia D, Castiglioni F, Gasparini P et al. Tumor-initiating cells of HER2-positive carcinoma cell lines express the highest oncoprotein levels and are sensitive to Trastuzumab. Clin Cancer Res 2009;15: 2010–2021.
20 Farnie G, Clarke RB. Mammary stem cells and breast cancer--role of Notch signalling. Stem Cell Rev 2007;3: 169–175.
21 Korkaya H, Wicha MS. HER-2, notch, and breast cancer stem cells: targeting an axis of evil. Clin Cancer Res 2009;15: 1845–1847.
22 Baker AT, Zlobin A, Osipo C. Notch-EGFR/HER2 bidirectional crosstalk in breast cancer. Front Oncol 2014;4: 360.
23 Visvader JE, Lindeman GJ. Cancer stem cells: current status and evolving com-plexities. Cell Stem Cell 2012;10: 717–728.
24 Takebe N, Warren RQ, Ivy SP. Breast cancer growth and metastasis: interplay between cancer stem cells, embryonic signaling pathways and epithelial-to-mesenchymal transition. Breast Cancer Res 2011;13: 211.
25 Lamouille S, Xu J, Derynck R. Molecular mechanisms of epithelial-mesenchymal transition. Nat Rev Mol Cell Biol 2014;15: 178–196.
26 Shackleton M, Vaillant F, Simpson KJ, Stingl J, Smyth GK, Asselin-Labat ML et al. Generation of a functional mammary gland from a single stem cell. Nature 2006; 439: 84–88.
27 Harrison H, Farnie G, Howell SJ, Rock RE, Stylianou S, Brennan KR et al. Regulation of breast cancer stem cell activity by signaling through the Notch4 receptor. Cancer Res 2010;70: 709–718.
28 Ginestier C, Hur MH, Charafe-Jauffret E, Monville F, Dutcher J, Brown M et al. ALDH1 is a marker of normal and malignant human mammary stem cells and a predictor of poor clinical outcome. Cell Stem Cell 2007;1: 555–567.
29 Liu S, Cong Y, Wang D, Sun Y, Deng L, Liu Y et al. Breast cancer stem cells transition between epithelial and mesenchymal states reflective of their normal counterparts. Stem Cell Rep 2013;2: 78–91.
30 Triulzi T, De Cecco L, Sandri M, Prat A, Giussani M, Paolini B et al. Whole-transcriptome analysis links trastuzumab sensitivity of breast tumors to both HER2 dependence and immune cell infiltration. Oncotarget 2015; 6: 28173–28182. 31 Campiglio M, Bufalino R, Sasso M, Ferri E, Casalini P, Adamo V et al. Effect of adjuvant trastuzumab treatment in conventional clinical setting: an observational retrospective multicenter Italian study. Breast Cancer Res Treat 2013; 141: 101–110.
32 Van de Vijver MJ, He YD, Van'T Veer LJ, Dai H, Hart AA, Voskuil DW et al. A gene-expression signature as a predictor of survival in breast cancer. N Engl J Med 2002; 347: 1999–2009.
33 Ntziachristos P, Lim JS, Sage J, Aifantis I. Fromfly wings to targeted cancer therapies: a centennial for notch signaling. Cancer Cell 2014;25: 318–334. 34 Frisch SM, Schaller M, Cieply B. Mechanisms that link the oncogenic
epithelial-mesenchymal transition to suppression of anoikis. J Cell Sci 2013;126: 21–29. 35 Belsches-Jablonski AP, Biscardi JS, Peavy DR, Tice DA, Romney DA, Parsons SJ. Src
family kinases and HER2 interactions in human breast cancer cell growth and survival. Oncogene 2001;20: 1465–1475.
36 Paoli P, Giannoni E, Chiarugi P. Anoikis molecular pathways and its role in cancer progression. Biochim Biophys Acta 2013;1833: 3481–3498.
37 Latorre IJ, Frese KK, Javier RT Tight junction proteins in cancer. In: Landes Bios-cence, editors. Madame Curie Bioscience Database. Available from http://www. ncbi.nlm.nih.gov/books/NBK6540/ Austin (TX, USA) 2000.
38 Farahani E, Patra HK, Jangamreddy JR, Rashedi I, Kawalec M, Rao Pariti RK et al. Cell adhesion molecules and their relation to (cancer) cell stemness. Carcino-genesis 2014;35: 747–759.
39 Monteiro J, Gaspar C, Richer W, Franken PF, Sacchetti A, Joosten R et al. Cancer stemness in Wnt-driven mammary tumorigenesis. Carcinogenesis 2014; 35: 2–13.
40 Lindsay J, Jiao X, Sakamaki T, Casimiro MC, Shirley LA, Tran TH et al. ErbB2 induces Notch1 activity and function in breast cancer cells. Clin Transl Sci 2008; 1: 107–115.
41 Zhang X, Zhao X, Shao S, Zuo X, Ning Q, Luo M et al. Notch1 induces epithelial-mesenchymal transition and the cancer stem cell phenotype in breast cancer cells and STAT3 plays a key role. Int J Oncol 2015;46: 1141–1148. 42 Shao S, Zhao X, Zhang X, Luo M, Zuo X, Huang S et al. Notch1 signaling regulates the epithelial-mesenchymal transition and invasion of breast cancer in a Slug-dependent manner. Mol Cancer 2015;14: 28–0295.
43 Kahn M. Can we safely target the WNT pathway? Nat Rev Drug Discov 2014;13: 513–532.
44 Shaw FL, Harrison H, Spence K, Ablett MP, Simoes BM, Farnie G et al. A detailed mammosphere assay protocol for the quantification of breast stem cell activity. J Mammary Gland Biol Neoplasia 2012;17: 111–117.
45 De Giovanni C, Nicoletti G, Quaglino E, Landuzzi L, Palladini A, Ianzano ML et al. Vaccines against human HER2 prevent mammary carcinoma in mice transgenic for human HER2. Breast Cancer Res 2014;16: R10.
This work is licensed under a Creative Commons Attribution-NonCommercial-NoDerivs 4.0 International License. The images or other third party material in this article are included in the article’s Creative Commons license, unless indicated otherwise in the credit line; if the material is not included under the Creative Commons license, users will need to obtain permission from the license holder to reproduce the material. To view a copy of this license, visit http:// creativecommons.org/licenses/by-nc-nd/4.0/
© The Author(s) 2017
Supplementary Information accompanies this paper on the Oncogene website (http://www.nature.com/onc)
d16HER2 sustains breast tumor stemness L Castagnoli et al