Exploiting Data Mining for Authenticity Assessment and
Protection of High-Quality Italian Wines from Piedmont
∗Marco Arlorio
Department of Pharmaceutical Sciences University of Piemonte Orientale Novara, Italy[email protected]
Jean Daniel Coisson
Department of Pharmaceutical Sciences University of Piemonte Orientale Novara, Italy
[email protected]
Giorgio Leonardi
Computer Science Institute, DiSIT University of Piemonte Orientale Alessandria, Italy
[email protected]
Monica Locatelli
Department of Pharmaceutical Sciences University of Piemonte Orientale Novara, Italy[email protected]
Luigi Portinale
†Computer Science Institute, DiSIT University of Piemonte Orientale Alessandria, Italy
[email protected]
ABSTRACT
This paper discusses the data mining approach followed in a project called TRAQUASwine, aimed at the definition of methods for data analytical assessment of the authenticity and protection, against fake versions, of some of the highest value Nebbiolo-based wines from Piedmont region in Italy. This is a big issue in the wine market, where commercial frauds related to such a kind of products are estimated to be worth millions of Euros. The objective is twofold: to show that the problem can be addressed without expen-sive and hyper-specialized wine analyses, and to demon-strate the actual usefulness of classification algorithms for data mining on the resulting chemical profiles. Following Wagstaff’s proposal for practical exploitation of machine learning (and data mining) approaches, we describe how data have been collected and prepared for the production of different datasets, how suitable classification models have been identified and how the interpretation of the results sug-gests the emergence of an active role of classification tech-niques, based on standard chemical profiling, for the asses-ment of the authenticity of the wines target of the study.
∗Authors are listed in alphabetical order. †Corresponding Author.
DOI: http://dx.doi.org/10.1145/2783258.2788596.
Categories and Subject Descriptors
I.5.4 [Computing Methodologies]: Pattern Recognition— Applications; I.5.2 [Computing Methodologies]: Pattern Recognition—Design Methodology
Keywords
Compliance and Fraud, Multi-label and Multi-class learning
1.
INTRODUCTION
The quality and safety profiles of quality wines represent a peculiar case of the notion of food integrity, because of the very high value of a single bottle, and because of the com-plex chemical profile, requiring therefore specific and robust methods for their univocal profiling/authentication. Vitis vinifera is the unique grape allowed for the winemaking, but many different genetic varieties (e.g. Pinot, Nebbiolo, Merlot, Sangiovese, Sirah and many others) lead to wines with different character and chemical profiles. The indus-trial processing largely build the wine specificity.
Moreover, the “terroir” (the set of special characteristics that the geography, the geology and the microclimate of a certain region or peculiar location, interacting with grape genetics, express in wine), while bringing to the diversifica-tion of the product, complicates significantly the wine chem-ical profiling under the metabolomics profile and, thus, the process of traceability and identification.
Although specific regulations exist in this matter, and some analytical approaches and protocols are well estab-lished for wine tracking and authentication, quality wines are highly subjected to adulteration. Problems with con-sumption fraud go back a very long time; more or less re-cently, numerous cases of wine adulteration were worldwide registered, including Austria, France and Italy. Wine fraud is then a big issue worldwide, inducing significant problems for consumers; it also triggers destabilization of the wine market, particularly regarding the quality aspect, with an estimated impact of about 7% of the whole market value. Permission to make digital or hard copies of all or part of this work for personal
or classroom use is granted without fee provided that copies are not made or distributed for profit or commercial advantage and that copies bear this notice and the full citation on the first page. Copyrights for components of this work owned by others than ACM must be honored. Abstracting with credit is permitted. To copy otherwise, or republish, to post on servers or to redistribute to lists, requires prior specific permission and/or a fee. Request permissions from [email protected].
KDD '15, August 10-13, 2015, Sydney, NSW, Australia. © 2015 ACM. ISBN 978-1-4503-3664-2/15/08…$15.00.
Although wine can suffer for different type of frauds and different type of counterfeiting, the predominant problem in wine sector is mislabeling, regarding both the used cultivar of grape and the geographical area of origin; it causes an economical impact estimated to be several million of Euros. The detection of adulterations or declarations which do not correspond to the labeling are actually official tasks of wine quality control and consumer protection. During the last years, analytical methods have been improved in this field. Some of them (stable isotope ratio analysis by nu-clear magnetic resonance, and isotope ratio mass spectrom-etry) have been adopted as official methods by the European Community (EC). In addition, the use of the corresponding analytical devices is expensive and requires a lot of special-ization. Moreover, these methods, while playing a key role in detecting adulterations like addition of water and inad-missible sweetening, represent a challenge also regarding the identification of origin, requiring in this case a very large data base.
Non analytical approaches like olograms, trasponder sys-tems or QR codes only partially address the problem of wine authenticity. Finally, regulations, good manufacturing prac-tices and traceability procedures are not always sufficient to guarantee the wine authenticity, considering the falsification of both varietal and geographic origin. For these reasons, a challenge for wine authenticity is to obtain standard analyt-ical procedures to describe a wine proof-of-identity, which could defend consumers from illegal adulteration practices, as well as from unintentional mislabeling due to mistakes during wine production.
There are then two analytical levels: the chemical one, concerning the identification of the most relevant standard chemical analyses to perform, and the data one, concern-ing the determination of the relevant data minconcern-ing and anal-ysis techniques exploiting the features obtained from the chemical level. From the data mining perspective, the main goal of the work is to show that well-established methodolo-gies of classification, from machine learning, can be suitably adopted to fullfill the task of controlling specific wine adul-terations, and consequently be capable of generating added value to the quality control process of such high-quality wines.
In the paper we will discuss the experience gained in the TRAQUASwine project, having as a major goal the as-sessment of the authenticity and the protection against fake versions of some of the highest quality (and often top priced) Nebbiolo-based wines like Barolo, Barbaresco and Gattinara. Following Wagstaff’s scheme [16], we discuss how data have been collected, how they have been prepared, how suitable classification models have been identified and how the inter-pretation of the results suggests the emergence of an active role of classification techniques, based on standard chem-ical profiling, for the assesment of the authenticity of the high-quality wines which were target of the study.
The remainder of the paper is organized as follows: sec-tion 2 presents the main objectives and the data collecsec-tion and preparation steps of the study; section 3 discusses the characterization of the data and of the classification algo-rithms adopted, by presenting results on different datasets with different sets of features; section 4 compares the ap-proach to related works finally, section 5 presents the con-clusions, by pointing out to some future evolutions.
2.
THE TRAQUAS
WINESTUDY
2.1
Main Objectives
The TRAQUASwine project involved both industrial and academic partners in the creation of a network operating in the wine sector, with the aim to trace and authenticate the origin, quality and safety of Piedmont (Italy) wines, with particular interest to high-value and high-quality Nebbiolo-based wines. In this context, the principal goals of the project were:
• to define the major characteristics (chemotype, with particular interest on bioactive compounds) of Neb-biolo grape and derived wines, identifying molecular markers useful for quality control and wine traceabil-ity;
• to establish a comprehensive analytical approach, based on the exploitation of data mining techniques for mul-tivariate analysis to chemotype datasets, useful to the traceability and authentication of high-quality Nebbiolo-based wines, produced in different area of Piedmont, by diverse wineries.
The selection of chemical parameters and methods was performed by taking into account two main criteria:
• economical cost of the analyses (particularly regarding the required instrumentation);
• the capacity to work also with common chemical pa-rameters, avoiding the need of pluriannual consolidated databases, as often required by classical isotopic meth-ods.
Important feature has been the use of data of different ori-gin, by considering different producers, different areas of pro-duction, different typology of wine (i.e., commercial wines on the market, as well as “model” wines explicitily produced for the study) and different aging of the product. A peculiar approach (use of some Nebbiolo wines spiked with different percentages of different wines) was finally exploited in order to check the possibility to highlight the illegal adding of a foreign grape cultivar, so detecting potential frauds.
2.2
Data Collection
Commercial samples of Piedmont Nebbiolo-based wines were provided by nine local wineries; producers themselves certified wine’s origin and identity. Eight different types of wines at different aging degree (selected on the basis of the mean aging of each type of wine and depending on their com-mercial availability) were considered. Among them, Bar-baresco (BRB), Barolo (BRL), Langhe (LAN), Nebbiolo d’Alba (NEB) and Roero (ROE) are typical wine productions of the Alba district in Southern Piedmont, while Gattinara (GAT), Ghemme (GHE) and Sizzano (SIZ) are produced in Northern Piedmont (Novara province). The distribution of samples (spanning a period of 10 wine years) resulted in 18 samples of BRB, 18 samples of BRL, 12 samples of LAN, 18 samples of NEB, 6 samples of ROE, 6 samples of GAT, 18 samples of GHE and 6 sample of SIZ. BRL, BRB, GAT, NEB and ROE were certified as produced from 100% Nebbiolo grape, while the other wines contained percentages of different grape varieties (having however Nebbiolo as the primary grape variety).
Beside such commercial wines, a set of experimental wines (model wines) has been specifically prepared, resulting in 56 additional samples. Among them, 12 samples correspond to wines produced without Nebbiolo grape, and in particular with 100% of some grape varieties partially present in some of LAN commercial wines; we labeled them as NON (NO Nebbiolo); 26 samples were prepared as more LAN and NEB wines, for a final count (commercial and experimental) of 22 samples of LAN and 34 samples of NEB; 8 samples were prepared as a correct mix for GHE, resulting in a total of 26 samples of GHE. Finally, the remaining experimental wines were produced to model incorrect (i.e., not allowed by the disciplinary of production) blends for GAT wine, resulting in 10 more samples that we labeled as BLE (Blend ).
As mentioned earlier, the main goal of the study was to develop and assess analytical techniques (both at the chemi-cal and data levels) to effectively support the authenticity of high-value Nebbiolo-based wines. To this end, we organized the study as follows: we selected some of the most valued 100%-nebbiolo wines as the high quality class to be pro-tected from fakes, and in particular BRL, BRB and GAT; we also selected LAN and BLE as control wines, the former to simulate not allowed blend for BRL and BRB, and the latter for GAT. We obtained a total of 146 samples with 9 types of wines (i.e., the classes) that we have used to train and test our models. We reserved the 12 samples of NON wines as additional control wines, to test the response of the learned models with respect to simulated fake wines with the absence of Nebbiolo grape, and with the additional compli-cation that no such a kind of wines have been used in the training of the models.
2.3
Data Preparation
Wine samples were mainly characterized for their phenolic composition. The phenolic component of wine is very com-plex and heterogeneous, and is strongly influenced by several factors related to grape polyphenol composition winemak-ing procedures, wine agwinemak-ing, and storage conditions. In the present study, we decided to employ common and relatively economic analytical techniques, as well as methods easily reproducible. The adopted analytical (chemical) procedures can be categorized as follows:
• spectrophotometric methods, which include not specific and low-cost assays, useful to quantify general class of compounds (total polyphenols, total anthocyans and total tannins) and antioxidant activity;
• chromatographic methods, which are more advanced and specific , but are time-consuming and require more expensive instrumentations, which are however gener-ally available in the standardly equipped laboratories for quality control. The chromatographic techniques were employed for the identification and quantification of individual polyphenol compounds in wines. Considering spectrophotometric methods, the total phenol content is an unspecific parameter; however, due to the com-plexity of wine’s phenolic component, it can be considered an interesting general information. Total anthocyans and total tannins are other peculiar characteristics of wines, re-lated to their organoleptic properties. Antioxidant activity, for which do not exist official methods recommended by in-ternational organization for wine analysis , was measured
using a rapid chemical model system for the determination of antiradical properties (DPPH assay).
The chromatographic techniques are useful tools to finger-print wine polyphenols, identifying individual molecules. In this study, different class of compounds were considered: an-thocyanins, phenolic acids, hydroxycinnamates and flavonoids. Some of them have been calculated not only as absolute con-centrations, but also as relative percentages.
Finally, wine samples were analyzed for the content of resveratrol (both trans and cis form), important molecule for its beneficial effects on human health, and considered as one of the major compounds responsible for the well-known French Paradox (the fact that French people, having red wines in their dietary habits, have a relatively low incidence of coronary heart disease, while having a diet relatively rich in saturated fats).
3.
THE DATA MINING FRAMEWORK
3.1
Data Characterization
From the chemical analyses described in section 2.3, a to-tal of 40 continuous features have been extracted. Besides those described in section 2.3, also wine acidity (the pH) and information about the percentage of some grape vari-eties have been added. Missing values were present in about 1/3 of the dataset, essentially in association with the latter set of attributes (percentage of grape varieties). As reported in section 2.2, we have then obtained a dataset of 146 in-stances, each one corresponding to a particular class (i.e. the wine type) out of 9 possible classes, and having 40 numerical (continuous) attributes.
We have organized the evaluation of the data mining ex-perimental study as follows. First of all, we have searched for regularities in the profiles of the available wine chemical analyses by means of some clustering algorithms. In par-ticular, we tested EM clustering (both with a free number of clusters and with a number of required clusters equal to the number of classes) and a K-mean algorithm (K = 9). As expected, no definite interpretation of the results have emerged from unsupervised data analysis, suggesting that regularities associated to wines should be better captured through supervised methods.
We then considered classification approaches, by having in mind that the goal of the data mining process was mainly to characterize the misclassification of the target wines, that is high-quality wines (BRL, BRB and GAT) and control wines (LAN and BLE). Thus general classification accuracy has been considered of secondary importance. To test classifi-cation approaches, we considered three different data sets: dataset D1 containing all the 146 instances with the whole set of 40 features; dataset D2 containing the 146 instances with a reduced set of 15 features, obtained by automatic fea-ture selection; dataset D3 containing the 146 instances with the set of features of D2 manually reduced to 13 attributes, and in particular by removing all the attributes concerning the percentage of grape varieties which survived automatic feature selection.
We have experimented the learning of the following type of classifiers:
1. A Bayesian Network classifier (BN), with learning per-formed with standard Cooper/Herskovits algorithm [3], allowing a maximum of 3 parents per node, identifying
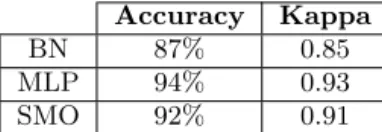
Accuracy Kappa
BN 87% 0.85
MLP 94% 0.93
SMO 92% 0.91
Table 1: Accuracy and Kappa statistic for dataset D1.
dependencies among the attributes and thus avoiding the Naive Bayes assumption.
2. A Support Vector Machine (SVM) based on Sequen-tial Minimal Optimization algorithm (SMO) [10] with a Pearson Universal Kernel (PUK) having Lorentzian peak shape [14], and with Platt scaling in such a way to get a probability distribution over the classes [11]1.
3. A Multi-Layer Perceptron (MLP) with one hidden layer of n = f +c
2 hidden units (being f the number of
fea-tures and c the number of classes)
We also experimented with a lazy learner based on 1-NN classification, and with a Decision Tree learner based on the C4.5 algorithm; since this two types of classifier did not perform well for our task, we do not report the corresponding results in the paper.
The BN, SMO and MLP classifier have been learned using the 146 samples and evaluated by means of a 10-fold cross validation. As mentioned before, the main focus was not on general accuracy (even if definitely an important measure), but rather to check the performance of the classifiers with respect to the classes of high-quality wines (BRL, BRB and GAT) and control wines (LAN and BL), by looking at their possible misclassifications.
We have exploited WEKA’s algorithms to perform our experimentation[7], and multi-class classification has been perfomed as a one-agaist-all approach. In the following sub-sections we will discuss the results obtained on each of the above datasets.
3.2
Complete Feature Set
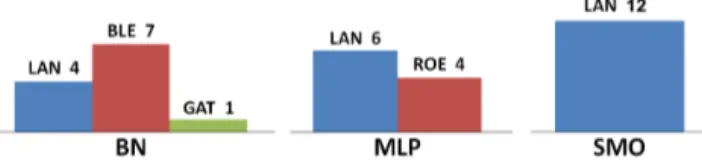
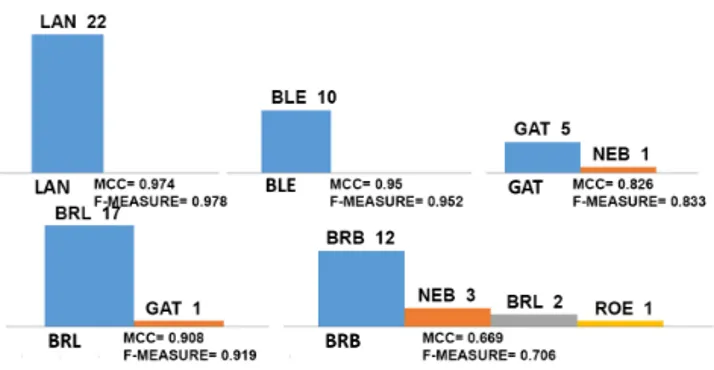
In this part we discuss the results obtained by using the whole set of features obtained after the chemical analyses performed on the available wine samples (dataset D1). Ta-ble 1 reports the general accuracy and Kappa statistic of the three classifiers. It can be noticed that the general accu-racy (and its significance as measured by Kappa statistics) is rather high, with the MLP classifier being the most ac-curate and slightly better than SMO. Figure 1, figure 2 and Figure 3 report the prediction statistics with respect to the classes of interest for BN, MLP and SMO classifier respec-tively. We also report Matthews Correlation Coefficient (MCC) and F1-measure, with MCC being more significant in our case, since the number of “positive” instances (those of the target class) are much less that the number of “negative” instances (those of all the other classes). Concerning control wines (LAN and BLE), we can notice that classification ac-curacy is very good, but more importantly, no control wine is misclassified as a high-quality one; on the other hand,
1The regularization parameter (a.k.a complexity) has been
set to 10, since we are dealing with a multi-class problem with 9 different classes, and it is a good practice to set the parameter close to the number of classes [9].
Figure 1: Predictions BN classifier, dataset D1
Figure 2: Predictions MLP classifier, dataset D1
high-quality wines (BRL, BRB and GAT) are also recog-nized very well, with no misclassification predicting control wines. From the diagrams, we can also notice that each misclassification is also not really surprising: for instance in every classifier, BRB is misclassified either as BRL (a very similar wine from the point of view of origin, production and grape composition) or as ROE, which is another 100% Nebbiolo wine. MLP has a perfect performance on control wines (no misclassification). SMO has a misclassification on BLE (but with the other control class LAN) and a perfect classification on BRL (definitely the most valued wine of the set).
Probability distribution of misclassified predictions
True Ground GHE GAT SIZ NEB BRL ROE BRB LAN BLE
LAN 0 0 0.02 0.914 0 0.056 0.024 0.002 0.002 BLE 0.893 0 0 0 0 0 0 0 0.107 GAT 0 0.055 0 0.001 0.944 0 0 0 0 BRL 0 0.827 0 0.015 0.158 0 0 0 0 0 0.019 0 0.918 0.015 0.048 0 0 0 0 0.001 0 0.976 0.006 0.017 0 0 0 0 0 0 0.002 0.351 0 0.647 0 0 0 0 0 0 0.299 0 0.701 0 0 BRB 0 0 0 0.001 0 0.898 0.101 0 0 0 0 0 0 0.971 0 0.029 0 0 0 0 0 0.192 0.736 0 0.072 0 0
Table 2: Probability distribution of misclassifications, dataset D1: BN classifier. Probability distribution of misclassified predictions
True Ground GHE GAT SIZ NEB BRL ROE BRB LAN BLE
GAT 0.003 0.277 0 0.266 0.449 0.001 0.003 0 0 BRL 0 0 0 0.585 0.408 0.007 0 0 0 0 0 0 0.559 0.437 0.003 0 0 0 0.089 0.600 0 0.008 0.302 0.001 0 0 0 BRB 0 0.003 0 0.001 0.933 0.003 0.059 0 0
Table 3: Probability distribution of misclassifications, dataset D1: MLP classifier.
Considering the classes of interest, we also computed, for each classifier, the probability distribution on the predictions that are misclassified. Table 2, table 3 and table 4 show the results for classifiers BN, MLP and SMO respectively. The prediction performed by the classifier corresponds to the en-try shown in boldface (the largest probability of prediction). By inspecting such distributions, we confirm the good per-formance of the classifiers, with MLP and SMO being almost equivalent and sligthly better than BN. All classifiers agree with a very high confidence that a high-quality wine cannot be confused with a control wine (see last two columns of the tables in the rows of high-quality wines). We can also notice that distributions obtained from MLP and SMO are in gen-eral less skewed than those of BN, showing more “caution” in the actual prediction, but also very good performance on predicting control wines. For instance SMO, having two misclassification on BLE, predicts BLE as the second most probable class and estimates a probability close to 0 to high-quality wines (exactly 0 for GAT).
As a final investigation on D1, we tested the classifiers using a test set TS composed by the 12 instances of NON wines resulting as discussed in section 2.2. Differently from the wine samples used for training the classifiers, the wine samples in TS do not contain any part of Nebbiolo grape; this implies that acceptable predictions can be those select-ing our control wines (LAN and BLE) which are the ones containing parts of the grape varieties contained in the wine samples of TS; in particular, LAN is also a preferred pre-dictions than BLE, because of the way NON wine samples have been prepared. The results are shown in figure 4. SMO shows very reasonable predictions, by identifying very pre-cisely the only class (LAN) containing percentages of the grapes present in the test cases of TS. By considering all the results, we can conclude that, on dataset D1, SMO appears to be the best globally performing classifier.
Figure 4: Predictions of NON wines, dataset D1
3.3
Automatic Feature Selection
The second round of experiments we have perfomed takes into account the relevance of the available features of the wine samples, with respect to our target classification task. To this extent, we constructed and evaluated the same set of classifiers considered in section 3.2, but on a dataset with a reduced set of features. In particular, we have perfomed a correlation-based feature selection with sequential forward-backward selection on the original feature space [12, 8], re-sulting in the selection of 15 analytical attributes out of 402. In particular, all the features representing grape vari-ety percentage, but those of Nebbiolo and Uva Rara were removed by feasture selection, together with a set of re-dundant information about polyphenols that were initially provided both as absolute concentrations and relative per-centages. As already mentioned, the resulting dataset will be refferred as D2. Table 5 reports the general accuracy and Kappa statistic of the three classifiers for dataset D2. Results show again a good and significant global accuracy, this time with SMO slightly better than MLP. Figure 5, figure 6 and Figure 7 report the prediction statistics with
2An approach based on a PCA transformation of the feature
space has also been investigated in the study, with results and considerations similar to those reported in the present papers for the other alternatives.
Probability distribution of misclassified predictions
True Ground GHE GAT SIZ NEB BRL ROE BRB LAN BLE
BLE 0.004 0 0 0.117 0.016 0 0.013 0.599 0.251
0.005 0 0 0.154 0.018 0 0.027 0.620 0.176
GAT 0.036 0.254 0 0.010 0.624 0 0.073 0.002 0.001
0.014 0.342 0 0.021 0.187 0 0.433 0.002 0.001
BRB 0 0 0 0 0.989 0 0.011 0 0
Table 4: Probability distribution of misclassifications, dataset D1: SMO classifier.
Accuracy Kappa
BN 83% 0.80
MLP 89% 0.87
SMO 90% 0.88
Table 5: Accuracy and Kappa statistic for dataset D2.
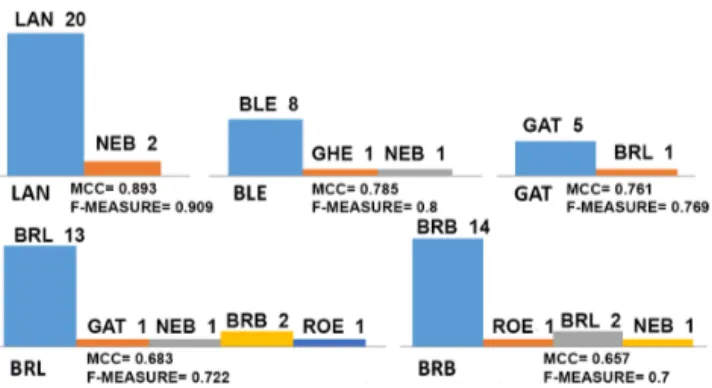
respect to the classes of interest for BN, MLP and SMO classifier respectively. Concerning control wines, we can
Figure 5: Predictions BN classifier, dataset D2
Figure 6: Predictions MLP classifier, dataset D2 notice again a very good classification with high accuracy and no control wine misclassified as a high-quality one; on the other side, high-quality wines are also recognized well (SMO has a perfect prediction on GAT), with no misclas-sification predicting control wines. As in the previous case, misclassifications can in general be suitably justified: the most interesting result is provided by SMO, where BRL and BRB are each other confused in the corresponding misclas-sification (which is something definitely acceptable).
Figure 7: Predictions SMO classifier, dataset D2
As in the case of dataset D1, we also computed, for each classifier, the probability distribution on the predictions that are misclassified, by focusing on the classes of interest. Ta-ble 6, taTa-ble 7 and taTa-ble 8 show the results for classifiers BN, MLP and SMO respectively. Again, the prediction per-formed by the classifier corresponds to the entry shown in boldface.
A problem can be noticed in the BN classifier, where the first misclassification of BRB has a a prediction on BLE with a 29% probability, even if the most probable predicted class is NEB. MLP is showing no misclassifications for control wines, even if there are 6 misclassifications of BRB; how-ever, three of them have exactly BRB as the second most probable prediction (with a 48% probability in one case and more than 30% in the others), while the predictions of con-trol wines are either 0 or very close to 0. Concerning SMO, the confusion of BLE with GHE is justified by the fact that samples corresponding to such instances represented mix-tures very close to the blend allowed for GHE, while confu-sion of BRL with BRB and vice versa are justified by the very high similarity of the two wines (as already mentioned). Finally, we tested the classifiers learned using D2 using the test set TS of NON wines, resulting in the predictions graphically reported in figure 8. BN’s prediction appears
Probability distribution of misclassified predictions
True Ground GHE GAT SIZ NEB BRL ROE BRB LAN BLE
LAN 0 0.002 0.017 0.917 0 0.001 0.058 0 0.004 BLE 0.704 0 0 0 0 0 0 0 0.295 0.620 0 0 0 0 0 0 0 0.380 0.061 0 0 0.613 0 0 0 0 0.326 GAT 0 0.017 0 0.101 0.873 0.001 0.008 0 0 BRL 0.006 0.580 0 0.007 0.406 0 0 0 0 0 0 0 0.727 0.272 0 0 0 0 0 0.006 0.001 0.066 0.270 0.467 0.188 0 0 0 0 0 0 0.442 0 0.558 0 0 0 0 0 0 0.227 0 0.772 0 0 BRB 0 0.007 0 0.515 0.056 0 0.128 0.006 0.287 0.002 0.001 0 0.080 0.649 0 0.254 0 0.013 0 0 0 0 0.968 0 0.032 0 0 0 0 0 0.009 0 0.991 0 0 0
Table 6: Probability distribution of misclassifications, dataset D2: BN classifier. Probability distribution of misclassified predictions
True Ground GHE GAT SIZ NEB BRL ROE BRB LAN BLE
GAT 0.002 0.270 0 0.711 0.002 0 0.014 0.001 0 BRL 0.068 0.475 0 0.008 0.422 0 0.026 0 0 BRB 0 0.012 0 0.637 0.001 0 0.349 0 0 0 0 0 0.575 0.003 0.41 0 0 0.011 0 0.003 0 0.516 0 0.001 0.48 0 0 0.007 0 0 0 0.691 0 0.302 0 0 0 0.015 0 0.001 0.952 0.023 0.009 0 0 0 0 0 0.195 0.007 0.773 0 0 0.025
Table 7: Probability distribution of misclassifications, dataset D2: MLP classifier.
Accuracy Kappa
BN 79% 0.75
MLP 82% 0.79
SMO 89% 0.87
Table 9: Accuracy and Kappa statistic for dataset D3.
more reasonable than in the case of D1 (no high-quality wine prediction, even if NEB predictions are not very well justified); MLP’s predictions have a problem in the two cases where the sample is recognized as a BRB (in both cases with a rather high probability); SMO’s predictions are quite good, even if NEB predictions shows an identification problem on the corresponding samples.
To summarize, also in this situation (i.e., using D2 for training), SMO resulted to be perfoming in general better than the other classifiers.
3.4
Automatic and Manual Feature Selection
A third round of experiments concerned the manual elim-ination, from the dataset D2, of the information concerning the percentage of grape variety. This resulted in another dataset (D3) with a total of 13 attributes. Table 9 reports the general accuracy and Kappa statistic of the three classi-fiers for dataset D3. The accuracy of each classifier slightly reduces again with respect to the previous cases, and SMO results better than MLP, with the lowest accuracy obtained
by BN (as in the use of D2). Figure 9, figure 10 and Fig-ure 11 report the prediction statistics with respect to the classes of interest for BN, MLP and SMO classifier respec-tively. As in the previous cases, no control wine is predicted
Figure 9: Predictions BN classifier, dataset D3 as a high-quality wine and vice versa. SMO has exactly the same (good) performance as in the case of D2, and also BN produce almost the same results. MLP slightly augment the number of misclassifications, but is still performing better than BN. Thus, the complete elimination of the grape per-centages from the dataset does not seem to influence too much the cross validation performance of the classifiers we considered (it is worth noting that in 1/3 of the samples such data were already missing).
Probability distribution of misclassified predictions
True Ground GHE GAT SIZ NEB BRL ROE BRB LAN BLE
BLE 0.990 0 0 0 0 0 0 0 0.009 0.962 0 0 0 0 0 0 0 0.037 BRL 0 0 0 0.002 0.199 0 0.799 0 0 0 0 0 0.004 0.358 0 0.638 0 0 BRB 0 0 0 0 0.936 0 0.063 0 0.013 0 0 0 0.001 0.936 0 0.063 0 0
Table 8: Probability distribution of misclassifications, dataset D2: SMO classifier. Probability distribution of misclassified predictions
True Ground GHE GAT SIZ NEB BRL ROE BRB LAN BLE
LAN 0 0 0 0.566 0 0.002 0.002 0.43 0 0 0 0.005 0.955 0 0.001 0.032 0.001 0.005 BLE 0.611 0 0 0.002 0 0 0 0 0.387 0.037 0 0 0.632 0.001 0 0 0.015 0.314 GAT 0 0.017 0.001 0.08 0.893 0 0.008 0 0 BRL 0.209 0.419 0.013 0.004 0.354 0 0 0 0 0 0 0.001 0.718 0.281 0. 0 0 0 0.011 0 0 0 0.481 0 0.508 0 0 0 0 0 0 0.237 0 0.763 0 0 0 0.037 0.051 0.151 0.313 0.324 0.119 0.005 0 BRB 0 0 0 0.009 0 0.991 0 0 0 0.072 0 0 0.035 0.846 0 0.044 0 0.004 0 0 0 0 0.979 0 0.021 0 0 0.01 0.012 0.002 0.611 0.086 0 0.186 0.009 0.084
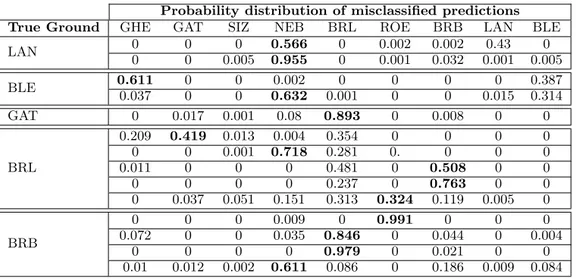
Table 10: Probability distribution of misclassifications, dataset D3: BN classifier.
Figure 10: Predictions MLP classifier, dataset D3
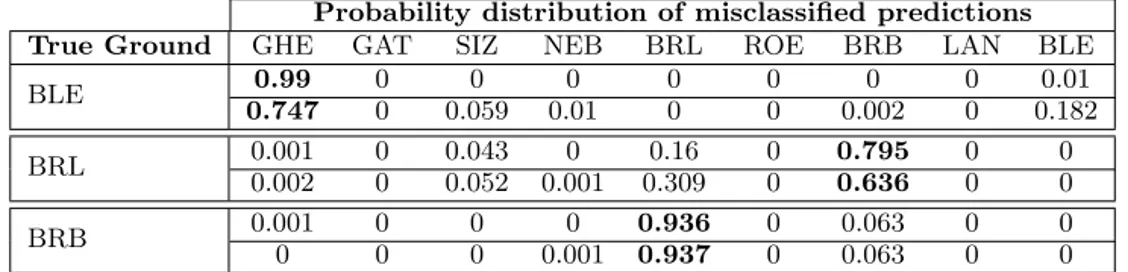
Again, as in the case of other datasets, we computed, for each classifier, the probability distribution on the predictions that are misclassified, by focusing on the classes of interest. Table 10, table 11 and table 12 show the results for classi-fiers BN, MLP and SMO respectively (prediction performed by the classifier corresponding to the boldface entry). It can be noticed the very good performance of SMO, that in case of BRB and BRL (the only high-quality wines having mis-classifications) shows a null probability of predicting control wines and in one prediction of BRB (the second misclassifi-cation of BRB) has a 31% probability of predicting the cor-rect wine (against a 64% probability of confusing it with the similar BRB). Finally, predictions on BLE (the only
misclas-Figure 11: Predictions SMO classifier, dataset D3
sified control wine) shows a null or close to null probability of predicting high-quality wines.
Also in this case we finally tested the classifiers learned with D3, using the test set TS of NON wines; results are summurized in figure 12. These results shows that SMO is definitely more robust and stable with respect to the others in presence of control wines on which the classifier was not trained; this proposes, together with the previous results, SMO as the best performing approach on D3 as well.
To conclude, the results of the experiments suggest that standard chemical profiling of Piedmont Nebbiolo-based wines, coupled with data mining classification techniques, can be a powerful tool to authenticate high-quality and high-value
Probability distribution of misclassified predictions
True Ground GHE GAT SIZ NEB BRL ROE BRB LAN BLE
BLE 0.471 0 0.076 0 0.005 0 0 0 0.447 BRL 0.862 0.095 0.001 0.001 0.039 0 0 0.002 0 0.383 0.012 0 0 0.014 0 0.518 0 0.072 0 0 0.21 0 0.064 0.69 0.036 0.001 0 0 0 0.118 0 0.278 0.59 0.014 0 0 BRB 0 0 0.025 0.641 0.233 0.095 0 0.001 0.004 0 0 0.014 0.748 0 0.233 0 0.001 0.005 0.004 0.109 0 0.008 0.543 0 0.335 0 0 0 0.041 0.001 0 0.591 0.002 0.365 0 0 0 0.004 0 0.009 0.878 0.002 0.107 0 0 0 0 0.035 0.327 0 0.626 0 0.002 0.01
Table 11: Probability distribution of misclassifications, dataset D3: MLP classifier. Probability distribution of misclassified predictions
True Ground GHE GAT SIZ NEB BRL ROE BRB LAN BLE
BLE 0.99 0 0 0 0 0 0 0 0.01 0.747 0 0.059 0.01 0 0 0.002 0 0.182 BRL 0.001 0 0.043 0 0.16 0 0.795 0 0 0.002 0 0.052 0.001 0.309 0 0.636 0 0 BRB 0.001 0 0 0 0.936 0 0.063 0 0 0 0 0 0.001 0.937 0 0.063 0 0
Table 12: Probability distribution of misclassifications, dataset D3: SMO classifier.
Figure 12: Predictions of NON wines, dataset D3
wines. All the tested classifiers perfomed rather well with respect to the objectives of the work, with BN being the more problematic in some situations, and MLP compara-ble in performance with SMO, the latter showing a better robustness with respect to possible fake wines.
4.
RELATED WORKS
Wine classification and identification through data min-ing and pattern recognition usmin-ing chemical descriptors have been approached several times in different settings. Several paper are reported in literature, focused on different analyt-ical targets and techniques, where however the complexity of the data mining task is often proportional to the complex-ity of the chemical or sensory analyses. Moreover, employed data mining techniques cover essentially all the possible clas-sification or discriminant analysis methods, showing that no “silver bullet” is available in general [2, 15].
Authors in [5] investigate aroma compounds of Galician white wines using a dataset of 42 samples; they show that PCA was not able to accurately separate all the wine va-rieties, thus different machine learning techniques (SVM, Random Forest, MLP, k-NN and Naive Bayes) were eval-uated, obtaining a perfect classification accuracy using the Random Forest algorithm. Differently from our study, the
target was maximizing general classification accuracy, and no commercial wine was analyzed.
PCA and Extreme Learning Machine (ELM) were also applied to detect grape varieties: the PCA algorithm was adopted to process chemical components of publicly avail-able wine datasets and classification was performed using the ELM. The experimental results show that the proposed model was useful for general wine classification [17].
Sophisticated analytical methods (even coupled with spe-cific sensory devices such as electronic nose or tongue) have been often used to obtain wine characterization; however, as in our case, [1] shows that simple and nonselective techniques (as UV-visible spectrophotometric methods), in combina-tion with classificacombina-tion approaches, can be demonstrated successful. Here the emphasis is again in improving gen-eral classificational accuracy (in this case of sevgen-eral Spanish wines).
Finally, another recent work proposing support vector ma-chine as very promising in this context is presented in [4]; the task here is however completely different, since the goal is to predict (with a suitable score) human wine tasting pref-erences (that are however closely related to the wine type characteristics).
5.
DISCUSSION AND FUTURE WORKS
In this paper we have reported of the results of a study ex-ploiting classification for the assessment of the authenticity of some high-value Italian wines. The problem has been ad-dressed without expensive and hyper-specialized wine chem-ical analyses, and by learning and suitably evaluating dif-ferent standard classifiers on the resulting chemical profiles. The proposed approach can be regarded as an instance of the 3-phases Wagstaff’s scheme [16]: Necessary Preparation has involved the definition of the analyses for data collection and
preparation, Machine Learning Contribution has regarded the selection of a supervised strategy and of a suitable set of classifiers, while Impact has concerned the evaluation of the classification results with respect to the study’s objec-tives. The conclusion is that an SVM classifier like SMO emerges as very promising in this context, both for detect-ing wrong or illecit blends (not necessarily of low quality, but not compliant with regulations as in the case of LAN and BLE), as well as for avoiding incorrect introductions of un-related cultivars (as in the case of NON). Moreover, feature selection has pointed out that the number of chemical pa-rameters, needed to get good performances with respect to the authentication objective, can be significantly less than the whole set of parameters initially tought as necessary: performances on datasets D2 and D3 of SMO are in fact comparable, and in some sense even better than those on dataset D1. For instance, in D1, GAT has been misclassified by SMO as BRL and BRB, which are wines similar to GAT, but from different location (Northern vs Southern Piedmont area). Therefore, we can conclude that even a reduced num-ber of chemical analyses (and so a less expensive strategy), together with a suitable classification methodology can be really effective in the considered task.
A weak point of the study could be the not very large number of available samples; however, compared with simi-lar studies, the sample size used in the work is definitely ade-quate and larger than the usual ones. The practical problem is that obtaining such samples is rather demanding, even if stardard analytical techniques are used. We plan to exploit approaches for generating syntethic data (from the real ones available), in such a way to extend the evaluation of the clas-sifiers to a larger set of data. We have already obtained some interesting preliminary results by learning, using PC algo-rithm [13], class-specific Linear Gaussian Bayesian Networks [6] as generative models for such synthetic data. The exper-imental evidence suggests that a data mining classification tool, on wine chemical profiles, can be suitably proposed to address the wine quality control issue.
6.
ACKNOWLEDGMENTS
The research was conducted with the financial support of the European Union, Italian Economy and Finance Ministry and the Regione Piemonte (POR-FESR 2007/2013 grants), as a part of TRAQUASwine project.
7.
REFERENCES
[1] F. Acevedo, J. Nez, S. Maldonado, E. Dom´ınguez, and A. Narv´aez. Classification of wines produced in specific regions by UV-visible spectroscopy combined with support vector machines. J. Agric. Food Chem., 55:6842–6849, 2013.
[2] I. Arvanitoyannis, M. Katsota, E. Psarra, E. Soufleros, and S. Kallithraka. Application of quality control methods for assessing wine authenticity: Use of multivariate analysis (chemometrics). Trends in Food Science and Technology, 10:321–336, 1999.
[3] G. Cooper and E. Herskovits. A bayesian method for the induction of probabilistic networks from data. Machine Learning, 9(4):309–347, 1992.
[4] P. Corteza, A. Cerdeirab, F. Almeidab, T. Matosb, and J. Reis. Modeling wine preferences by data mining
from physicochemical properties. Decision Support Systems, 47(4):547–553, 2009.
[5] S. G`omez-Meire, C. Campos, E. Falqu´e, F. D`ıaz, and F. Fdez-Riverola. Assuring the authenticity of northwest Spain white wine varieties using machine learning techniques. Food Research International, 60:230–240, 2014.
[6] M. Grzegorczyk. An introduction to Gaussian Bayesian Networks. In Systems Biology in Drug Discovery and Development, volume 662, pages 121–147. Springer, 2010.
[7] M. Hall, E. Frank, G. Holmes, B. Pfahringer, P. Reutemann, and I. Witten. The WEKA data mining software: An update. SIGKDD Explorations, 11(1):10–18, 2009.
[8] M. A. Hall. Correlation-based Feature Subset Selection for Machine Learning. PhD thesis, University of Waikato, Hamilton, New Zealand, 1998.
[9] D. Mattera and S. Haykin. Support vector machines for dynamic reconstruction of a chaotic system. In B. Sch¨olkopf, C. Burges, and A. Smola, editors, Advances in Kernel Methods, pages 211–241. MIT Press, 1999.
[10] J. Platt. Fast training of support vector machines using sequential minimal optimization. In B. Sch¨olkopf, C. Burges, and A. Smola, editors, Advances in Kernel Methods, pages 185–208. MIT Press, 1999.
[11] J. Platt. Probability for SV machines. In A. Smola, P. Batlett, B. Sch¨olkopf, and D. Schuurmans, editors, Advances in Large Margin Classifiers, pages 61–74. MIT Press, 2000.
[12] L. Portinale and L. Saitta. Feature selection. Technical Report D.14.1, Mining Mart Project, 2002.
http://mmart.cs.uni-dortmund.de/content/publications.html.
[13] P. Spirtes, C. Glymour, and R. Scheines. Causation, Prediction and Search. Springer Verlag, Berlin, 1993. [14] B. ¨Ust¨un, W. Melssen, and L. Buydens. Facilitating
the application of support vector regression by using a universal Pearson VII function based kernel.
Chemiometrics and Intelligent Laboratory Systems, 81:29–40, 2006.
[15] A. Versari, V. Laurie, A. Ricci, L. Laghi, and G. Parpinello. Progress in authentication, typification and traceability of grapes and wines by chemometric approaches. Food Research International, 60:2–18, 2014.
[16] K. Wagstaff. Machine learning that matters. In Proceedings of the 29 th International Conference on Machine Learning (ICML 09), Edinburgh, UK, 2012. [17] Y. Zhao, S. Yu, B. Chu, N. Zhang, and X. Hu.
Classification of three wine varieties based on ELM and PCA. In Lecture Notes in Computer Science, volume 7751, pages 647–654. 2013.