Data in Brief
Transcriptome pro
filing of sleeping, waking, and sleep deprived adult
heterozygous Aldh1L1
–eGFP-L10a mice
Michele Bellesi, Luisa de Vivo, Giulio Tononi, Chiara Cirelli
Dept. of Psychiatry, University of Wisconsin-Madison, 6001 Research Park Blvd, Madison, WI 53719, USAa b s t r a c t
a r t i c l e i n f o
Article history: Received 25 August 2015 Accepted 28 August 2015 Available online 1 September 2015 Keywords: Sleep Wake Sleep deprivation BacTRAP Microarray
Transcriptomic studies revealed that hundreds of mRNAs show differential expression in the brains of sleeping relative to awake rats, mice,flies, and sparrows. Although these results have offered clues regarding the molec-ular consequences of sleep and sleep loss, their functional significance thus far has been limited. This is probably because the previous studies pooled transcripts from all brain cells, including neurons and glia. In Bellesi et al. (2015)[1], we used the translating ribosome affinity purification technology (TRAP) and microarray analysis to obtain a genome-wide mRNA profiling of astrocytes as a function of sleep and wake. We used bacterial artificial chromosome (BAC) transgenic mice expressing eGFP tagged ribosomal protein L10a under the promoter of the Aldh1L1 gene, a highly expressed astrocytic gene. Using this approach, we could extract only the astrocytic mRNAs, and only those already committed to be translated into proteins (L10a is part of the translational machinery).
Here, we report a detailed description of the protocol used in the study (Bellesi et al., 2015[1]). Array data have been submitted to NCBI GEO under accession number (GSE69079).
© 2015 The Authors. Published by Elsevier Inc. This is an open access article under the CC BY-NC-ND license (http://creativecommons.org/licenses/by-nc-nd/4.0/).
Specifications Organism/cell line/tissue
Adult heterozygous Aldh1L1–eGFP-L10a mice
Sex Either sex
Sequencer or array type
Affymetrix GeneChip Mouse Genome 430 2.0 arrays Data format Raw data: cellfiles; Normalized data: xls file Experimental
factors
Sleep, spontaneous wake, 4 h sleep deprivation Experimental
features
Microarray dataset of the effects of sleep and wake on astrocytic gene expression
Consent All animal procedures followed the National Institutes of Health Guide for the Care and Use of Laboratory Animals and facilities were reviewed and approved by the IACUC of the University of Wisconsin-Madison
Sample source location
Madison, WI, US
1. Direct link to deposited data
http://www.ncbi.nlm.nih.gov/geo/query/acc.cgi?acc=GSE69079.
2. Experimental design, materials and methods 2.1. Experimental design
Three groups of adult heterozygous Aldh1L1–eGFP-L10a mice were used (n = 6/group): awake mice (W) were collected during the dark phase (~3–5 am) at the end of a long period of wake (N1 h, interrupted by periods of sleep ofb5 min), and after spending at least 70% of the pre-vious 6–7 h awake. Sleeping mice (S) were collected during the light pe-riod (~ 3–5 pm), at the end of a long period of sleep (N45 min, interrupted by periods of wake ofb4 min), and after spending at least 75% of the previous 6–7 h asleep. Sleep deprived mice (SD) were spon-taneously awake during most of the dark phase and then kept awake during thefirst 4 h of the light period by exposure to novel objects. 2.2. Video monitoring of sleep and wake
To avoid risks of tissue damage and inflammation due to the implant of EEG electrodes, video recordings were performed continuously with infrared cameras and used to determine the behavioral state of mice used in the study. We previously demonstrated that video-monitoring consistently estimates total sleep time with ~90% accuracy[2], although it cannot distinguish NREM sleep from REM sleep. Motor activity was quantified by custom-made video-based motion detection algorithms with a time resolution of 1 s. The program detects animal motion every second within a previously set monitored area corresponding to Genomics Data 6 (2015) 114–117
http://dx.doi.org/10.1016/j.gdata.2015.08.031
2213-5960/© 2015 The Authors. Published by Elsevier Inc. This is an open access article under the CC BY-NC-ND license (http://creativecommons.org/licenses/by-nc-nd/4.0/).
Contents lists available atScienceDirect
Genomics Data
the cage area, by calculating the numbers of pixels whose intensity changed over time. Specifically, it compares the last current image with the previous one and assigns a value in percent of changes in num-ber of pixels occurring every second. These values and the relative time are then saved in a txt reportfile and subsequently analyzed with custom-made Matlab scripts (MATLAB and Statistics Toolbox Release 2015a, The MathWorks, Inc., Natick, Massachusetts, United States)[3]. 2.3. Antibody preparation
To prepare antibody-bound beads Streptavidin MyOne T1 Dynabeads (Invitrogen) were incubated with biotinylated Protein L (Fisher Pierce) for 35 min at RT in PBS 0.1 M using gentle end-over-end rotation. Then, protein L-coated beads were collected on the DynaMag-2 magnet (Invitrogen) and washed five times with PBS 0.1 M containing 3% (w/v) IgG and Protease-free BSA (Jackson ImmunoResearch). Antibody binding was carried out in 0.15 M KCl buffer (20 mM Hepes–KOH, 5 mM MgCl2, 150 mM KCl, 1% NP-40, 0.5 mM DTT, and 100μg/ml Cycloheximide) for 1 h at room tempera-ture using gentle end-over-end rotation with 50μg each of two mono-clonal anti-GFP antibodies (19C8 and 19F7, Memorial Sloan-Kettering Cancer Center Monoclonal Antibody Core Facility). After antibody bind-ing, beads were washed and resuspended in 0.15 M KCl buffer. 2.4. Tissue collection, translating ribosome affinity purification and RNA extraction
The TRAP protocol has been developed by[4,5]and it has been also previously described in[6]. Under anesthesia S, SD and W mice (n = 6/ group) were decapitated and the forebrain regions (striatum and cere-bral cortex) were quickly dissected. Tissue was placed in 2 ml of chilled Lysis Buffer (20 mM Hepes KOH, 5 mM MgCl2, 150 mM KCl, 0.5 mM DTT, 100μg/ml Cycloheximide, protease inhibitors, 20 μl Rnasin, 20 μl Superasin) and homogenized with a Teflon-Glass homogenizer. Ho-mogenates were then centrifuged at 4 °C for 10 min at 2000 ×g to obtain a post-nuclear supernatant. NP-40 (1%final) and DHPC (30 mM final) were added to the supernatant, mixed by gentle inversion and incu-bated on ice for 5 min. Next, samples were again centrifuged at 4 °C for 10 min at 20,000 × g to obtain a post-mitochondrial supernatant. This fraction was combined with the GFP antibody-coated beads and in-cubated o/n with gentle end-over-end rotation at 4 °C. Beads were then collected with the magnet and washed four times in high-salt polysome wash buffer (20 mM Hepes–KOH, 5 mM MgCl2, 350 mM KCl, 1% NP-40, 0.5 mM DTT, and 100μg/ml Cycloheximide). After washes, beads were
collected, resuspended and vortexed in 100μl Lysis Buffer with ß-Mercaptoethanol from the Absolutely RNA Nanoprep kit (Agilent) and incubated for 10 min at RT. As illustrated inFig. 1a, the RNA was ex-tracted from both the immunoprecipitated (IP) and the supernatant (unbound fraction; UB) fractions. The IP RNA, which represents the mRNA immunoprecipitated from the astrocytes, was separated from the beads with the magnet and purified following the Nanoprep proto-col, while the UB RNA, which represents the mRNA of the remaining not precipitated cells, was isolated using the RNeasy Mini kit (Qiagen). Fi-nally, RNA levels in IP and UB samples were assessed by a Qubit Fluo-rometer (Invitrogen) with the Quant-iT RNA assay kit (Invitrogen, Q32852) and the quality of the RNA was assessed using the Agilent 2100 Bioanalyzer (Agilent) (seeFig. 1b for a representative example).
2.5. Microarray: labeling, hybridization and data analysis
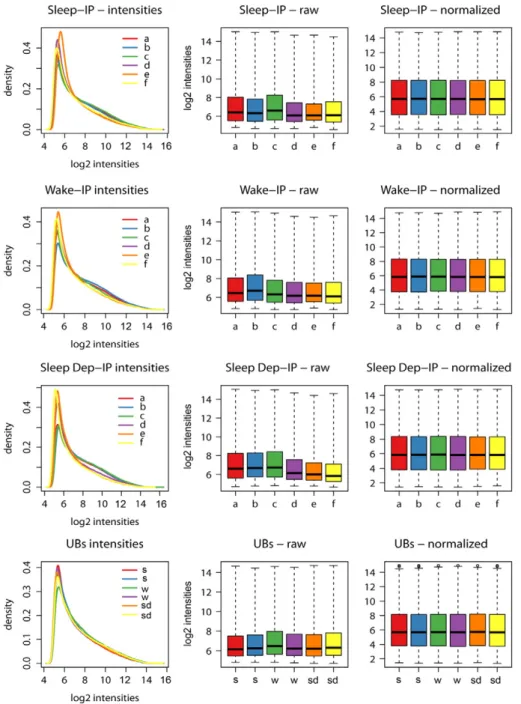
For IP and UB samples (6 IP and 2 UB for each of the 3 experimental groups, S, SD, W), 5 ng of purified mRNA was amplified with the Ovation Pico WTA system (NuGen, #3300). Five micrograms of amplified mate-rial was then fragmented, biotin labeled with the Encore Biotin Module (NuGen, #4200), hybridized to Affymetrix GeneChip Mouse Genome 430 2.0 arrays (n = 24, one chip per sample) following Affymetrix stan-dard protocol, and scanned using the GC3000 7G scanner (Affymetrix). Array data analysis was performed using the Bioconductor Limma pack-age[7]. For both IP and UB replicates, GeneChip Celfiles were imported into Bioconductor, data were converted to log2 scale, and normalized within each behavioral state group using Robust Multi-array Average (RMA)[8]implemented in the Bioconductor package affy (Fig. 2).
To obtain a measure of the enrichment, the expression intensity of each IP probeset was compared against its UB expression using the Welch's t-test with Benjamini and Hochberg FDR multiple test correc-tion. Probesets with IP/UB ratioN 2 and p b 0.01 were considered enriched, while probesets with IP/UB ratiob 2 and p b 0.01 were consid-ered depleted. Finally, to independently verify the validity of the TRAP method, IP/UB ratios for 200“top” genes previously found to be enriched in astrocytes, oligodendrocytes, and neurons[8]were calculated (Fig. 3).
Acknowledgments
This work was supported by National Institutes of Health (NIH) grant 1R01MH099231 to CC and GT.
Fig. 1. a. Summary scheme of the TRAP method. b. Representative purification of 18S and 28S rRNA from Aldh1L1–eGFPL10a transgenic mice (green) as detected by Bioanalyzer PicoChips (Agilent Technologies). Note that the purification did not occur in a wild type littermate used as a control (blue).
115 M. Bellesi et al. / Genomics Data 6 (2015) 114–117
Fig. 2. Distribution of probeset intensities for S, W, SD IP samples (first three rows; letters (a–f) indicate single mice) and for UB samples (last raw) before and after RMA normalization.
Fig. 3. Scatter plots show normalized mean expression values for IP (x-axis, n = 18, 6/group) and UB (y-axis, n = 6, 2/group) samples of S, W and SD groups. The middle diagonal black line indicates equal expression. In all three experimental groups, the top 200 genes identified by[8]as specific for astrocytes (red) are enriched in IP samples, whereas most of the top 200 genes specific for oligodendrocytes (yellow) and neurons (blue) are enriched in S, W and SD UB samples.
References
[1] M. Bellesi, L. de Vivo, G. Tononi, C. Cirelli, Effects of sleep and wake on astrocytes: clues from molecular and ultrastructural studies. BMC Biol. 13 (2015) 66,http://dx. doi.org/10.1186/s12915-015-0176-7.
[2] S. Maret, U. Faraguna, A.B. Nelson, C. Cirelli, G. Tononi, Sleep and waking modulate spine turnover in the adolescent mouse cortex. Nat. Neurosci. 14 (2011) 1418–1420,http://dx.doi.org/10.1038/nn.2934.
[3] M. Bellesi, V.V. Vyazovskiy, G. Tononi, C. Cirelli, F. Conti, Reduction of EEG theta power and changes in motor activity in rats treated with ceftriaxone. PLoS ONE 7 (2012), e34139,http://dx.doi.org/10.1371/journal.pone.0034139.
[4] J.P. Doyle, J.D. Dougherty, M. Heiman, E.F. Schmidt, T.R. Stevens, G. Ma, et al., Applica-tion of a translaApplica-tional profiling approach for the comparative analysis of CNS cell types. Cell 135 (2008) 749–762,http://dx.doi.org/10.1016/j.cell.2008.10.029.
[5] M. Heiman, A. Schaefer, S. Gong, J.D. Peterson, M. Day, K.E. Ramsey, et al., A transla-tional profiling approach for the molecular characterization of CNS cell types. Cell 135 (2008) 738–748,http://dx.doi.org/10.1016/j.cell.2008.10.028.
[6] M. Bellesi, M. Pfister-Genskow, S. Maret, S. Keles, G. Tononi, C. Cirelli, Effects of sleep and wake on oligodendrocytes and their precursors. J. Neurosci. 33 (2013) 14288–14300,http://dx.doi.org/10.1523/JNEUROSCI.5102-12.2013.
[7] R.C. Gentleman, V.J. Carey, D.M. Bates, B. Bolstad, M. Dettling, S. Dudoit, et al., Bioconductor: open software development for computational biology and bioinfor-matics. Genome Biol. 5 (2004) R80,http://dx.doi.org/10.1186/gb-2004-5-10-r80. [8] R.A. Irizarry, B. Hobbs, F. Collin, Y.D. Beazer-Barclay, K.J. Antonellis, U. Scherf, et al.,
Ex-ploration, normalization, and summaries of high density oligonucleotide array probe level data. Biostatistics 4 (2003) 249–264,http://dx.doi.org/10.1093/biostatistics/4.2. 249.
117 M. Bellesi et al. / Genomics Data 6 (2015) 114–117